

Comfort is Not Your Friend


John P. Hussman, Ph.D.
President, Hussman Investment Trust
May 2018
Abrupt market weakness is generally the result of low risk premiums being pressed higher. There need not be any collapse in earnings for a deep market decline to occur. Fundamentals don’t have to change overnight. There is in fact zero correlation between year-over-year changes in earnings and year-over-year changes in the S&P 500. Rather, low and expanding risk premiums are at the root of nearly every abrupt market loss.
John P. Hussman, Ph.D., July 30, 2007
The overall profile of market conditions continues to feature: 1) hypervaluation on the measures we find best-correlated with actual subsequent S&P 500 total returns, coupled with 2) continued deterioration in our measures of market internals, which are the most reliable tools we’ve found to gauge the psychological inclination of investors toward speculation or risk-aversion.
It bears repeating that valuations are remarkably informative about the prospects for market returns over horizons of about 10-12 years, but are nearly useless by themselves over shorter segments of the market cycle. Over those shorter horizons, market fluctuations are driven mainly by investor psychology. To measure that psychology, we can take advantage of the fact that investors tend to become indiscriminate when they are inclined to speculate. Speculative psychology is revealed by uniformity of market action across the full spectrum of securities and security-types, while breakdowns and divergences reveal growing risk-aversion.
Presently, we observe a particularly dangerous pairing of extreme valuations and deteriorating market internals. Coming off of one of the most extreme periods of overvalued, overbought, overbullish enthusiasm in market history, and coupled with hostile yield pressures and widening credit spreads in the debt markets, the current set of market conditions is easily among the most hostile in history.
A “risk-premium” is the extra future return, over and above risk-free investments, that gets built into the current price as compensation for accepting uncertainty. Yet in over three decades in the financial markets, I’ve rarely seen investors actually consider risk premiums directly, and those that do typically use ridiculously invalid methods (like the Fed Model) to estimate them. Most investors appear to gauge risk-premiums based on how the market has made them feel. After stock prices have already advanced for years, they imagine that risk premiums are high, and after stock prices have already collapsed, they imagine that risk premiums are low. They do this because they assess risk and return by looking backward instead of forward.
The truth is that when investors become willing to accept elevated market valuations and high stock prices, they are typically accepting very low risk premiums and future returns as compensation for accepting risk.
Conversely, when investors become fearful of depressed valuations and low stock prices, they are typically demanding very high risk premiums and future returns as compensation for accepting risk.
A market crash is nothing more than a period where low risk premiums are pushed abruptly higher. For that reason, the combination of thin risk premiums, increasing risk-aversion, and upward yield pressures is the single most negative set of conditions an investor can face. Ignore this paragraph to your detriment.
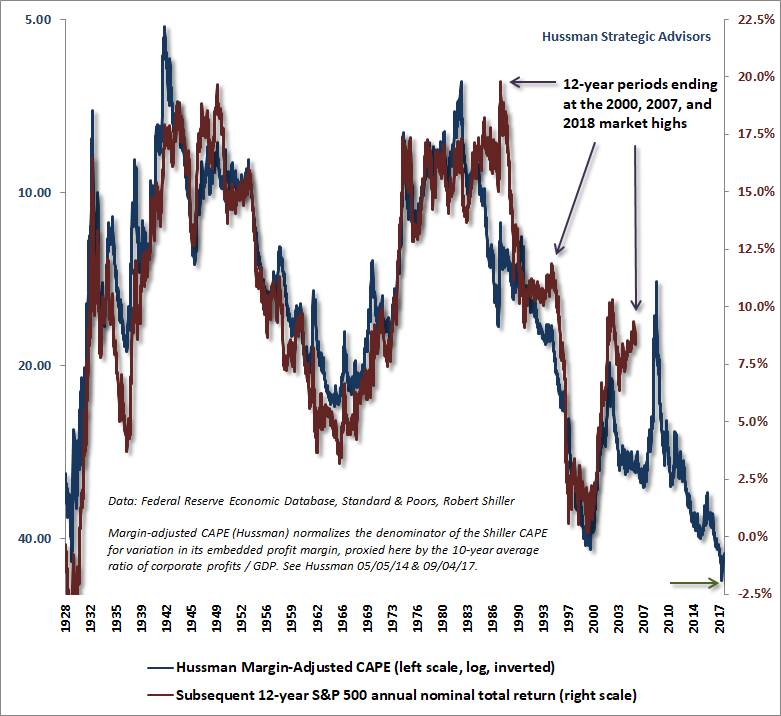
The chart below shows our own estimate of the prospective 12-year total return of the S&P 500, over and above the returns available on Treasury bonds over the same horizon. The red line shows the actual, realized risk premium of the S&P 500 over the subsequent 12-year period. From present starting valuations, the S&P 500 is likely to materially underperform even low-yielding Treasury bonds in the years ahead.

Comfort is not your friend
After the 1990 bear market decline, one of several factors (along with valuations and market action) that prompted me to encourage a bullish and leveraged position was the fact that the economy seemed hopelessly mired in recession and consumer confidence kept setting fresh lows. The same was true in early 2003 when we shifted to a constructive market outlook after anticipating the 2000-2002 collapse. Ditto for my late-2008 shift to a constructive market outlook, though that shift was truncated by my 2009 insistence on stress-testing our methods against Depression-era data (while we anticipated the 2007-2009 collapse, the disruption in the credit and employment markets were outside of anything observed in post-war data. I’ve regularly reviewed the difficulty that followed that stress-testing stumble and how we’ve adapted).
The key point is that strong investment opportunities are almost always born out of discomfort. Likewise, market collapses are almost always born out of confidence and euphoria.
Markets peak when investors feel confidence about the economy, are impressed by recent market gains, and are comforted by the perception of safety and resilience that follows an extended market advance. So several features generally go together: 1) extreme optimism about the economy and corporate earnings, 2) depressed risk-premiums, and 3) steep market valuations. Poor subsequent market returns ultimately follow, though not always immediately.
In contrast, markets trough when investors are frightened about the economy, are terrified by recent market losses, and are paralyzed by the perception of risk and fragility that follows an extended market decline. So several features generally go together: 1) extreme pessimism about the economy and corporate earnings, 2) steep risk-premiums, and 3) depressed market valuations. Strong subsequent market returns ultimately follow, though not always immediately.
The chart below illustrates this regularity. The areas shaded in red are rather comfortable periods, featuring an unemployment rate below 5% and within 1% of a 3-year low, an S&P 500 price/revenue ratio above 1.15, typically reflecting a period of strong recent market gains, and an ISM purchasing managers index above 50, reflecting expectations for an expanding economy. Notably these periods of comfort were followed by S&P 500 total returns averaging zero over the following 3-year period, with deep interim losses more often than not.
In contrast, the areas shaded in green are rather uncomfortable periods, featuring an unemployment rate above 5% and within 1% of a 3-year high, an S&P 500 price/revenue ratio below 1.15, typically reflecting a recent period of dull returns or market losses, and an ISM purchasing managers index below 50, reflecting expectations of a contracting economy. Notably, these periods of discomfort were followed by S&P 500 total returns averaging 15.3% annually over the following 3-year period.
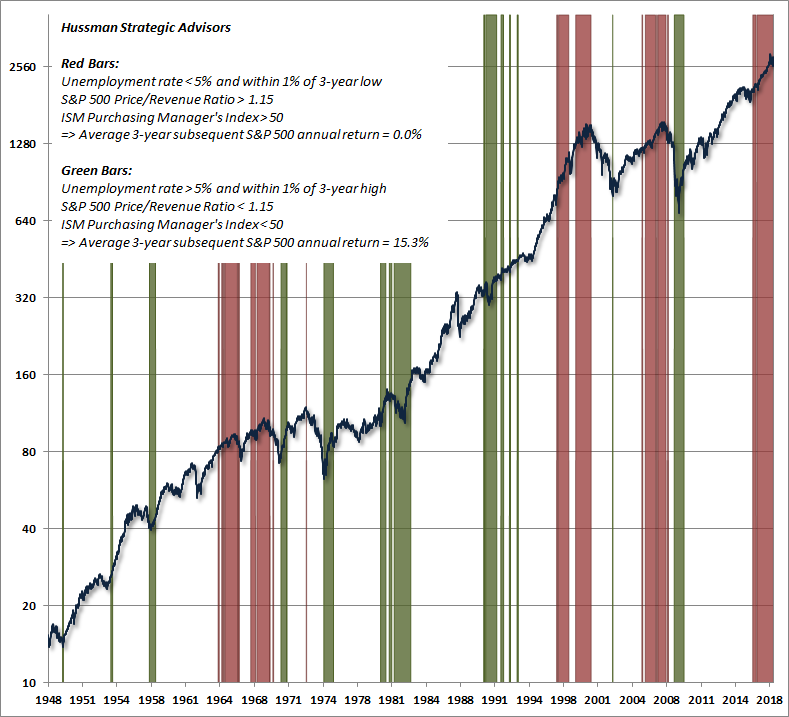
Examine the periods shaded in red, and you’ll typically find points even years later where stocks had made no progress at all. By contrast, the periods shaded in green, more often than not, were followed by significant market advances (though not always immediately).
As a side-note, we find that the S&P 500 price/revenue ratio, nonfinancial market capitalization/gross value-added, market captalization/GDP, enterprise value/GDP, and our margin-adjusted CAPE are all more strongly correlated with subsequent S&P 500 total returns than any other valuation measures we’ve examined across history (easily outperforming popular measures like price/forward operating earnings, the Shiller CAPE, and the Fed Model). One can approximate the signals above by substituting other reliable valuation measures for price/revenue, using a similar threshold to define overvaluation.
For the price/revenue ratio, about 40% of periods since 1950 had multiples in excess of 1.15. That threshold between reasonable valuation and overvaluation should concern investors here, because S&P 500 revenues have grown at a nominal annual rate of 3% or less in recent decades. Without years of rapid growth, getting from the current 2.16 price/revenue multiple to even the top of the “reasonable” threshold at 1.15 would require a market loss of about -47%.
These signals certainly don’t comprise a robust strategy, but it’s worth noting that in historical data, holding stocks from the first green point until the next red point, and exiting from the first red point until the next green point, easily dominates a strategy of entering and exiting based on the S&P 500 200-day moving average, with smaller interim losses.
The upshot is straightforward: the best investment opportunities emerge from reasonably valued markets and uncomfortable economic conditions, while the worst risks emerge from richly valued markets and comfortable economic conditions.
Investors make a very expensive habit of buying stocks at elevated valuations because things feel very comfortable, which is exactly what they are doing now. Later, they sell stocks at depressed valuations because things feel very uncomfortable. Over the complete market cycle, that constant desire for comfort is extremely costly.
Strong investment opportunities are almost always born out of discomfort. Likewise, market collapses are almost always born out of confidence and euphoria.
What made the recent cycle unusual in that respect is that the Federal Reserve’s deranged policy of zero interest rates encouraged investors to speculate even after euphoria and extreme “overvalued, overbought, overbullish” syndromes repeatedly emerged. That speculation finally amplified valuation extremes beyond what we observed at the 1929 and 2000 market peaks. It was certainly an aspect of this half-cycle that we had to adapt to (by requiring explicit deterioration in market internals before adopting a negative market outlook, regardless of the severity of “overvalued, overbought, overbullish” conditions, and with no exceptions).
But the relationship between euphoria and subsequent loss hasn’t been repealed. Rather, the duration of this episode of euphoria has been stretched to an extent that will make the depth of subsequent losses far worse than in most prior market cycles.
Based on the valuation measures we find best correlated with actual subsequent market returns across history, I continue to expect the S&P 500 to lose nearly two-thirds of its value over the completion of the current market cycle, with slightly negative total returns on a 10-12 year horizon.
Valuation notes
Despite valuations that remain offensive from the standpoint of long-term investment, remember that valuations alone are not enough for us to adopt a negative market outlook. If we observe enough improvement in market internals to conclude that investors have again taken the speculative bit in their teeth, the immediacy of our concerns will be deferred, and our near-term market views will become much more neutral (or even slightly constructive, though with a safety net in any event).
For now, investors should not rule out the potential for steep market losses. In the context of a market that would have to decline by about two-thirds to just to reach run-of-the-mill historical norms on reliable valuation measures, the losses we observed in February and March were next-to-nothing.
It’s worth emphasizing again that if interest rates are low because growth rates are also low (as we presently observe), no valuation premium is “justified” by the low interest rates at all. To the contrary, even historically normal valuation multiples would be associated with below-average expected future returns, by virtue of the lower growth rate. See my prior market comments of recent months for extensive evidence on this point.
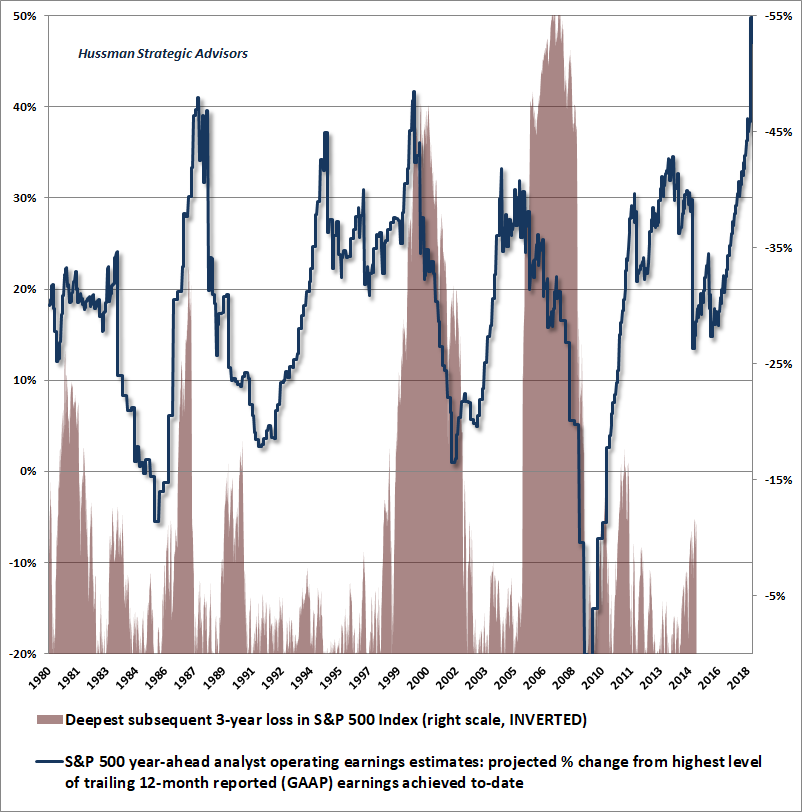
Meanwhile, Wall Street is highly enthusiastic about its own estimates of year-ahead operating earnings. Still, it’s difficult to see why anyone would dream of quoting the S&P forward operating P/E ratio without adjusting for its embedded profit margin. Doing so today is equivalent to assuming 2019 operating earnings will jump by 46%, to highest operating profit margins in history, that those extreme profit margins will be permanent, and that operating earnings will follow by growing at historically normal rates thereafter.
If we conceptualize “optimism” as dreams/reality-1, the chart below offers a sense of how much optimism is embedded into expectations here. The blue line shows the percentage difference between Wall Street analyst estimates of S&P 500 year-ahead “forward operating earnings” and the highest level of actual reported earnings achieved to-date. The reason that “forward operating P/E ratios” for the S&P 500 have dropped in recent months is that forward earnings estimates have soared.
As I’ve noted before, only about 10% of this gain can be properly anticipated as a result of recent tax reductions. The rest is largely analyst optimism. The red shading shows the largest loss in the S&P 500 over the following 3-year period (right scale, inverted – weekly closing data – in daily data the 1987 collapse exceeded -33%). While optimistic earnings estimates don’t always imply steep market losses, they certainly do nothing to remove that risk. Indeed, the 1987, 2000 and 2007 market plunges all came on the heels of strong optimism about earnings.
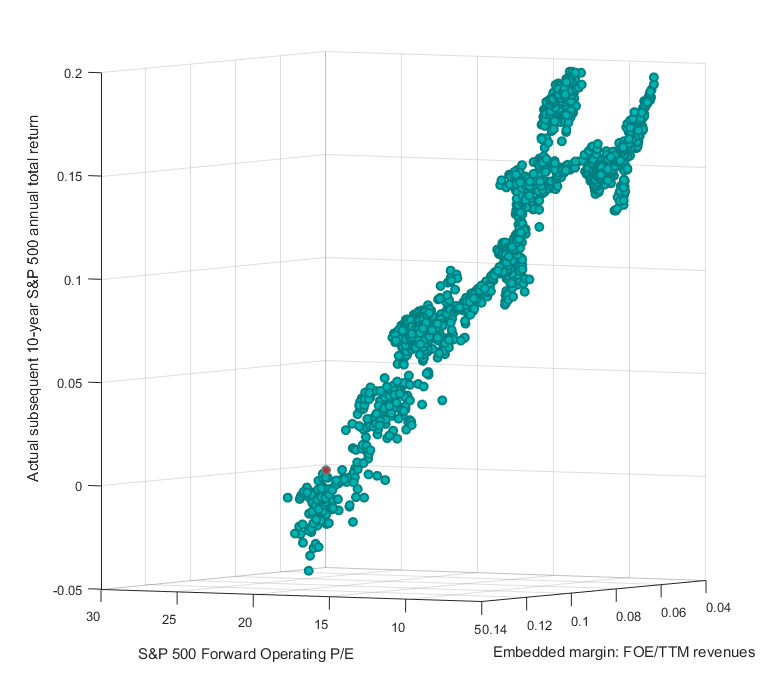
The chart below offers a 3-dimensional view of the S&P 500 forward operating P/E ratio, S&P 500 profit margins, and actual subsequent 10-year S&P 500 total returns. The red dot shows current values, but the 10-year return of approximately zero is estimated based on other actual outcomes.
The diagonal shape of the scatter illustrates a familiar regularity that we observe in nearly every earnings-based valuation multiple: the worst market returns follow periods that feature some combination of high valuations and high profit margins. When you observe the two together, you can infer that investors are paying for future cash flows twice. It has always been a mistake to pay a high S&P 500 price/earnings multiple once earnings are already cyclically-elevated.
Mean reversion is terribly misunderstood. Some observers argue that valuations don’t mean-revert anymore, because valuations are elevated here. They argue that profit margins don’t mean-revert anymore, because profit margins are elevated here. They run a trend-line through a historical chart of valuations or profit margins and say: “See? The trend-line has gone up over time.” In effect, their entire conclusion about mean-reversion relies on the position of valuations or profit margins at present. The whole analysis depends on the endpoint, and it throws away an enormous amount of information.
As I observed in 2014, “We test mean reversion in X not by examining X itself, but by relating X to some representative fundamental F then checking whether future changes in X are inverse to the present X/F”.
For example, if we choose X as earnings and F as revenues, mean-reversion would suggest that higher profit margins should be associated with weaker subsequent earnings growth. Indeed, that’s exactly what we observe across history for both reported (GAAP) earnings and operating earnings. Frankly, we’ll be somewhat surprised if S&P 500 earnings grow at all between now and 2021.
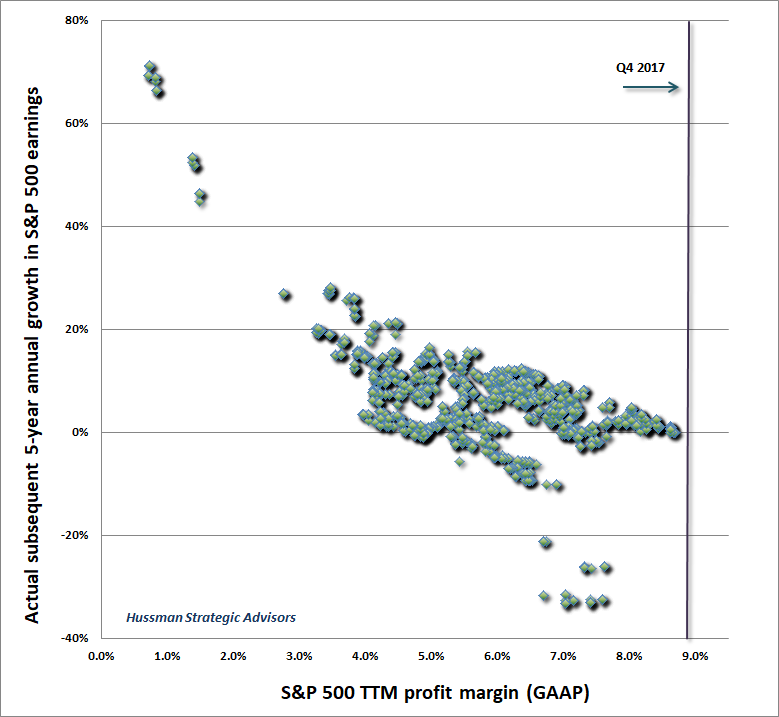
The economic case for likely narrowing in profit margins is straightforward. I’ve regularly emphasized that the elevated profit margins in recent years are a mirror image of depressed wages as a share of GDP and corporate revenues, which itself is largely an artifact of the severe labor market slack that followed the global financial crisis. With the unemployment rate now below 4%, this situation is unlikely to continue. Indeed, we’re already observing wage inflation in excess of inflation in general prices. This shouldn’t be a surprise, because the only valid interpretation of the Phillips Curve is as a relationship between labor market slack and real wages.
It has always been a mistake to pay a high S&P 500 price/earnings multiple once earnings are already cyclically-elevated.
The same general approach can be used to demonstrate mean-reversion in market valuations. Suppose that we choose X to be stock prices and F to be revenues (or equivalently, earnings adjusted for their embedded profit margins). Even if valuations are extremely high at a given point in time, it doesn’t follow that we can reject mean-reversion.
What we’re actually interested in is whether future market returns are inverse to the present level of valuations. On that front, we find every bit of evidence that valuations mean-revert over time, and that steep valuations are associated with predictably dismal future returns, especially over a 10-12 year horizon.
Still, we should be clear market valuations would be extreme even if we were to assume no mean-reversion in profit margins at all. One useful way to show this (which I introduced back in the late-1990’s) is to examine the ratio of the S&P 500 to the highest level of earnings achieved over the preceding decade. Unlike the Shiller cyclically-adjusted P/E, this measure doesn’t involve any prior averaging of earnings. It does prevent the uninformative spike in the price/earnings ratio that often occurs during recessions as a result of collapsing earnings, but it does not make any downward adjustment to record earnings or profit margins.
As a result, this measure should be the most conservative and least extreme in periods like today, when earnings and profit margins are at record highs. Yet it’s actually at the highest level in 147 years of data, with the exception of 2000.
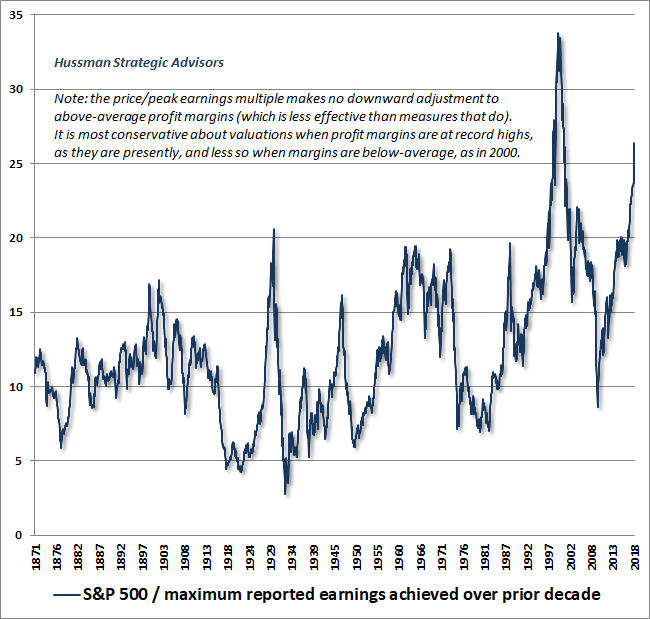
Now, here’s the problem. In 2000, S&P 500 profit margins were below their historical average – a fact that partially excuses the extreme level the price/earnings ratio reached at that time. Today, there is no such excuse. And it’s for that reason that our margin-adjusted CAPE (presented earlier) reached the highest level in history in late-January.
Near-term considerations
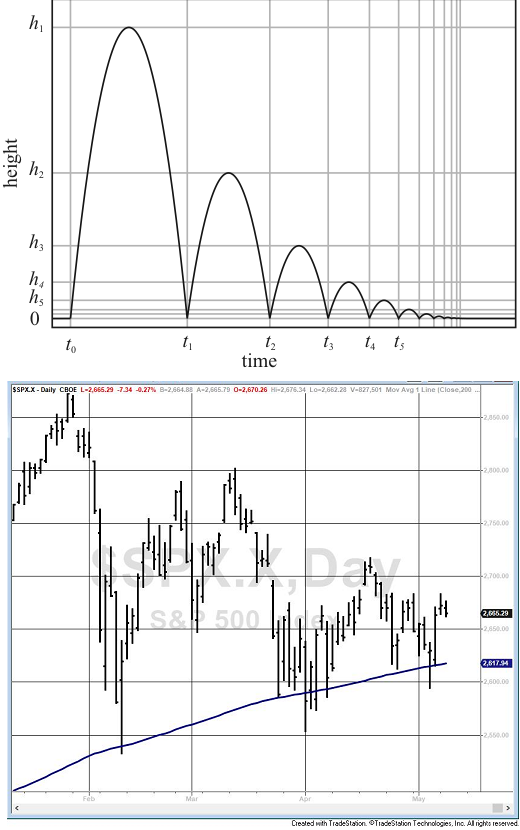
With respect to near-term market behavior, the market has been fluctuating since February much like a ball does as it loses its kinetic energy. With each downward move toward the 200-day moving average on the S&P 500, the upward bounces have become progressively weaker. There’s no assurance that investors won’t shift back to speculative psychology, and we continue to monitor market internals on that front, but at present, the tendency of investors to buy dips in the market is showing gradually weakening follow-through.
The chart below illustrates a bouncing ball losing half of its kinetic energy on each successive bounce (h/t Jonathan Feucht), which looks a bit like the behavior of the S&P 500 relative to its 200-day moving average.
While a clear break of the February market lows could provoke a concerted attempt by trend-following investors to exit the market (with little interest from value-conscious investors at those levels), we already observe the same combination of extreme valuations and divergent market internals that we observed at the 2000 and 2007 peaks. We always have to allow for a shift in the behavior of market internals, so the fact that they’re unfavorable here doesn’t necessarily imply that the full cycle has shifted from bull market to bear market. Still, nothing we observe – including the behavior of earnings, employment, or the economy – is inconsistent with that possibility.
It’s a very dangerous thing when analysts on financial television say “you can’t have a bear market here because X is still true.” Those statements are even more dangerous when they are inconsistent with historical data. Last week, I heard an analyst say that bear markets don’t start when earnings are still growing. That’s not true at all. It’s after prices are already collapsing that earnings growth suddenly drops like a rock.
For our part, we’re tightly focused on the uniformity and divergence of market action across a broad range of securities. That internal market action deteriorated further last month, despite fairly sideways movement in the major indices. We would pay particular attention to credit spreads here (the difference in yields between riskier corporate debt and Treasury securities), particularly any increases in corporate yields that are accompanied by flat or declining Treasury bond yields.
In the equity markets, be alert about the potential for coordinated selling should February’s lows be taken out. We’d also monitor European bank stocks, and any tendency for stocks to become highly volatile over progressively short intervals.
My comments approaching the 2007 market peak and the global financial crisis provide an appropriate end to this discussion, and offer a sense of the kind of market action that would amplify our immediate concerns.
“One of the best indications of the speculative willingness of investors is the ‘uniformity’ of positive market action across a broad range of internals… I’ve noted over the years that substantial market declines are often preceded by a combination of internal dispersion, where the market simultaneously registers a relatively large number of new highs and new lows among individual stocks, and a leadership reversal, where the statistics shift from a majority of new highs to a majority of new lows within a small number of trading sessions.
“This is much like what happens when a substance goes through a ‘phase transition,’ for example, from a gas to a liquid or vice versa. Portions of the material begin to act distinctly, as if the particles are choosing between the two phases, and as the transition approaches its ‘critical point,’ you start to observe larger clusters as one phase takes precedence and the particles that have ‘made a choice’ affect their neighbors. You also observe fast oscillations between order and disorder in the remaining particles. So a phase transition features internal dispersion followed by leadership reversal. My impression is that this analogy also extends to the market’s tendency to experience increasing volatility at 5-10 minute intervals prior to major declines.”
– John P. Hussman, Ph.D., Market Internals Go Negative, July 30, 2007
Keep Me Informed
Please enter your email address to be notified of new content, including market commentary and special updates.
Thank you for your interest in the Hussman Funds.
100% Spam-free. No list sharing. No solicitations. Opt-out anytime with one click.
By submitting this form, you consent to receive news and commentary, at no cost, from Hussman Strategic Advisors, News & Commentary, Cincinnati OH, 45246. https://www.hussmanfunds.com. You can revoke your consent to receive emails at any time by clicking the unsubscribe link at the bottom of every email. Emails are serviced by Constant Contact.
The foregoing comments represent the general investment analysis and economic views of the Advisor, and are provided solely for the purpose of information, instruction and discourse.
Prospectuses for the Hussman Strategic Growth Fund, the Hussman Strategic Total Return Fund, the Hussman Strategic International Fund, and the Hussman Strategic Dividend Value Fund, as well as Fund reports and other information, are available by clicking “The Funds” menu button from any page of this website.
Estimates of prospective return and risk for equities, bonds, and other financial markets are forward-looking statements based the analysis and reasonable beliefs of Hussman Strategic Advisors. They are not a guarantee of future performance, and are not indicative of the prospective returns of any of the Hussman Funds. Actual returns may differ substantially from the estimates provided. Estimates of prospective long-term returns for the S&P 500 reflect our standard valuation methodology, focusing on the relationship between current market prices and earnings, dividends and other fundamentals, adjusted for variability over the economic cycle.