

Mind the Trap Door


John P. Hussman, Ph.D.
President, Hussman Investment Trust
July 2018
In recent decades, there have been points where stocks were steeply overvalued (as I observed in 2000, 2007, and of course, in recent years), clearly undervalued (as I observed in 1990 and late-2008), and neutral enough to adopt a constructive outlook based on improved market internals (as I observed in early-2003). Regardless of the situation, I’ve always emphasized a key fact: valuations have a profound impact on 10-12 year market returns, and on potential losses over the completion of any market cycle, but have little impact on market outcomes over shorter segments of the market cycle.
This has clearly been true in recent years. A moment’s thought should make it obvious that the stock market was only able to reach extremes like those of 1929, 2000, and today because valuations failed, for some portion of the market cycle, to collapse from less extreme levels. So while valuations haven’t “worked” in recent years, as is often the case during speculative periods, there’s nothing in recent market behavior to suggest that the relationship between valuations and subsequent full-cycle market returns has changed at all. Investors who believe that valuations have somehow become irrelevant because they haven’t “worked” in recent years simply don’t understand how valuations actually work.
Before discussing the profile of risks facing investors at present, it will help to quickly review the central considerations of our investment discipline.
While valuations are the main drivers of long-term, full-cycle market outcomes, they often say very little about market outcomes over periods substantially shorter than 10-12 years. On shorter horizons, investor psychology matters more. How does one measure that? I’ve frequently emphasized that when investors are inclined to speculate, they tend to be indiscriminate about it. So the uniformity or divergence of market internals across a broad range of securities tells us a great deal about whether investors are inclined toward speculation or risk-aversion. Indeed, the condition of market internals (what I used to call “trend uniformity”) is the main feature that distinguishes an overvalued market that moves higher from an overvalued market that drops like a rock.
In our own methods, we extract a signal about speculation or risk-aversion from the uniformity or divergence of market action across thousands of individual securities, sectors, industries, and security-types, including debt securities of varying creditworthiness. We don’t publish those methods, but suffice it to say that when the market demonstrates divergences and breakdowns in the behavior of various sectors, that loss of “uniformity” is often a signal that investor preferences have subtly shifted toward risk-aversion. Conversely, we find that the most favorable market return/risk profiles typically emerge at the point where a material retreat in valuations is joined by an early improvement in market internals.
Be careful not to equate market internals with trend-following objects like 200-day moving averages. Trend-following measures can be useful components of an overall market assessment, but information is best drawn from multiple sensors, rather than single indicators. As a practical matter, it’s worth noting that from the March 9, 2009 market low to the present date, the S&P 500 has enjoyed nearly as much of its cumulative gain in periods when the previous close of the S&P 500 was below its 200-day average as when the index was above it.
So what was legitimately “different” about the recent advancing half-cycle? The difference wasn’t about valuations. It wasn’t about market internals. It was about limits. In prior market cycles across history, a particular set of market conditions offered a reliable warning that speculation had reached its limits. Once market action was characterized by a full syndrome of “overvalued, overbought, overbullish” features, the market typically became vulnerable to air-pockets, panics, and crashes. If market internals hadn’t already deteriorated, they typically did shortly after those “overvalued, overbought, overbullish” warning signals emerged. So historically, one could respond to those warning signals pre-emptively, adopting a negative market outlook even before internals had explicitly deteriorated. Not this time. Once interest rates hit zero, unlike previous market cycles, these warning signals posed no limit to continued speculation.
Our emphasis on those syndromes turned out to be our Achilles Heel in recent years. The methods that came out of our 2009-2010 stress-testing against Depression-era data had prioritized those syndromes, based on their reliability across history. In hindsight, imagining there was some limit to speculative recklessness was my greatest error in over three decades as a professional investor.
Even after rates lifted away from zero, those “overvalued, overbought, overbullish” syndromes continued to exert little effect, largely because of post-election enthusiasm about tax cuts. Late last year, we adapted our methods to prioritize the condition of market internals ahead of those “overvalued, overbought, overbullish” warning signs, with no exceptions. Sufficiently extreme market conditions can still encourage us to take a neutral outlook, but in all cases, zero interest rates or not, market internals have to deteriorate explicitly in order for us to adopt or amplify a negative market outlook.
What was legitimately ‘different’ about the recent advancing half-cycle? The difference wasn’t about valuations. It wasn’t about market internals. It was about limits.
Unlike much of the recent bull market, present market conditions reflect not only extreme valuations (including a full syndrome of overvalued, overbought, overbullish features), but also divergence and dispersion in our measures of market internals. It’s that deterioration in market internals that threatens to unleash the beast that has been patiently biding its time within extreme valuations. Given those extreme valuations, I continue to believe that the completion of this market cycle will be a terrible ordeal for passive investors.
As a reminder of how all of this works in the financial markets, recall how these factors were reflected in my own comments at the 2000 and 2007 bubble peaks:
October 3, 2000: “The information contained in earnings, balance sheets and economic releases is only a fraction of what is known by others. The action of prices and trading volume reveals other important information that traders are willing to back with real money. This is why trend uniformity is so crucial to our Market Climate approach. Historically, when trend uniformity has been positive, stocks have generally ignored valuation, no matter how extreme. When the market loses that uniformity, valuations often matter suddenly and with a vengeance. This is a lesson best learned before a crash rather than after one. Valuations, trend uniformity, and yield pressures are now uniformly unfavorable, and the market faces extreme risk in this environment.”
July 30, 2007: “One of the best indications of the speculative willingness of investors is the ‘uniformity’ of positive market action across a broad range of internals. Probably the most important aspect of last week’s decline was the decisive negative shift in these measures. Since early October of last year, I have at least generally been able to say in these weekly comments that ‘market action is favorable on the basis of price trends and other market internals.’ Now, it also happens that once the market reaches overvalued, overbought and overbullish conditions, stocks have historically lagged Treasury bills, on average, even when those internals have been positive (a fact which kept us hedged). Still, the favorable market internals did tell us that investors were still willing to speculate, however abruptly that willingness might end. Evidently, it just ended, and the reversal is broad-based.”
Valuation review
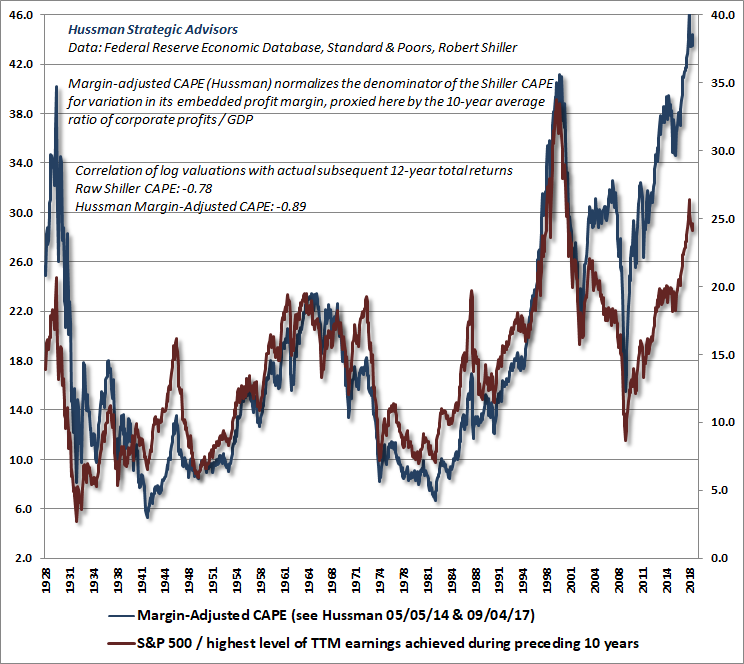
The single most reliable valuation measure we’ve ever tested or introduced is the ratio of nonfinancial market capitalization to corporate gross-value added (including estimated foreign revenues). Last week, that measure pushed back into the top 0.5% of all historical observations, to a level exceeded only by the 2000 market peak and the recent February 2018 market peak. Our margin-adjusted CAPE has just slightly lower reliability, but benefits from a much longer data history. The margin-adjusted CAPE substantially improves the reliability of Robert Shiller’s cyclically-adjusted P/E by adjusting for variations in the profit margin embedded into the earnings figure.
One of the problems with ordinary price/earnings multiples is that they typically experience an uninformative spike higher when earnings collapse during a recession. Back in the 1990’s, I introduced a simple way to address that issue, which is to take the ratio of the S&P 500 to the highest level of earnings it has achieved over the previous, say, 10 years. I called the price/peak-earnings multiple (PPE) – it’s sometimes called the “Hussman P/E”, though several other measures we’ve introduced over time are more reliable. Since it always reflects the most record earnings peak, it’s one of the lowest and most favorable-looking P/E ratio one could choose, so it’s important to examine it over the longest history possible. The main pitfall is that whenever earnings are at a record level, the PPE takes the associated profit margin at face value. If that’s actually what you want to assume, the PPE will do the trick.
The chart below provides an overlay of our margin-adjusted CAPE and our price/peak-earnings ratio. With the exception of the 2000 peak, both measures exceed every previous market peak in history, including 1929 and 2007. The difference between these measures in 2000 occurs because S&P 500 profit margins at the 2000 peak were actually below-average, while profit margins at other market peaks have typically been above-average. When one adjusts for the level of profit margins, the recent market highs clearly represent the most extreme valuations in history (blue line). By contrast, if one takes profit margins at face value, the 2000 peak was more extreme, because the below-average profit margins at that peak resulted in a relatively depressed earnings figure and a much more extreme P/E ratio.
A moment’s thought should make it obvious that the stock market was only able to reach extremes like those of 1929, 2000, and today because valuations failed, for some portion of the market cycle, to collapse from less extreme levels.
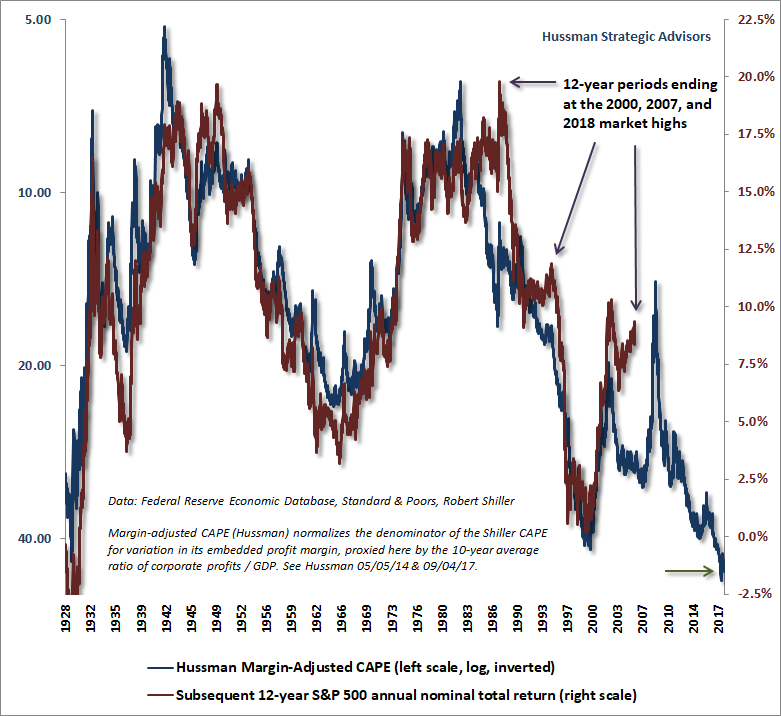
Since a valuation ratio is really just shorthand for a proper discounted cash flow analysis, a good valuation ratio should always use a fundamental that is representative and proportional to the very, very long-term stream of cash flows that investors can expect stocks to deliver over time. Current earnings are simply too volatile over economic cycles to provide that kind of “sufficient statistic.” Margin-adjusted measures, including market cap/corporate gross value-added, enterprise value/gross value-added, market price/revenue, and our margin-adjusted CAPE serve that role well. Not surprisingly, they are also better correlated with actual subsequent market returns than any other measure we’ve identified over time.
Below, our margin-adjusted CAPE is presented on an inverted log scale (blue), along with the actual S&P 500 average annual nominal total return over the following 12-year period. At the January 2018 market highs, our most reliable measures of market valuation stood at nearly three times their historical norms, driving our estimates of 10-12 year S&P 500 total returns to negative levels, and creating the likelihood of an interim market loss on the order of -65%.
Mind the trap door
Because even steeply overvalued markets can continue higher provided that investors are inclined to speculate, a certain amount of flexibility is required in the way that we talk about market conditions. Presently, we observe a combination of extreme valuations and divergent market internals. This combination suggests that investors have shifted toward risk-aversion at a point where risk premiums are unusually low, and it opens up a trap door that has historically permitted very steep market losses, as we observed in 2000-2002 and 2007-2009.
While I’m inclined to view the January market high as the bull market peak for this cycle, which would suggest that stocks are already in a bear market, we also have to allow for the possibility that investors will again take the speculative bit in their teeth, which we would infer from the behavior of market internals. There’s no assurance that stocks have entered a bear market, nor does our investment success require stocks to collapse. It’s just that in the presence of both extreme valuations and deteriorating market internals, investors had better allow for that possibility, and even its likelihood.
The key lesson of the recent half-cycle was that we can’t rely on the existence of any well-defined limit to speculation, particularly in a world where deranged monetary policy may become a permanent feature. Even when extreme “overvalued, overbought, overbullish” warning signs are present, we now require explicit deterioration in market internals before adopting a negative market outlook. That, however, is far different than saying that extreme conditions can be ignored altogether. With market internals negative here, and a variety of fresh breakdowns during the past several trading sessions, underlying market risks may be expressed abruptly, and with unexpected severity.
At the beginning of February, as the market was perched near its highs, I observed “My impression is that the first leg down will be extremely steep, and that a subsequent bounce will encourage investors to believe the worst is over.” The behavior of the market since then has been consistent with that view, and as the market has bounced to recover part of its initial loss, our primary focus has been on any measures of internal deterioration and dispersion that could suggest a fresh wave of losses. I’ve also noted the importance of factors such as credit spreads and European banks, which I view as more salient aspects of financial risk than the rather vague ebb-and-flow of concerns over tariffs and trade.
Over the past week, we’ve observed a concerted shift in many of these measures, which suggests a subtle but meaningful change in the perceptions of investors toward risk. These shifts include, for example:
This sort of concerted shift often contains information content, and investors discover much later what the internal turbulence was really about. The shifts are particularly notable when they occur in periods where our broader measures of internals are unfavorable, valuations are extreme, and they involve multiple technical breakdowns simultaneously.
Frankly, the behavior is reminiscent of the 2007 peak, just before the global financial crisis, when I wrote “It’s already clear that low risk premiums are being pressed decisively higher. Market breadth has deteriorated. Leadership has also reversed decisively. I’ve noted over the years that substantial market declines are often preceded by a combination of internal dispersion, where the market simultaneously registers a relatively large number of new highs and new lows among individual stocks, and a leadership reversal, where the statistics shift from a majority of new highs to a majority of new lows within a small number of trading sessions.”
Even when extreme ‘overvalued, overbought, overbullish’ warning signs are present, we now require explicit deterioration in market internals before adopting a negative market outlook. That, however, is far different than saying that extreme conditions can be ignored altogether. With market internals negative here, underlying market risks may be expressed abruptly, and with unexpected severity.
Two considerations are important to keep in mind. First, our heightened concerns are rooted in the fact that our measures of market internals are clearly negative here. An improvement in market internals would shift us to a neutral or constructive near-term outlook (though with a strong safety net in any event), despite valuations that suggest dismal long-term and full-cycle prospects for stocks. Second, our concerns are driven by the convergence of multiple aspects of market action, not by any single measure.
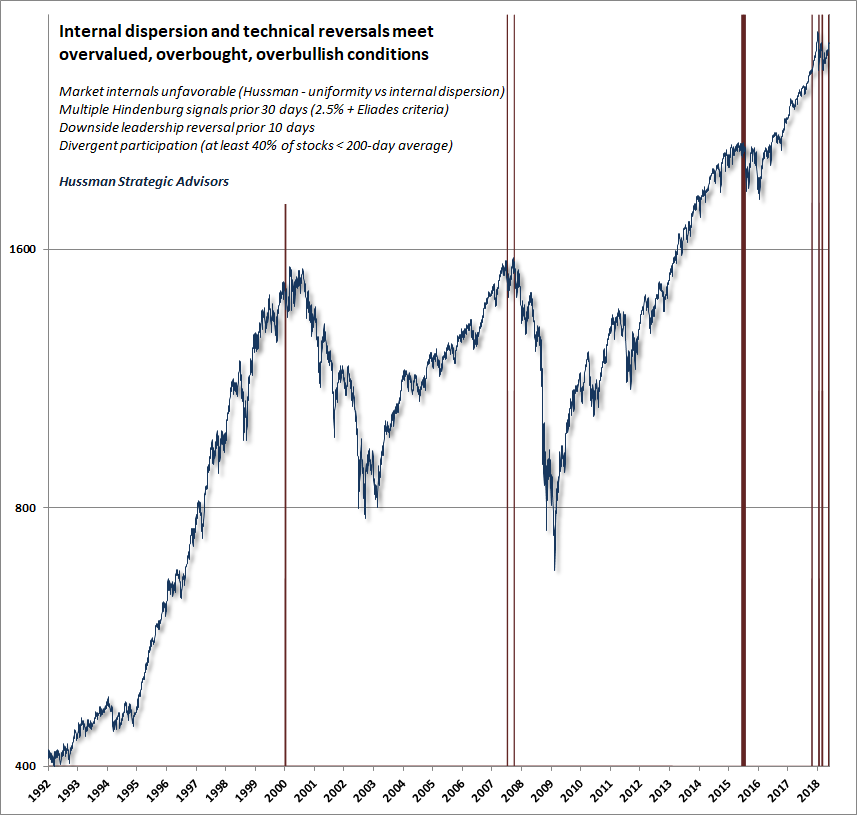
The chart below provides an indication of my concerns here. The red bars are not simply periods of “overvalued, overbought, overbullish” market action. If there’s one thing to emphasize about the recent half-cycle, it’s that these syndromes were not enough, in themselves, to justify a negative market outlook. Rather, the red bars show points where overvalued, overbought, overbullish market action was joined by the features that we currently observe: unfavorable market internals, tepid participation among individual stocks, a confirmed Hindenburg syndrome, and a recent leadership reversal.
Emphatically, this combination of conditions isn’t necessary for a market peak, and it doesn’t precisely identify market peaks. This isn’t an infallible indicator. It’s an information signal. Specifically, this combination of market conditions informs investors “stocks are overvalued, market conditions are overbought, and sentiment is lopsided to the bullish side, yet despite this strength on the surface, market internals are deteriorating, there is substantial internal divergence and lack of participation among individual stocks, and market leadership is shifting to the downside.”
It’s worth emphasizing that the message here is not “sell everything.” Rather, investors should carefully evaluate their risk tolerance, their investment horizon, their sensitivity to market losses, and their tolerance for regret (both the regret of missed market gains as a result of being defensive, and the regret of suffering market losses as a result of being constructive). In my view, investors should seriously consider the prospect of a market decline on the order of -65% from the recent market highs, and their capacity to tolerate that sort of loss without abandoning their investment discipline. Investors with limited investment horizons should also consider the likelihood, suggested by current valuation extremes, that total market returns over the coming 10-12 years may be negative even if they maintain their discipline through a steep interim market loss.
I’ll emphasize again that the worst market outcomes in history have typically unfolded when extreme overvalued, overbought, overbullish conditions have been joined by deteriorating market internals and upward pressure on credit spreads and risk-premiums. Conversely, the strongest market outcomes in history have typically unfolded when a substantial retreat in market valuations has been joined by early improvement in those measures of market action. If our measures of market internals improve, we will defer the immediacy of our downside concerns. Here and now, my impression is that complacency could prove to be a costly instinct.
Keep Me Informed
Please enter your email address to be notified of new content, including market commentary and special updates.
Thank you for your interest in the Hussman Funds.
100% Spam-free. No list sharing. No solicitations. Opt-out anytime with one click.
By submitting this form, you consent to receive news and commentary, at no cost, from Hussman Strategic Advisors, News & Commentary, Cincinnati OH, 45246. https://www.hussmanfunds.com. You can revoke your consent to receive emails at any time by clicking the unsubscribe link at the bottom of every email. Emails are serviced by Constant Contact.
The foregoing comments represent the general investment analysis and economic views of the Advisor, and are provided solely for the purpose of information, instruction and discourse.
Prospectuses for the Hussman Strategic Growth Fund, the Hussman Strategic Total Return Fund, the Hussman Strategic International Fund, and the Hussman Strategic Dividend Value Fund, as well as Fund reports and other information, are available by clicking “The Funds” menu button from any page of this website.
Estimates of prospective return and risk for equities, bonds, and other financial markets are forward-looking statements based the analysis and reasonable beliefs of Hussman Strategic Advisors. They are not a guarantee of future performance, and are not indicative of the prospective returns of any of the Hussman Funds. Actual returns may differ substantially from the estimates provided. Estimates of prospective long-term returns for the S&P 500 reflect our standard valuation methodology, focusing on the relationship between current market prices and earnings, dividends and other fundamentals, adjusted for variability over the economic cycle.