

Bubbles and Hot Potatoes


John P. Hussman, Ph.D.
President, Hussman Investment Trust
December 2018
Of all the delusions that have infected the minds of economists, central bankers, and the investing public in recent years, perhaps none is as short-sighted and pernicious as the idea that aggressively low interest rates are “good” for the economy and the financial markets.
There is, of course, a certain truth to that idea, roughly equivalent to proposing that snorting amphetamine-laced cocaine is “good” for one’s energy, or that walking into a bar and randomly choosing partners while wearing a blindfold is “good” for one’s love life. In each case, however, the validity of the claim comes from subverting the word “good” to mean nothing more than a short-lived burst of very bad choices.
Back in 2003, Alan Greenspan mixed the soap of what would become the housing bubble by holding interest rates to just 1%. Investors responded to the uncomfortably low yields on Treasury bills by looking for alternatives that offered a seemingly safe “pickup” in yield. They found that alternative in mortgage securities. Wall Street was more than happy to satisfy the demand for more “product,” as they called it, by creating more mortgage bonds. But see, creating a mortgage bond requires you to actually make a mortgage loan to someone, which is how we got zero-down, no-doc, interest-only loans. “No credit? No problem!” Well, no problem in the short-term. Over the next few years, that bubble of Fed-induced yield-seeking speculation would reach its peak, and then collapse, producing the worst financial crisis since the Great Depression.
In my 2003 piece outlining that developing bubble, I began, “T.S. Eliot once wrote ‘Only those who risk going too far can possibly find out how far one can go.’ It seems that the U.S. financial system is bound and determined to find out… the real question is this: why is anybody willing to hold this low interest rate paper if the borrowers issuing it are so vulnerable to default risk? That’s the secret. The borrowers don’t actually issue it directly. Instead, much of the worst credit risk in the U.S. financial system is actually swapped into instruments that end up being partially backed by the U.S. government. These are held by investors precisely because they piggyback on the good faith and credit of Uncle Sam.”
In the Federal Reserve’s attempt to bring the U.S. out of the crisis of its own making, the Fed has produced conditions that make another collapse inevitable. Unfortunately, the scale of the present bubble is far grander, and the consequences are likely to be more severe. By the completion of this cycle, I continue to expect the S&P 500 to lose roughly two-thirds of the market capitalization it reached at its September 20 peak. Mountains of covenant-lite debt and leveraged loans, this cycle’s version of “sub-prime” mortgages, will go into default. Worse, “covenant-lite” means that lenders have much less protection in the event of defaults, so recovery rates will plunge to levels that investors have never experienced.
After 8 years of Fed-induced yield-seeking speculation, financial valuations have been driven to the most offensive extremes in history, with the most reliable equity valuation measures recently matching or exceeding their 1929 and 2000 peaks. Accordingly, prospective long-term investment returns for stocks and bonds have been driven to strikingly low levels.
At the September peak, we estimated that a conventional portfolio mix invested 60% in the S&P 500, 30% in Treasury bonds, and 10% in Treasury bills was likely to produce total returns averaging just 0.48% annually over the coming 12-year horizon. The only time passive investors faced lower expected 12-year returns was during the 3 weeks immediately surrounding the 1929 market peak. After a recent increase in bond yields and a mild -10% decline in the S&P 500, that estimate increased to just 1.29%. With most pension funds assuming expected future returns on the order of 7% annually, the coming years are likely to include a rather severe pension funding crisis.
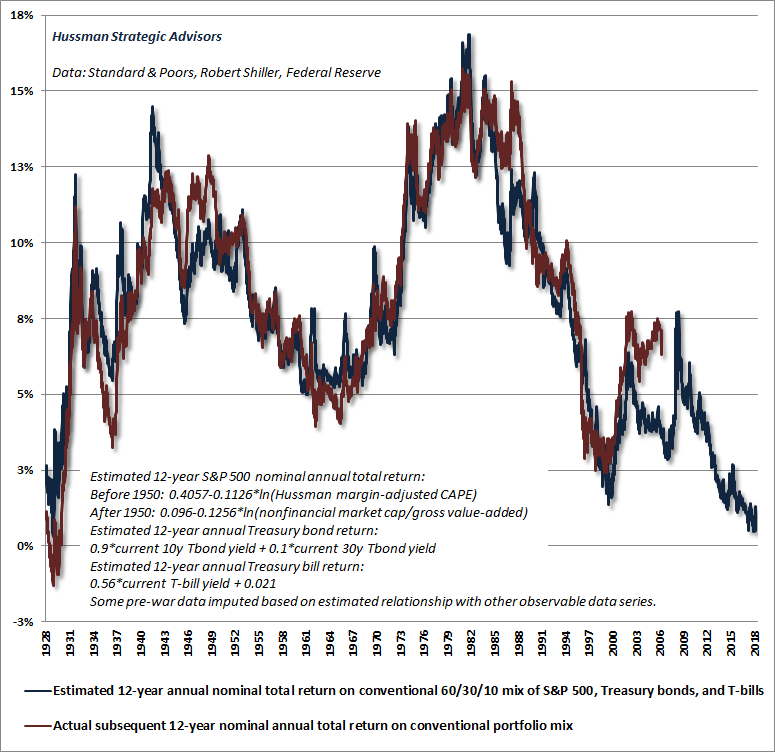
Notice that the completion of every market cycle has served to restore normal prospective market returns, which is routinely accomplished by sharp losses in security prices. Observe for example, the spikes in the blue line corresponding to the 2000-2002 and 2007-2009 market collapses. These spikes in expected returns are clearly a good thing for investors who can respond to the opportunity provided by improved valuations, but they are not at all a good thing for investors who were holding passive portfolios while those losses were occurring.
Clearly, total returns on a passive portfolio have been much better over the most recent 12-year period than one would have projected in 2006. The same was true for actual 12-year returns versus those that one would have projected in 1988. The reason, of course, was that those 12-year periods benefited from two of the steepest financial bubbles in history, culminating in the valuation extremes of 2018 and 2000. As I’ve demonstrated in prior comments, periodic errors between actual 12-year returns and those one would have projected 12-years earlier are tightly correlated with end-of-period consumer confidence, which is another way of saying that periodic cyclical extremes in valuation are both temporary and psychological.
At the September peak, we estimated that a conventional portfolio mix invested 60% in the S&P 500, 30% in Treasury bonds, and 10% in Treasury bills was likely to produce total returns averaging just 0.48% annually over the coming 12-year horizon. The only time passive investors faced lower expected 12-year returns was during the 3 weeks immediately surrounding the 1929 market peak.
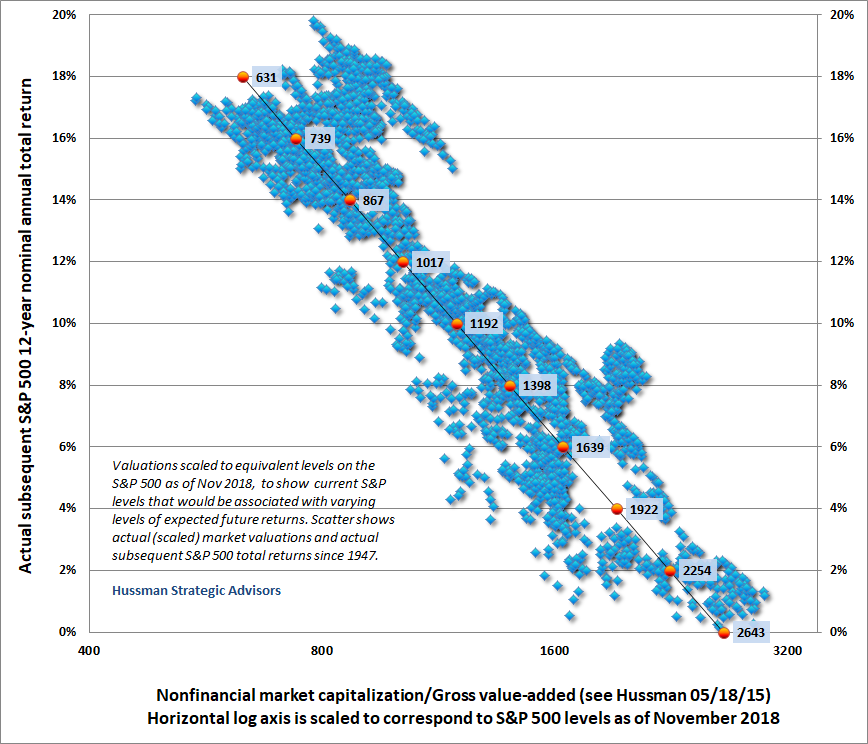
The chart below offers a sense of which levels on the S&P 500 would currently be associated with various 12-year expected returns. The scatter plot reflects data since 1947, where I’ve scaled the horizontal valuation axis to correspond to S&P 500 levels as of November 2018. Since corporate gross value-added grows over time (currently at a nominal rate of about 4% annually – more on that below), the S&P 500 levels associated with any given expected return will gradually increase over time at about that rate. Presently, to achieve a historically run-of-the-mill 10% expected return for the S&P 500, the index would have to drop to a level of about 1192, roughly -60% below its recent record high.
The arithmetic of these expected returns is currently rather unfortunate. S&P 500 revenues and gross value-added have grown at an average rate of only about 4% in recent decades. Unless profit margins push endlessly higher, earnings are likely to do the same, and may grow at an even lower rate in the coming years if profit margins revert even modestly toward their historical norms.
With the most reliable measures of market valuation still over 2.5 times their historical norms, there are essentially two ways to normalize valuations. One is for the market to lose about -60% of its value. The other is for fundamentals to grow while leaving stock prices unchanged. So the question is: how many years of growth would be required in order to normalize valuations? The answer is ln(2.5)/ln(1.04) = over 23 years. Though prices would be unchanged, you’d also get a dividend yield of about 2% while you wait.
In my view, there will likely be very large changes in economic conditions and market psychology long before then, so my sense is that a major price collapse like 2000-2002 and 2007-2009 is the most likely way this bubble will be resolved. Meanwhile, it’s worth noting that it would not even take a decline to historically run-of-the-mill valuations to wipe out every bit of S&P 500 total return that the index has enjoyed since 2000.
While successfully engineering inflation seems like a tempting way to avoid major market losses, it’s important to remember again that the best equity valuation measures remain over 2.5 times their historical norms. Though higher inflation isn’t required for valuations to normalize, it would almost certainly accelerate that normalization. That’s another way of saying that the CPI would have to far more than double before the positive effects of inflation on nominal growth would begin to overcome the negative effects of inflation on market valuations.
In the Federal Reserve’s attempt to bring the U.S. out of the crisis of its own making, the Fed has produced conditions that make another collapse inevitable. Unfortunately, the scale of the present bubble is far grander, and the consequences are likely to be more severe.
Put simply, the extraordinary and experimental policies of quantitative easing and zero interest rates have not been “good” except in the myopic sense of encouraging a short-term burst of very bad choices and misallocations of capital. While it’s unfortunately necessary to tolerate cartoonish rants on CNBC about a potential Fed “policy error” as it normalizes interest rates, the fact is that the policy error is way, way behind us, and the Fed already made it.
The financial markets have already experienced years of aggressive yield-seeking speculation, record valuation extremes, and eager issuance of new “product” – in the form of covenant lite debt and leveraged loans – to satisfy the need of investors to “earn something greater than zero.” Now all we have is an unfortunate situation. With the total capitalization of U.S. corporate equities recently pushing $40 trillion, I continue to expect that $20 trillion or more of what investors count as “wealth” will vanish over the completion of this cycle.
Bubbles and hot potatoes
Over the completion of this cycle, you’re going to hear a lot of misinformation about monetary policy, along with a great deal of misplaced blame. The initial blame will be directed at whatever immediately accompanies the downturn. If a market collapse happens to fall on the same day that an organ grinder’s monkey throws a coconut at the bronze bull on Wall Street, they’re going to blame the crash on the monkey.
Additional rounds of blame will be directed at whatever advances the agenda of the person talking. Republicans will blame Democrats. Democrats will blame Republicans. Dogs will blame cats. Cats will blame mice. Everyone on financial TV will blame Jay Powell at the Fed for the “policy mistake” of even trying to normalize interest rates. But the true object deserving of blame will be the thing that made a financial collapse inevitable in the first place: the yield-seeking carnival of speculation engineered by the Bernanke-Yellen Fed.
Let’s walk through some of the mechanics of how monetary policy actually works, and how recent policies encouraged a bubble and collapse that is now baked-in-the-cake. The discussion will help to clear up some misconceptions (like the insufferable phrase “cash on the sidelines”), as well as some widely-believed cause-and-effect relationships that have no basis in fact.
Right from the start, it’s important to understand that monetary policy (interest rates, bank reserves, Federal Reserve action) is not independent of fiscal policy (taxes, spending, deficits). Rather, fiscal policy determines the total amount of government liabilities held by the public, while monetary policy determines whether the public holds those liabilities in the form of bonds or money.
The process begins when the Federal government spends money beyond what it raises in taxes, it borrows the difference by issuing and selling a Treasury bond (or Treasury bill) to the public.
Once that Treasury security is purchased by the public, an additional thing can happen. The Federal Reserve can go out and buy that Treasury security from the public, and pay for it by creating “base” money. Base money has two forms: the currency that people carry around in their pockets (look at the top of a dollar bill, and you’ll see that the bill is a liability of the Federal Reserve), and bank reserves.
Notice what happens when the Fed buys a Treasury security and increases its “balance sheet.” A certain dollar amount of Treasury bonds is removed from the hands of the public, and a certain amount of monetary base is created in its place. The total amount of government liabilities in the hands of the public is exactly the same as it was before. All the Federal Reserve does is to change the mix of government liabilities held by the public between bonds and base money. When people say the Fed has increased or decreased its “balance sheet,” it means that the Fed has increased or decreased the amount of Treasury bonds it holds, and accordingly, the amount of monetary base the public holds.
So again, monetary and fiscal policy are not independent. Fiscal policy determines the total amount of government liabilities that the public has to hold, and monetary policy determines how much of those liabilities are held by the public in the form of base money rather than interest-bearing Treasury bonds.
What does all of this have to do with Treasury bill yields and Fed policy rates? Well, here’s the thing. Until 2009, base money earned no interest, and it was only in 2016 that the Fed began paying interest on excess reserves held by banks in more than a nominal amount. Here’s the other thing. Once base money is created by the Federal Reserve, someone has to hold it at every point in time until it’s retired. It’s impossible for the public to get “out” of base money, in aggregate. It can only change hands between holders. People can convert the form of base money from bank reserves to currency by pulling it out of the bank, but beyond that, the total amount of currency and reserves outstanding is singularly determined by the Fed.
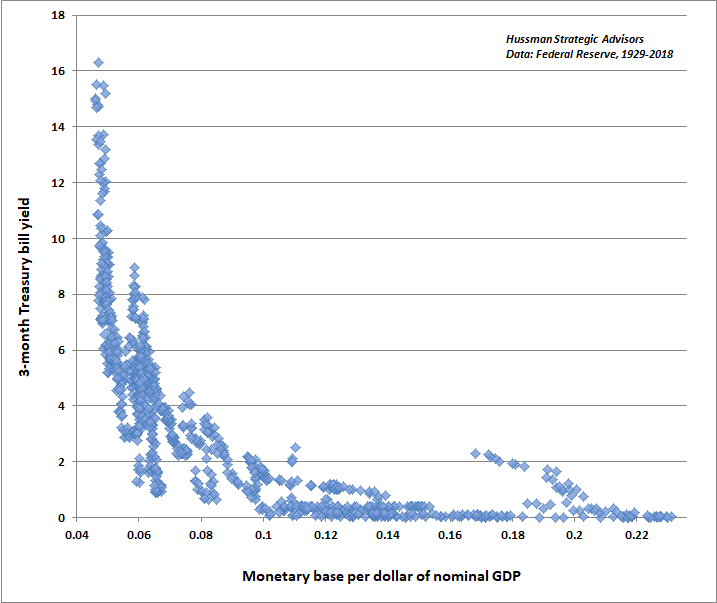
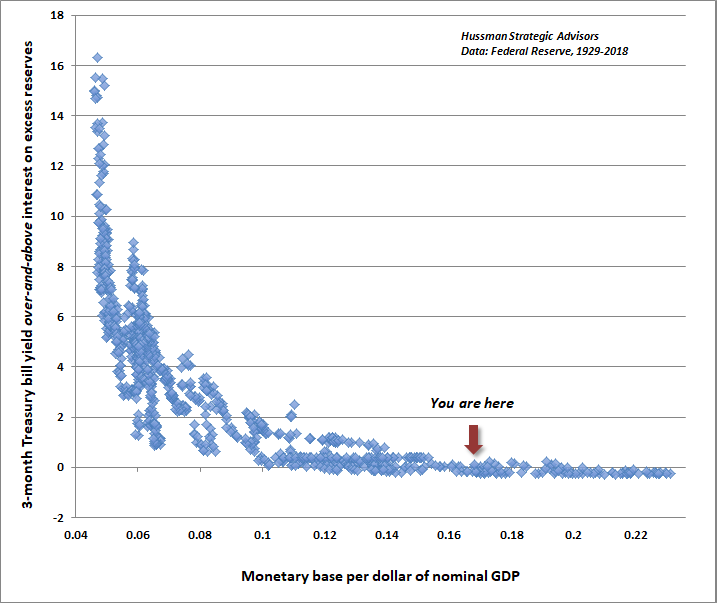
Zero-interest base money is the ultimate hot potato. The more base money the Fed creates, as a fraction of GDP, the more uncomfortable people become with earning nothing. So they look for other securities to hold, and the closest substitute they find is Treasury bills. As investors bid Treasury bill prices higher, their yields fall. The process stops when investors are indifferent between holding zero-interest base money and low-yielding Treasury bills. The chart below shows this relationship, which is our version of Keynes’ “liquidity preference curve.”
Lifting off from zero
Notice the little scatter of points that has creeped above the curve in recent years. Those points are there because in 2016, the Fed began paying interest on excess reserves held by banks. It also created a “reverse repo” facility to pay interest on cash balances held by money market funds and the like.
Paying interest on reserves was no small change. Look at the liquidity preference curve, and it will become clear what’s actually going on. By paying interest on excess reserves, the Federal Reserve effectively converted those reserves to interest-bearing securities, and reduced the extent to which they behave as “hot potatoes.” In fact, at the current Treasury bill yield of about 2.3%, the economy doesn’t behave like the Fed is holding a $3.5 trillion balance sheet. It actually behaves as if the Fed has already cut its balance sheet to $2 trillion (or about 9% of GDP).
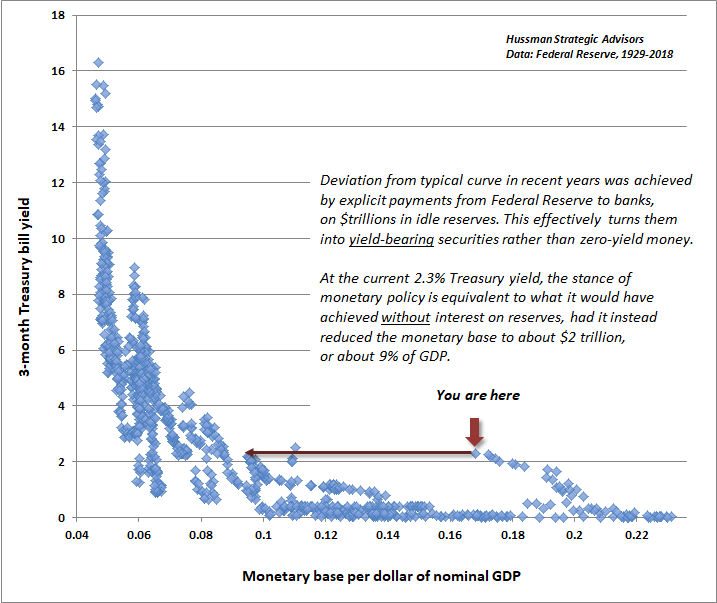
So is the Fed creating huge economic risks by allowing $50 billion in assets to run off its balance sheet every month? The answer is no. The excess reserves that banks hold today already earn over 2% interest. If they hold Treasury bills instead, what do they care? Their behavior won’t change – unless a bank is running its book right at the edge of Basel III liquidity coverage rules, in which case it should change its behavior anyway. Put simply, at the present level of interest on excess reserves (IOER), the Fed has already effectively cut its balance sheet to about $2 trillion.
To see what’s going on, the following chart is just like the previous liquidity preference curve, except that I’ve changed the axis from the Treasury bill rate to the Treasury bill rate in excess of IOER. Notice that it’s a lovely, well-behaved chart again. That should tell you something: as the Fed reduces its balance sheet, there will gradually come a point when the Treasury bill yield rises above the level of interest that the Fed is paying on excess reserves. For example, if the Fed gets its balance sheet down to about 12% of GDP (roughly $2.5 trillion, compared to the current level of $3.5 trillion), we can estimate that the Treasury bill will rise about 1% above IOER.
Notice that we’re still on the “flat” of the liquidity preference curve, where changing the amount of reserves directly doesn’t have much effect on interest rates. In my view, a smaller balance sheet would give the Fed richer options to effect monetary policy. It could directly change IOER and leave the monetary base unchanged (which would raise or lower other short-term market rates by a roughly corresponding amount), or it could leave IOER alone and move the monetary base around.
Though all of this is my own version of the liquidity preference curve, I do hope the Fed has similarly quantified these relationships, because some of the statements made during the QE period made me doubt that Bernanke and company had any idea of how to quantify the impact of the balance sheet changes they were making.
By paying interest on excess reserves, the Federal Reserve effectively converted those reserves to interest-bearing securities, and reduced the extent to which they behave as ‘hot potatoes.’ In fact, at the current Treasury bill yield of about 2.3%, the economy doesn’t behave like the Fed is holding a $3.5 trillion balance sheet. It actually behaves as if the Fed has already cut its balance sheet to $2 trillion.
Quantitative easing wasn’t about creating more “liquidity,” or encouraging more bank loans, or any of the other excuses tossed around for it. What quantitative easing really did was to replace interest-bearing Treasury bonds held by the public with a mountain of zero-interest money that was so uncomfortable to hold that it drove investors absolutely crazy. But they couldn’t get out of it in aggregate. Whoever held it could only toss their hot potato to someone else by trading it for some other security, regardless of the price. Every time someone used their zero interest money to buy stocks, they got the stock, and the sellers of the stock got the zero-interest money. So the cycle continued, until every asset – stocks, bonds, everything – was priced to deliver long-term returns remarkably close to zero. And here we are.
I used to believe that there was a limit to that kind of speculation. I was wrong. But understand exactly what was “different.” The fact is that valuations have “worked” in the recent cycle as they always have – we’ve always known that their most reliable implications are long-term and full-cycle. Market internals (which we use to gauge when investors are inclined toward speculation or risk-aversion) have also “worked.” In fact, the entire net market gain since 2007 has occurred in periods where internals have been favorable, while the bulk of the 2007-2009 collapse, as well as recent corrections, have occurred when they were not.
The problem in recent years was that, unlike every other market cycle in history, previously reliable warning flags of overextended speculation proved useless. In prior market cycles, once an extreme syndrome of “overvalued, overbought, overbullish” conditions emerged, the market regularly ran into air-pockets, panics, crashes. Speculation always had a limit, and one could adopt a bearish stance even before market internals deteriorated.
Not this time. Once interest rates hit zero, so did the collective IQ of Wall Street. Even responding to the most overextended warning flags was detrimental. A year ago, I resolved that while sufficiently extreme conditions can put us in a neutral stance, we would no longer adopt a bearish outlook unless market internals had deteriorated explicitly – no exceptions. That’s why I’ve looked “smarter” since then. I became content to identify the presence or absence of speculative pressures, and completely abandoned the belief that reckless speculation has “limits.”
Quantitative easing wasn’t about creating more ‘liquidity,’ or encouraging more bank loans, or any of the other excuses tossed around for it. What quantitative easing really did was to replace interest-bearing Treasury bonds held by the public with a mountain of zero-interest money that was so uncomfortable to hold that it drove investors absolutely crazy. But they couldn’t get out of it in aggregate. Whoever held it could only toss their hot potato to someone else by trading it for some other security, regardless of the price.
When easy money works, and when it doesn’t
The completion of this cycle will be challenging for conventional wisdom. One of the dangers of the recent speculative episode is that investors have come to believe that Fed policy and easy money always supports the financial markets. They forget that the Fed eased persistently and aggressively throughout the 2000-2002 and 2007-2009 collapses, both which cut the stock market in half.
The fact is that while yield-seeking speculation is a powerful force, it only operates when investors are actually inclined to speculate. See, creating a mountain of zero-interest money works only if safe, low-interest liquidity is viewed by investors as an inferior holding compared to riskier securities like stocks and long-term bonds. If investors are instead inclined toward risk-aversion, safe, low-interest liquidity is a desirable asset, not an inferior one, so creating more of the stuff does nothing to encourage speculation.
My old friend Richard Russell once said that every bear market has a “hook” – something that investors believe, but isn’t true, and encourages them to keep holding and hoping all the way down. Believing that Fed easing creates a “put option” under the market is one of those hooks. It absolutely failed during the last two market collapses, and is likely to fail again in the next one.
So we have to make a distinction. If the Fed launches a fresh policy of extraordinary easing in the next downturn, the appropriate response will depend on whether market internals indicate that investors are inclined toward speculation, or whether they are inclined toward risk aversion. The central consideration here is what I call “uniformity” – when investors are inclined to speculate, they tend to be indiscriminate about it. It’s difficult to get extended market advances without recruiting that kind of uniformity, but it will be important to avoid being sucked into the market in response to Fed easing alone. Historically, initial Fed rate cuts in response to a market downturn have been followed by very negative consequences (after the initial obligatory market pop), because they generally indicate that something has gone wrong.
While yield-seeking speculation is a powerful force, it only operates when investors are actually inclined to speculate.
The chart below offers a sense of this distinction. Here, I’ve defined “easing” as periods where the most recent move in the Federal Funds rate or the Discount Rate was downward, or where Treasury bill yields decline by at least 0.50% from their high of the previous 6-month period. The opposite criteria are used for tightening. This classifies about 63% of periods as easing, and 37% as tightening. The monetary policy stance is then partitioned based whether the condition of market internals (our proxy for whether investors are inclined toward speculation or risk-aversion) was favorable or unfavorable.
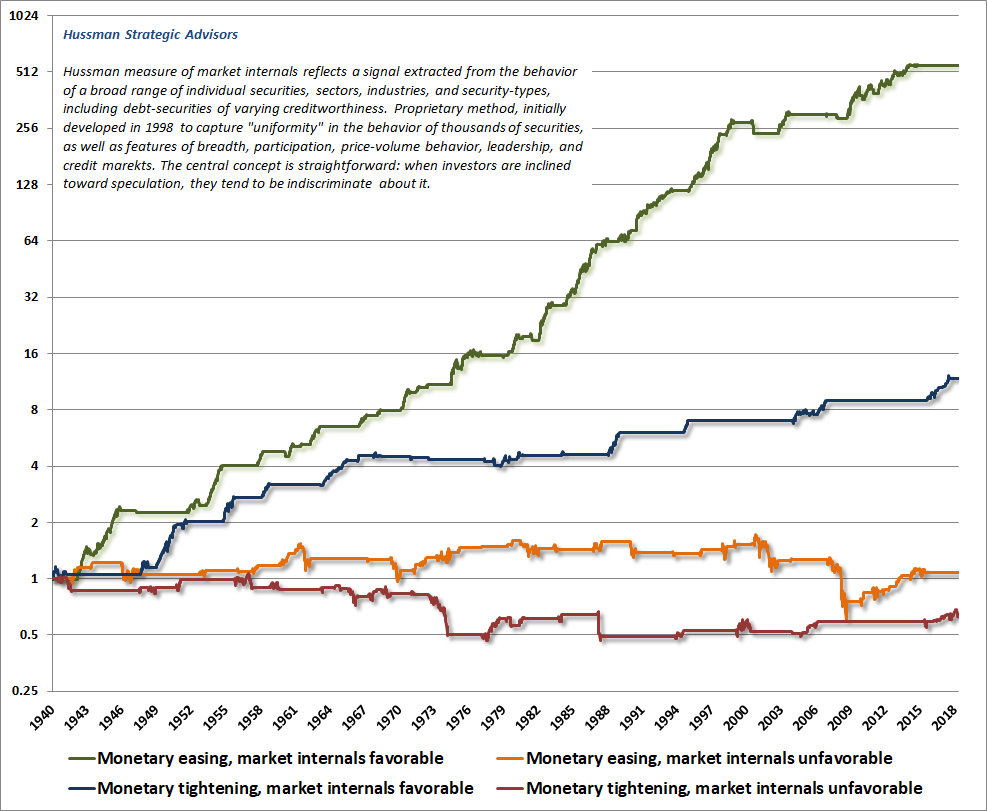
Note that easy money is most powerful in periods where investors are already inclined toward speculation. What’s equally important is that tight money also tends to be bullish, provided that market internals are still favorable. Indeed, that’s a condition that often accompanies mid-to-late stage bull markets. In contrast, Fed easing is of little use when investors are inclined toward risk aversion. The average market return is actually about zero, and there is a substantial risk of steep market losses, which included the collapses of 2000-2002 and 2007-2009. Remember that. Finally, the worst situation is actually what we have at present – tightening monetary policy in an environment where market internals indicate growing risk-aversion among investors.
Importantly, we should not rule out the likelihood of periodic “fast, furious, prone-to-failure” rebounds from oversold conditions, even in an environment like we have today. Negative market conditions do not automatically resolve into the likelihood that every week or month will be down. Rather, they resolve into the likelihood that average returns will be poor and interim drawdowns will be steep. That’s a poor tradeoff, in my view.
Cash on the sidelines is always cash on the sidelines
The above discussion should clarify another feature of the financial markets. Once a security is issued, it has to be held by someone. That includes every dollar of monetary base, every money market security, every share of stock, and every bond. There isn’t any such thing as “money moving out of stocks and into bonds” or “money moving off the sidelines and into stocks.” That’s not how secondary markets work.
If there’s an ocean of “cash on the sidelines” it’s because lots of issuers have chosen to borrow money in the form of short-term securities, or the Fed has chosen to create a lot of base money. Those securities, and that base money, have to be held by someone at every moment in time, and will remain in the form they were issued in, until they are retired. They do not and will not “go” anywhere else. So when you hear someone talking about all the “cash on the sidelines” that’s “ready to go into the market,” the first thing you can conclude is that the speaker has not thought carefully about the subject.
Once base money is created by the Federal Reserve, someone has to hold it at every point in time until it’s retired. It’s impossible for the public to get ‘out’ of base money, in aggregate. It can only change hands between holders. Zero-interest base money is the ultimate hot potato.
As we’ve seen above, there’s no question that zero-interest base money can act as a hot potato that provokes each successive holder to try to get rid of it by speculating in something else. But in the end, all those hot potatoes have to be held by someone. There’s no getting out of them, in aggregate, until they’re retired by the Fed. Though we’ve still got $3.5 trillion of base money outstanding, what the Fed has done right, at least, is that it has turned it into interest-bearing base money, which effectively reduces its damaging impact, and the inclination of investors to resort to the worst forms of speculation.
As I’ve observed for decades:
If Mickey sells his money market fund to buy stocks, the securities in that money market fund have to be sold to Nicky, whose cash goes to Mickey, who uses that cash to buy stock from Ricky. In the end, Nicky holds the money market securities that Mickey used to hold, Mickey holds the stock that Ricky used to hold, and Ricky holds the cash that Nicky used to hold. In the end, there is just as much ‘cash on the sidelines’ as there was before. Money never goes into or out of the market, merely through it.
Hey! I made you a pizza
What about stock repurchases? In the simplest case, a company takes a portion of its earnings, and uses the cash to buy its shares on the open market. The seller gets the cash, and the purchased shares are canceled. So each remaining share has a larger claim to future cash flows, increasing by a factor of C/(C-R), where C is the pre-repurchase market capitalization, and R is the dollar value of repurchases.
What’s fascinating, though, is how rarely this simple case is actually what happens. More often, companies repurchase their shares to offset dilution that would otherwise result from stock and options grants to corporate insiders, which is like a friend saying “Hey! I made you a pizza,” and then eating it right in front of you. Stock repurchases are also frequently financed by issuing debt, which may seem like a good trade given the recent level of interest rates, but only if one ignores the likelihood that the S&P 500 will produce negative total returns over the coming 10-12 years, as well as the fact that stock repurchases tend to cluster at market highs rather than lows.
Another fascinating aspect of stock repurchases is how eager investors are to overestimate their impact. See, while stock repurchases do reduce the float of U.S. corporations, other factors have the opposite effect, such as secondary offerings, and equity compensation through stock and option grants. With the total market capitalization of the S&P 500 alone pushing a record $25 trillion at the September high, it’s clear that repurchases haven’t created any scarcity of market capitalization.
One way to gauge the overall net impact of repurchases and new issuance is to examine the S&P 500 divisor, which accounts for changes in outstanding shares (note that stock splits do nothing to the divisor of a cap-weighted index like the S&P 500 because market capitalization is not changed by a split). If repurchases were driving a massive contraction in equities available to the public, we would observe it as a steep and persistent decline in the S&P 500 divisor. Instead, we observe this:
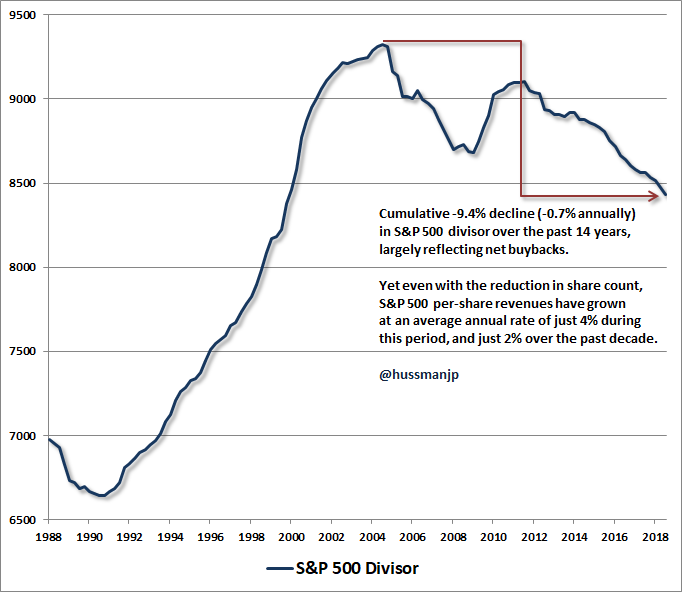
Over the past 14 years, there has been a cumulative decline of -9.4% in the S&P 500 divisor, which works out to an average decline of about -0.7% annually. As a result, per-share earnings and revenues of S&P 500 companies have grown about 0.7% faster each year than they would have in the absence of net buybacks. Yet even with all of these buybacks, per-share revenues for the S&P 500 have grown at just 4% annually over this 14-year period, and just 2% annually over the past decade.
Put simply, whatever investors think buybacks are doing for the market, the fact is that the net combined effect of issuance and buybacks amounts to less than 1% of market capitalization annually. Tossing around huge buyback numbers seems impressive until one realizes that there is close to $25 trillion of S&P 500 market capitalization, and $40 trillion of total U.S. equity capitalization outstanding, and a large portion of buybacks simply offset dilution that would otherwise result from compensation-based stock issuance.
For us, what matters most is the combination of valuations and market internals. If market internals are uniformly favorable, indicating that investors are inclined to speculate, then any source of equity demand is likely to fan those flames, particularly when valuations are also reasonable. But if market internals are ragged and divergent, indicating that investors are inclined toward risk-aversion, don’t imagine that the Federal Reserve, or equity buybacks, or some other white knight will arrive to prevent severe market losses in a financial crisis. The sheer volume of sell orders trying to exit will overwhelm whatever thimble full of market capitalization buyers are willing to accumulate.
On growth, interest rates, and gold
One of the relationships I’ve emphasized over the past few years is that economic growth is driven by “structural” and “cyclical” factors. Structural economic growth is equal to growth in productivity plus growth in the labor force. Cyclical economic growth is driven by fluctuations in the unemployment rate.
Algebraically: Output = Output/Employed Worker x Employed Workers/Total Workers x Total Workers
This is an identity, so there is no other component. As a result, we can form a strong expectation of likely future growth by examining each component of economic growth.
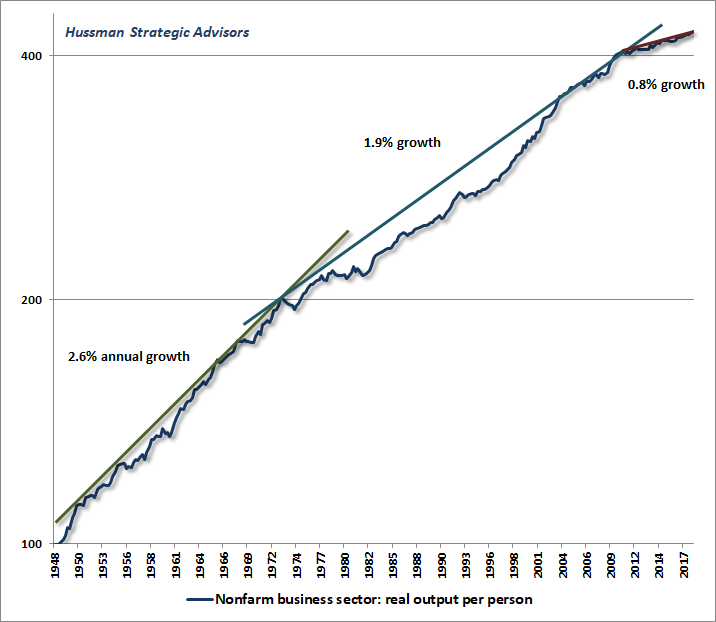
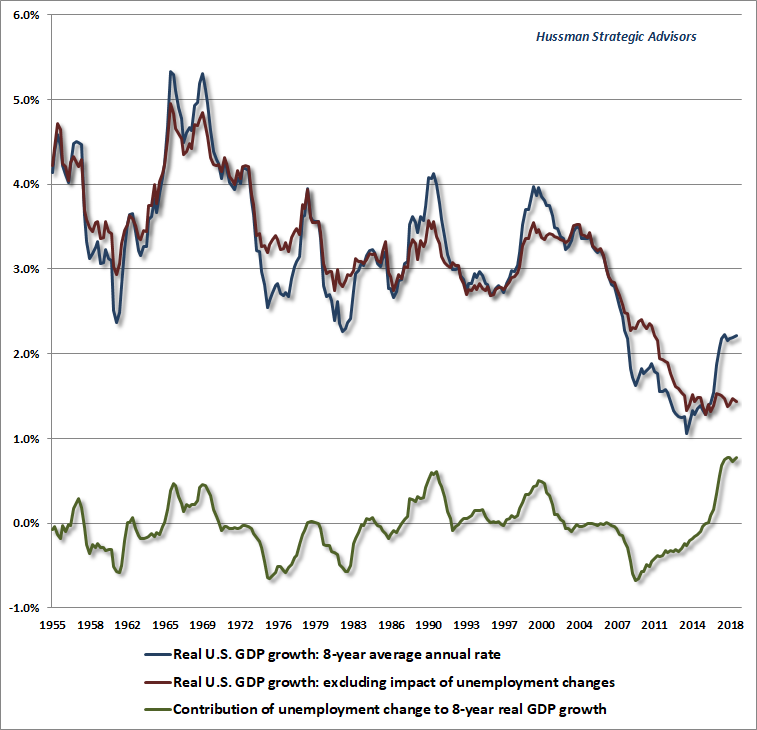
On the productivity front, the fact is that U.S. labor productivity has gradually slowed over time, from 2.6% annually following World War II, to 1.9% growth since the 1970s, to just 0.8% annual growth over the past decade.
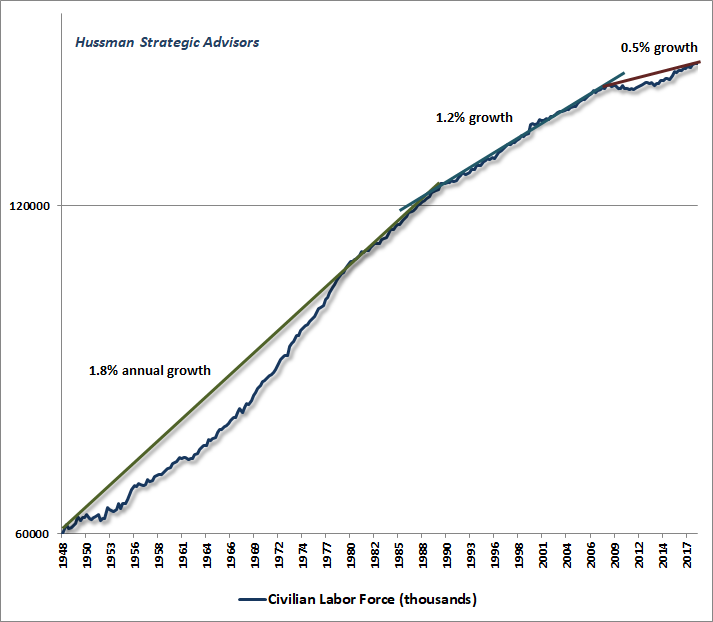
Similarly, labor force growth is largely driven by long-term demographics like population growth and their age profile. U.S. labor force growth has gradually slowed from 1.8% annually during the post-World War II baby boom, to 1.2% annual growth since the 1980’s, and just 0.5% annual growth over the past decade.
So holding the unemployment rate at a constant level, the structural growth rate of the real U.S. economy is currently running at just 0.8% + 0.5% = 1.3% annually. Even if we were to observe an investment boom as a result of recent tax policies (which we have not), and productivity growth was to fully restore the 1.9% annual growth rate it enjoyed since the 1970’s, the existing structure of the U.S. population would make it very difficult to push structural growth beyond about 2.5% annually.
That leaves cyclical growth as the only remaining component. Yet with the U.S. unemployment rate already down to 3.7%, the likelihood of substantial further declines is limited. Even pushing the unemployment rate down to 1% over the coming 4 year period would add just 0.7% annually to economic growth.
The chart below shows how these components have affected U.S. real GDP growth over the most recent 8 year period. I’ve used 8 years so that the most recent numbers reflect only the recent recovery, with no impact from the global financial crisis. The blue line shows actual 8-year U.S. real GDP growth. The red line shows structural growth, currently hovering at just 1.3% annually. What should be evident from the chart is how much of what we are currently calling “prosperity” has been cyclical rather than structural, reflecting a persistent decline in the unemployment rate from fully 10% in 2009, to 4.6% by November 2016, with a slight additional push down to 3.7% today.
At present, we’ve got a 1.3% structural growth rate with very limited prospects of additional cyclical benefit. We can’t rule out a short-lived burst of productivity resulting from changes in taxes and regulation, and it’s possible that the unemployment rate could move slightly lower still. Yet even in an optimistic scenario, the idea of 3-4% sustained real GDP growth “as far as the eye can see” is bonkers.
On the interest rate front, if one examines the relatively low-inflation period since the 1980’s, we’ve typically observed 10-year Treasury bond yields about 2% to 2.5% above the rate of real GDP growth, and roughly equal to nominal GDP growth. Treasury bill yields have typically stood 0.5% to 1% above real GDP growth, but slightly below nominal GDP growth. Even if one assumes that real GDP growth will push toward 2% annually, those figures suggest that a neutral Treasury bill yield would reasonably fall in the area of 2.5-3.0%.
As for bonds, if the current economic expansion was not so long in the tooth, I’d suggest that a “neutral” 10-year bond yield would be somewhere about 4.0-4.5%. Given our position in the economic cycle, one would expect a rather flat yield curve, and on that front, the current 10-year Treasury yield of 3.1% already seems about right. Even the current level of yield allows room for retreat in the event of economic weakness, but I’m inclined toward a fairly moderate duration, picking up additional exposure and duration in the event we observe periods of price weakness or spikes in yield.
Even in an optimistic scenario, the idea of 3-4% sustained real GDP growth ‘as far as the eye can see’ is bonkers.
So while I do think that it’s reasonable for the Fed to hike another time or two, it’s not at all clear that more aggressive moves are required. Even without much in the way of additional rate hikes, my preference would be to normalize the balance sheet further in any event. A smaller balance sheet would also allow the Fed to achieve its interest rate targets, without the need to explicitly pay interest to banks on their excess reserves.
On the precious metals front, we’ve already got a rather flat yield curve, a very high ratio between spot gold and the XAU, suggesting that gold stock prices are already relatively depressed, and an easing of the upward pressure we saw on Treasury yields earlier this year. My impression is that gold stocks are in a reasonable range here from a valuation standpoint, and that we’re likely to observe rather rapid appreciation at the point we observe clear economic softening (say, a purchasing managers index near 50 or below, coupled with a retreat in Treasury bond yields). For now, there’s enough volatility and risk that I’m inclined toward a constructive rather than aggressive outlook, which means moderate but not exuberant exposure to that market.
On inflation
You may note that none of our views on bonds or precious metals rely on strong expectations about inflation. The fact is that if you actually go to the data and run an enormous amount of analysis, you’ll find that virtually nothing that people say or believe about inflation is actually true. I’ve regularly argued elsewhere that the “Phillips Curve” is actually properly viewed as a relationship between unemployment and real wage inflation, but it bears repeating that there is no meaningful relationship between general price inflation and unemployment, nor will you find a strong, reliable relationship between inflation and government debt, the outstanding quantity of base money, the output gap, or virtually anything else.
The simple fact is that the best predictor of future inflation is current inflation. In my view, that’s because money is valued not based on year-to-year fundamentals, but based on psychology and long-term expectations. Inflation essentially reflects a loss of public confidence in the long-term ability of the government to restrain its issuance of liabilities. Now, I don’t believe that the Federal debt actually ever has to be “repaid” – both government securities and base money provide a stream of useful “services” that facilitate transactions and storage of wealth, so in a limited quantity, proportional and not exploding relative to real GDP, these liabilities can grow indefinitely as the economy grows, without substantial inflationary consequences.
The problem comes when the growth in government liabilities outpaces the supply of goods and services enough to cause a material loss of faith, and a break in public psychology. That’s not captured by linear relationships. It occurs in discrete shifts. As Thomas Sargent, a Nobel economist (and my former dissertation advisor) once wrote:
“People expect high rates of inflation in the future precisely because the government’s current and future monetary and fiscal policies warrant those expectations… it is actually the long-term government policy of persistently running large deficits and creating money at high rates which imparts the momentum to the inflation rate.”
Likewise, Sargent argues that stopping an inflation, once underway, requires “a change in the policy regime: there must be an abrupt change in continuing government policy, or strategy, for setting deficits now and in the future that is sufficiently binding as to be widely believed.”
The massive inflation of the late-1960’s and 1970’s involved discrete changes in public perception, beginning with Johnson’s Great Society programs, and wholly unleashed after Nixon ended the convertibility of dollars into gold in 1972. That inflationary episode also ended because of a change in public perception. Volcker broke inflation by shifting the monetary policy regime and sending a credible signal that government debt would not be financed through money creation. Neither money creation nor government deficits actually stopped (nor did they after the German, Austrian, Hungarian, or Polish hyperinflations). What changed was public perception about the long-term policy regime.
Inflation essentially reflects a loss of public confidence in the long-term ability of the government to restrain its issuance of liabilities. That’s not captured by linear relationships. It occurs in discrete shifts.
So is the possibility of inflation a concern? Absolutely, particularly given increasingly profligate fiscal policies, coupled with deranged monetary policies that enable explosive deficits. In my view, the whole “modern monetary theory” faith in the endless capacity of governments to print money, without consequence, is an artifact of a long disinflationary period. To date, the public has retained its faith in price stability much in the same way that speculators in a market bubble retain their faith in permanently rising prices.
At some point, that faith may break, but as with the financial markets, the best measures of that change in psychology will be a shift in market behavior across a wide range of inflation-sensitive securities. Since we are not passive investors, and have the capacity to shift our investment stance as the evidence shifts, we have no particular need to predict when that sort of shift will occur. It’s enough for us to align ourselves with the evidence we observe at each point in time.
Current view
Overall, market conditions for bonds and precious metals shares appear reasonable even here, though I’m inclined toward a moderate stance, using price weakness to nibble at additional exposure until we observe signs of emerging economic weakness.
In stocks, I continue to believe that the market is positioned for rather violent losses over the completion of this cycle, though undoubtedly punctuated by periodic rebounds that are fast, furious, and prone-to failure. These tend to emerge in the form of what I call “clearing rallies,” which relieve short-term oversold conditions. They should be used to make any needed portfolio adjustments. While I don’t herald every tactical response to those conditions, the important consideration at present is to maintain a safety net in any event, because when those rebounds fail, they can fail spectacularly. This comment from December 4, 2007 offers a good sense of how I view these periodic recoveries.
“Last week, the stock market enjoyed a typical clearing rally from an oversold low – ‘fast, furious, and prone to failure.’ This presents a good opportunity for investors to reduce positions that they would not be able to tolerate through a complete market cycle, with the S&P 500 only about 5% below a record high.
“Let me preface this analysis by stressing again that my intention is not to drive investors out of well-considered investment plans. There is nothing wrong with a buy-and-hold approach provided investors are aware of how strong the impulse is to abandon that strategy only after deep declines. I appeared briefly on CNBC last week to discuss recession risk, but beforehand, I was asked to put a positive tone on my comments, to which I responded – ‘Look, my interest is in making sure that investors have positions that they are able to hold through the complete cycle… If they’re carrying more risk than they could endure through the course of a bear market, they should cut back now. I’m not going to wave my arms around about doom and gloom, but I think it’s a crucial time for investors to think about the risk they’re taking, and if you don’t want me to say that, please don’t have me on.’ Well, I went on, and though we ran short of time, that’s still my message.”
Keep Me Informed
Please enter your email address to be notified of new content, including market commentary and special updates.
Thank you for your interest in the Hussman Funds.
100% Spam-free. No list sharing. No solicitations. Opt-out anytime with one click.
By submitting this form, you consent to receive news and commentary, at no cost, from Hussman Strategic Advisors, News & Commentary, Cincinnati OH, 45246. https://www.hussmanfunds.com. You can revoke your consent to receive emails at any time by clicking the unsubscribe link at the bottom of every email. Emails are serviced by Constant Contact.
The foregoing comments represent the general investment analysis and economic views of the Advisor, and are provided solely for the purpose of information, instruction and discourse.
Prospectuses for the Hussman Strategic Growth Fund, the Hussman Strategic Total Return Fund, the Hussman Strategic International Fund, and the Hussman Strategic Dividend Value Fund, as well as Fund reports and other information, are available by clicking “The Funds” menu button from any page of this website.
Estimates of prospective return and risk for equities, bonds, and other financial markets are forward-looking statements based the analysis and reasonable beliefs of Hussman Strategic Advisors. They are not a guarantee of future performance, and are not indicative of the prospective returns of any of the Hussman Funds. Actual returns may differ substantially from the estimates provided. Estimates of prospective long-term returns for the S&P 500 reflect our standard valuation methodology, focusing on the relationship between current market prices and earnings, dividends and other fundamentals, adjusted for variability over the economic cycle.