

Ground Rules of Existence


John P. Hussman, Ph.D.
President, Hussman Investment Trust
March 2019
There are those who are persuaded that some new price-enhancing circumstance is in control, and they expect the market to stay up and go up, perhaps indefinitely. Then there are those, superficially more astute and generally fewer in number, who perceive or believe themselves to perceive the speculative mood of the moment. They are in to ride the upward wave; their particular genius, they are convinced, will allow them to get out before the speculation runs its course. They will get the maximum reward from the increase as it continues; they will be out before the eventual fall. For built into this situation is the eventual and inevitable fall. Built in also is the circumstance that it cannot come gently or gradually. When it comes, it bears the grim face of disaster. That is because both of the groups of participants in the speculative situation are programmed for sudden efforts at escape.
– John Kenneth Galbraith
A Short History of Financial Euphoria, 1990
Over the years, I’ve often quoted Galbraith’s remark about the “extreme brevity of the financial memory.” During every speculative episode, investors come to believe that past experience is “the primitive refuge of those who do not have the insight to appreciate the incredible wonders of the present,” that investors and policy makers are more enlightened, and that some newly discovered innovation (even as crude as the sheer willingness to print money) can permanently avoid the disappointments of the past.
December’s steep selloff was a rather small reminder that when doubt emerges, it emerges quickly. One has to remember that the current market capitalization of U.S. corporate equities now stands at $40 trillion, twice the level of U.S. Gross Domestic Product – the highest multiple in history (the multiple peaked at 1.9 in 2000). Investors are vastly overestimating the effectiveness of monetary policy if they believe that the Federal Reserve buying a few trillion in Treasury bonds can reliably stop “sudden efforts at escape” among investors holding $40 trillion in securities that the Fed cannot buy, and that even the U.S. government could not buy without a vote by Congress to effectively nationalize U.S. corporations.
What the Fed did through its policy of quantitative easing was simply to encourage yield-seeking. It purchased interest-bearing government securities, and paid for them by creating $4 trillion in zero-interest bank reserves, which someone had to hold at every point in time. The effort by each successive holder to get rid of that zero-interest money created a game of “hot potato,” by which other securities were bid up until their long-term expected returns were also driven toward zero. And here we are.
In 2009, once the S&P 500 had collapsed by over -55% and investors shifted toward a speculative mindset, quantitative easing and zero interest rates became a highly effective tool to encourage speculation. The speculation continued well beyond the point that rich valuations were restored. Given an expanding economy and a sufficiently speculative mindset, extreme syndromes of “overvalued, overbought, overbullish” conditions did nothing to limit continued speculation, as they had in prior cycles across history. By necessity, we had to abandon the belief that reckless speculation had “limits,” and we became content to use market internals to identify the presence or absence of speculative pressures, using valuations to gauge prospects for long-term market returns and full-cycle risks.
Recall, however, that the Fed cut rates aggressively and persistently to no effect throughout the 2000-2002 and 2007-2009 market collapses. When investors are inclined toward risk-aversion, safe liquidity is viewed as a desirable asset, not an inferior one. So creating more of the stuff doesn’t reliably provoke speculation. This is a fact that investors are likely to relearn the hard way during the next financial collapse.
What’s striking about the bounce from December’s lows is how eager Wall Street is to dismiss it in hindsight as “overdone,” “reckless,” and “stupid.” Some blame the decline on nefarious “algorithms,” while others credit the subsequent bounce to some behind-the-scenes “plunge protection team.”
Look. The next couple of years are likely to include several breathtaking waterfall declines, and several more “fast, furious, prone-to-failure” clearing rallies. Investors who study market history will find the progression familiar. Investors who instead dismiss the fact that extreme valuations have always been followed by collapse to run-of-the-mill valuation norms (which would currently require a roughly -60% loss in the S&P 500) are in for a difficult history lesson.
Borderline internals
Short-term expectations require more flexibility. Presently, our near-term market outlook is fairly neutral, despite obscene valuations. As overvalued, overbought, and overbullish as the bounce from the December lows has become, our measures of market internals are now close to a threshold that could encourage speculators to take the bit in their teeth again, at least briefly – particularly if the S&P 500 breaks materially above widely observed “resistance” around the 2800 level. At the same time, our measures of economic prospects are clearly deteriorating, though not yet on an explicit recession warning. Words like “threshold,” “agnostic,” “borderline,” and “non-committal” basically sum up our short-term view.
For now, a fairly neutral short-term outlook adequately balances extremely negative cyclical conditions with shorter-term Fed-focused exuberance. We’ve learned never to fight speculation unless internals are clearly negative. You can wave your arms around about valuations and full-cycle risks, you can point out how and why other bubbles collapsed, you can trot out a century of historical data, but if we’ve learned one thing about Wall Street, it’s that, As Ron White says, “you can’t fix stupid.” You’ll only injure yourself trying.
Still, given that market internals remain borderline, with obscene valuations, deterioration in our leading economic measures, a clear and widely overlooked spike in inflationary expectations reflected in inflation-protected securities and commodities, still-muted participation in the broad market, and other factors, we aren’t inclined toward a constructive outlook either.
We do believe that internals are effective in measuring what Galbraith described as “the speculative mood of the moment,” but at the current threshold, neutral is enough. Regardless of whether stocks retest their September peak, at present valuations, the primary risk remains a protracted market collapse.
Words like ‘threshold,’ ‘agnostic,’ ‘borderline,’ and ‘non-committal’ basically sum up our short-term view.
I continue to believe that September 20, 2018 marked the most likely peak of the recent bull market, and that the recent advance most likely represents an aging bear market rally, with steep full-cycle market losses being inevitable. It’s also important to observe the similarity of the recent advance to the short-lived clearing rallies of early-2001 and early-2008, both which restored borderline market internals before failing.
My general impression is that the market is enjoying an overbought, overbullish rebound that appears likely to be seen in hindsight as a bear market rally. Still, no forecasts are necessary. We are content to align ourselves with the evidence that we observe at any point in time. As Howard Marks says of investors who try to parse market fluctuations too finely, “I describe such an effort as ‘trying to be cute’… when there’s nothing clever to do, the mistake lies in trying to be clever.”
Despite a fairly neutral near-term view, my full-cycle outlook remains very pointed. This is an obscenely overvalued market. Looking over the completion of this market cycle (perhaps 18-30 months), I continue to expect a loss in the S&P 500 approaching roughly -60%, with a negative total return for the S&P 500 over the coming 12-year horizon. It’s exactly because those projections seem preposterous, and exactly because our expectations for similar losses in 2000 and 2007 were reliably correct, that a careful review of market conditions is essential here.
Ground rules of existence
Our frustrations are tempered by what we understand we can expect from the world, by our experience of what it is normal to hope for. Our greatest furies spring from events which violate our sense of the ground rules of existence. The traditional form of comfort is reassurance. One explains to the anxious that their fears are exaggerated and that events are sure to unfold in a desired direction. But reassurance can be the cruelest antidote to anxiety. Our rosy predictions both leave the anxious unprepared for the worst, and unwittingly imply that it would be disastrous if the worst were to pass.
– Alain de Botton, The Consolations of Philosophy
It’s important to understand “what it is normal to hope for.” I remain deeply concerned that investors have come to believe that the link between valuations and subsequent investment returns has been abolished. The problem is that while valuations are extremely informative about long-term market outcomes and full-cycle risks, overvaluation often fails to have any short-term consequence. Indeed, if overvaluation always provoked immediate market losses, it would be impossible for valuations to scale to the heights they reached in 1929, 2000 and today.
To defer the consequences of extreme overvaluation is also to magnify them. That’s the fact that investors repeatedly miss, and the fact that is so destructive over the complete market cycle. The more extreme valuations become, the more systemic the impact of the subsequent collapse.
To quote Howard Marks again, whose investment philosophy is broadly consistent with my own, “Cycles have more potential to wreak havoc the further they progress from that midpoint – i.e., the greater the aberrations or excesses. If the swing toward one extreme goes further, the swing back is likely to be more violent, and the more damage is likely to be done, as actions encouraged by the cycle’s operation at an extreme prove unsuitable for life elsewhere in the cycle.”
Despite a fairly neutral near-term view, my full-cycle outlook remains very pointed. This is an obscenely overvalued market. Looking over the completion of this market cycle (perhaps 18-30 months), I continue to expect a loss in the S&P 500 approaching roughly -60%, with a negative total return for the S&P 500 over the coming 12-year horizon.
As a review of where valuations stand in the cycle, the chart below shows the Hussman Margin-Adjusted P/E (MAPE), which is better correlated with actual subsequent market returns across history than the Shiller P/E, the S&P 500 forward operating P/E, or the so-called Fed Model. Notice that the recent advance has brought valuations to a level that matches or exceeds the 1929 and 2000 peaks, and within about 5% of the record extreme we observed in September 2018.
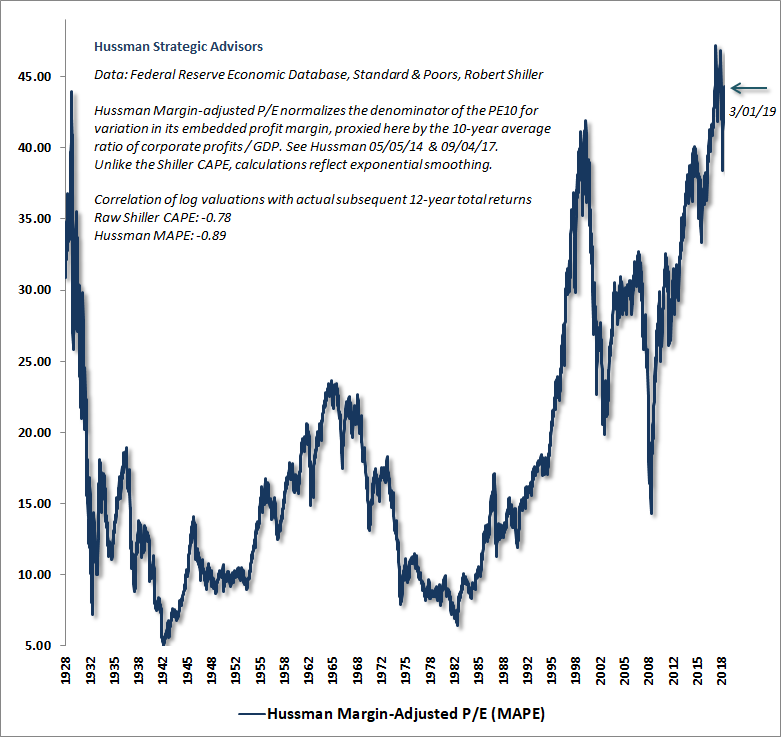
We hear a lot of indignant dismissal of this and similar valuation measures by investors who have evidently never actually examined valuation data or financial history. The fact is that most earnings-based measures, even the Shiller P/E, have only a weak or moderate correlation with actual subsequent market returns.
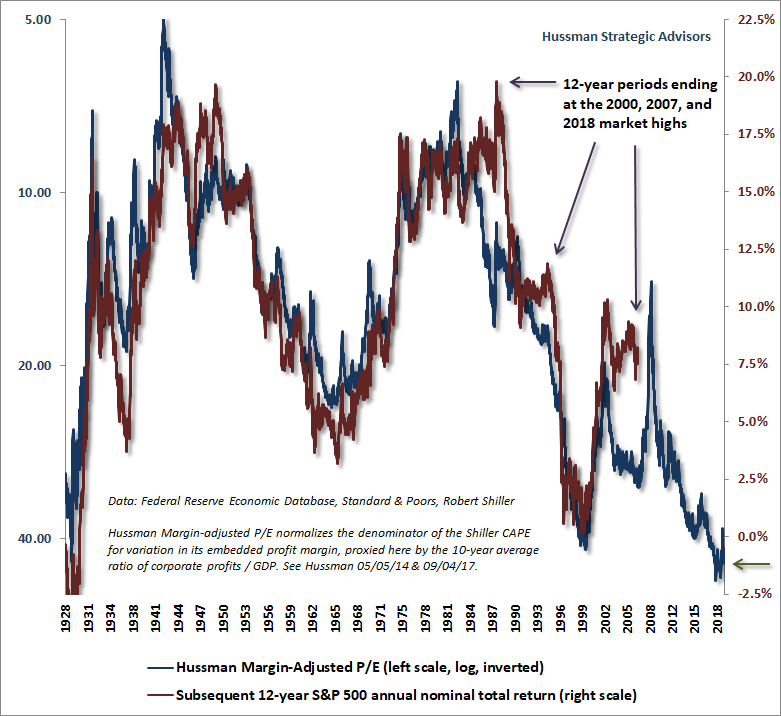
The chart below shows our MAPE on an inverted log scale (left) along with the actual subsequent S&P 500 average annual total return over the subsequent 12-year horizon. While the December decline briefly pushed our expectation for 12-year S&P 500 total returns above zero, the recent advance has driven that expected return back to negative levels, as indicated by the arrow at the lower right.
As I’ve often observed, the key feature of bubbles like 2000, 2007 and today is that, by the market peak, actual S&P 500 total returns over the most recent 12-year period outpace the return that one would have anticipated on the basis of valuations 12-years earlier. This is not an indication that valuations have failed, but rather an indication that prices are likely to do so.
Keep in mind that even years of elevated profit margins are not enough to double or triple the value of a long-term stream of cash flows. Over time, elevated margins are impermanent. Part of this is because labor costs are cyclical, and part is because U.S. corporations compete on the basis of after-tax margins. As I’ve noted before, reductions in nonfinancial corporate tax rates have historically been accompanied by similar reductions in nonfinancial pre-tax profits, so that after-tax profit margins have increased far less than one might have expected as a result of those tax cuts.
Valuations and very long-term cash flows
Stocks are not merely a claim to Wall Street’s estimate of next year’s operating earnings (“earnings without the bad stuff”). They are a claim on decades and decades of future cash flows that will be delivered into the hands of investors over time.
If you’re going to value stocks using the ratio of the stock price to some “fundamental,” you’d better be using a representative, sufficient statistic that’s proportional to the stream of cash flows that can be expected over decades and decades. A valuation multiple is nothing more than shorthand for a proper discounted cash flow analysis.
So one of the ways we can evaluate the “legitimacy” of various valuation measures is to compare them with the valuation that one would obtain by discounting the actual stream of cash flows that the S&P 500 has delivered to investors across history. Remember that because the S&P 500 divisor is adjusted to reflect share buybacks, per-share dividends are fully reflective of those cash flows.
The chart below shows this analysis, discounting the forward stream of dividends at every point in time since 1900, using a discount rate of 10%. The blue line (left scale) shows the ratio of the S&P 500 to the discounted present value of actual future dividends. The red line (right scale) is our Margin-Adjusted P/E, which does a rather worthy job of reflecting a proper discounted cash flow analysis.
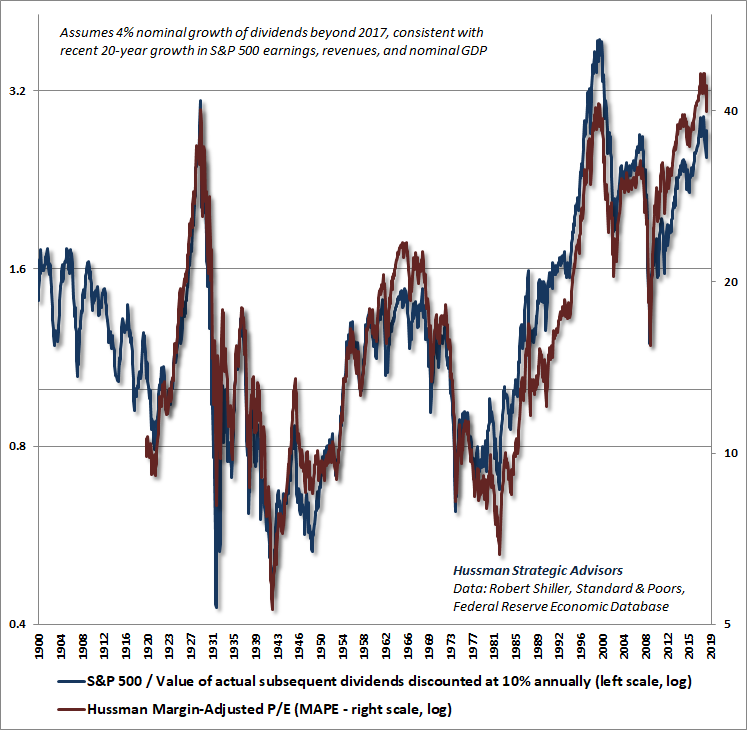
A valuation multiple is nothing more than shorthand for a proper discounted cash flow analysis.
A century of history is consistent with the view that when valuations have been near their historical norms, subsequent S&P 500 total returns have averaged about 10% annually. That figure is widely embedded in the expectations of investors, but it’s also dependent on valuations actually being near their historical norms.
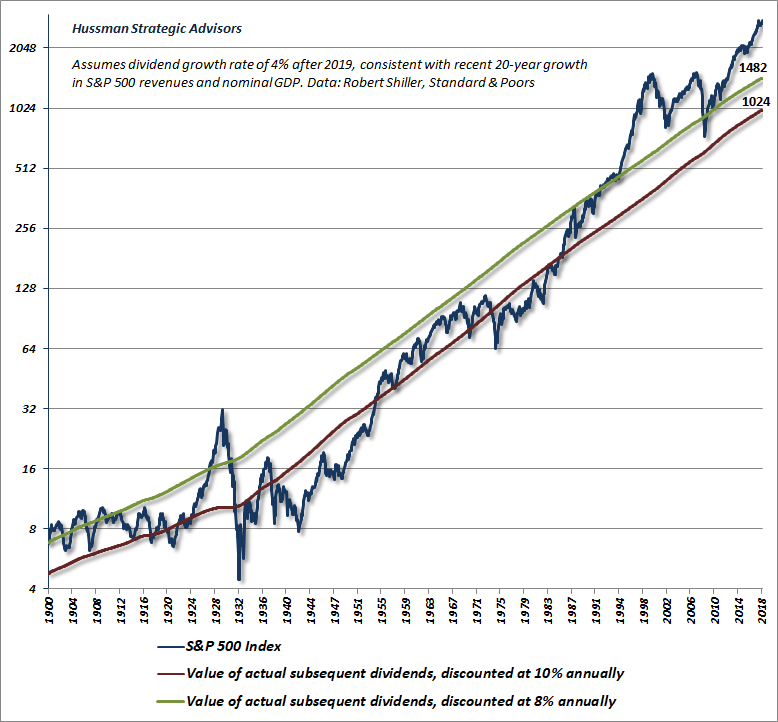
Now, it’s certainly possible to estimate the value of the S&P 500 using lower rates of discount, as long as you accept that the resulting price implies a similarly lower level of expected future returns. The chart below shows the impact of doing so. In my view, passive investors will be rather fortunate if the completion of this cycle draws the S&P 500 only to 1482, which would represent a roughly -50% loss from the September 2018 peak. Though the 2000-2002 decline didn’t bring valuations to the 8% line, those trough valuations were not durable, and the S&P 500 broke even lower during the 2007-2009 collapse.
As a side note, given that structural real GDP growth (trend productivity growth + demographic labor force growth) is running at just 1.6%, with all additional real GDP growth attributable to cyclical declines in the unemployment rate, it’s not surprising that real GDP growth is slowing toward 2%. Add inflation, and one should not be surprised that nominal GDP growth and S&P 500 revenue growth have averaged about 4% annually in recent decades.
It’s important to recognize how much of a drag extreme valuations exert on long-term expected returns. At present, the median of our most reliable valuation measures place the S&P 500 at roughly 2.7 times the historical norm. Suppose we assume that valuations will merely touch their historical norms, and that it will take a full 25 years to get there. Where will the S&P 500 be at that point?
Do the math: (1.04)^25 x (1.0/2.7) – 1 = -1.26%.
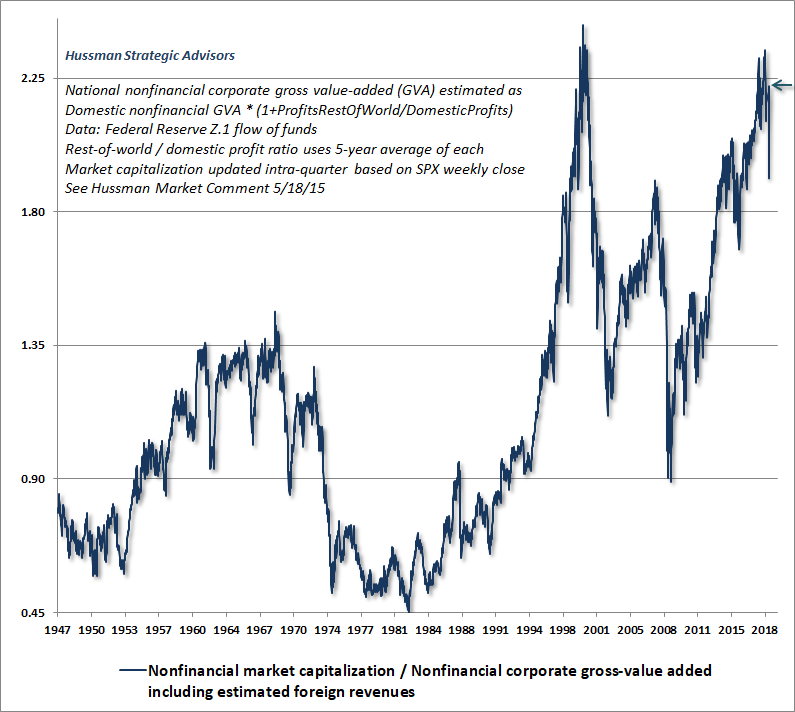
The chart below shows the most reliable valuation measure we’ve introduced over the years: the ratio of nonfinancial market capitalization to corporate gross value-added (including our estimate of foreign revenues). Although MarketCap/GVA has a shorter data history than the MAPE, it is tightly correlated with both actual subsequent S&P 500 total returns and with fully discounted S&P 500 cash flows in data since 1947. On this measure, market valuations are marginally less extreme than they were in 2000, but the difference amounts to the distinction between a -55% decline and a -60% decline to historical norms.
To underscore this expectation of a likely market collapse on the order of -55% and -60% over the completion of the current market cycle, the chart below shows MarketCap/GVA on an inverted scale, truncated at its historical norm. So the lower the blue line, the more extreme the level of market overvaluation. The red area (right scale) shows the deepest loss in the S&P 500 Index over the subsequent 3-year period. That red area ends 3 years ago, of course, since we don’t yet know what the deepest 3-year loss will be for more recent periods.
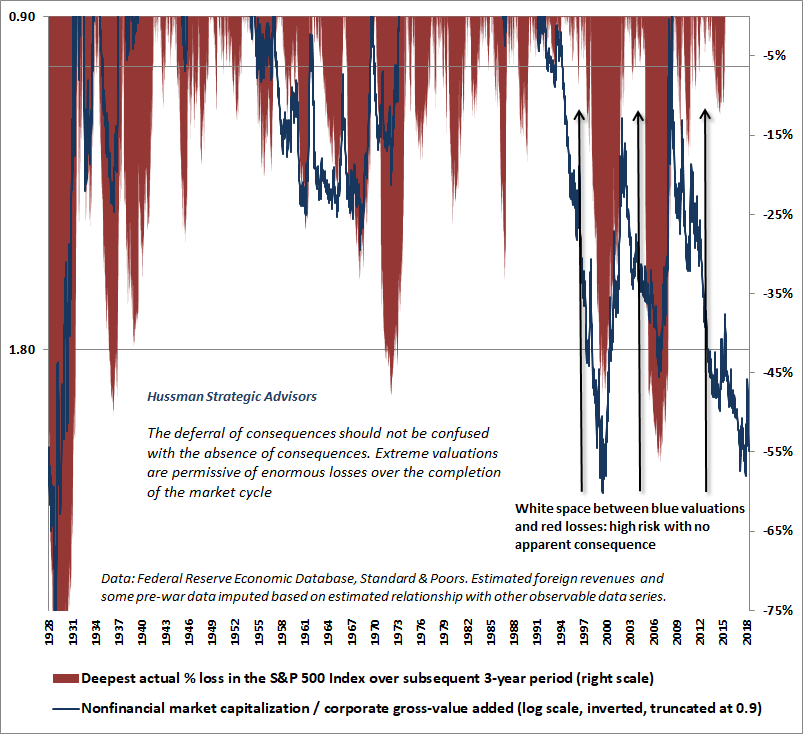
Notice that preceding the valuation extremes of 2000, 2007, and today, there is a region of “white space” between the blue valuation line and the red drawdown area. Those regions represent hope. Specifically, hope that extreme valuations will be sustained forever, based on the fact that they have not had any consequence to date.
Unfortunately, the deferral of consequences should not be confused with the absence of consequences. A 55-60% market loss over the completion of this market cycle would not be a worst-case scenario, but would instead represent a move to historically run-of-the-mill valuations that have almost always been restored or breached over time.
I understand why many investors want reassurance that a 60% market loss is impossible. It is better for investors to be prepared, so they don’t discover later that a run-of-the-mill completion of this speculative market cycle has somehow violated the ground rules of their existence. As de Botton writes, “reassurance can be the cruelest antidote to anxiety. Our rosy predictions both leave the anxious unprepared for the worst, and unwittingly imply that it would be disastrous if the worst were to pass.”
A note on bear market rallies
In recent weeks, a number of observers have argued that somehow the advance since the late-December low is too large to be consistent with an ongoing bear market. As I’ve often observed, it doesn’t really matter whether we use labels like “bull” and “bear” as long as we are continually responsive to the profile of expected return/risk implied by prevailing market conditions, including valuations and internals. Still, given that current valuations are most similar to those of 1929, 2000, and 2007, it is instructive to examine the full course of the bear market declines that followed.
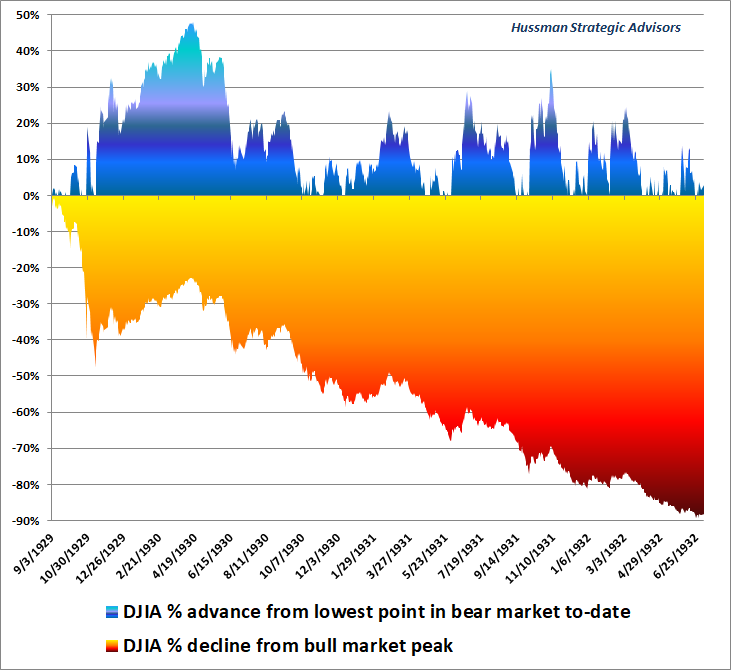
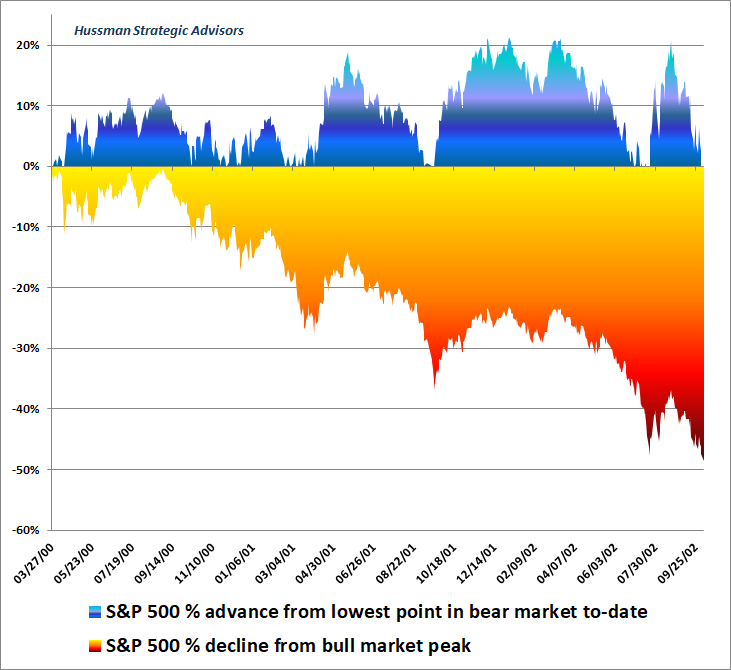
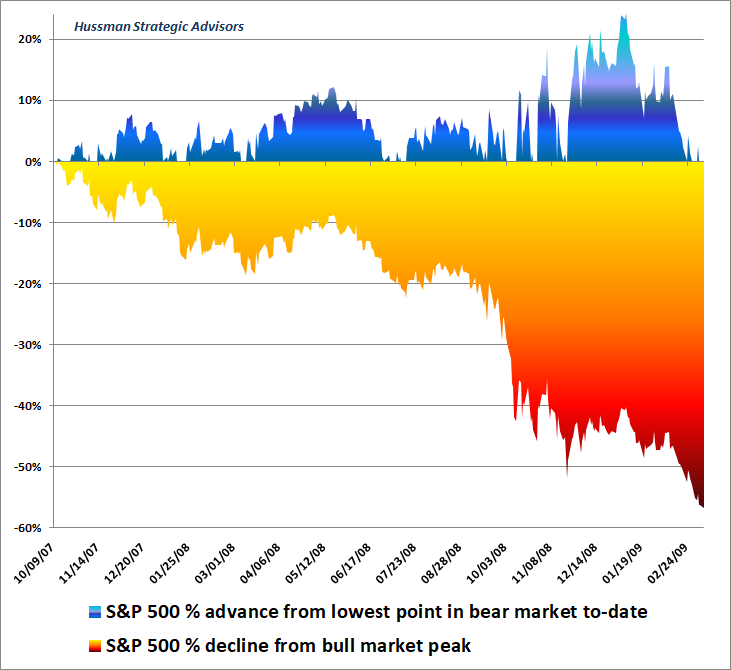
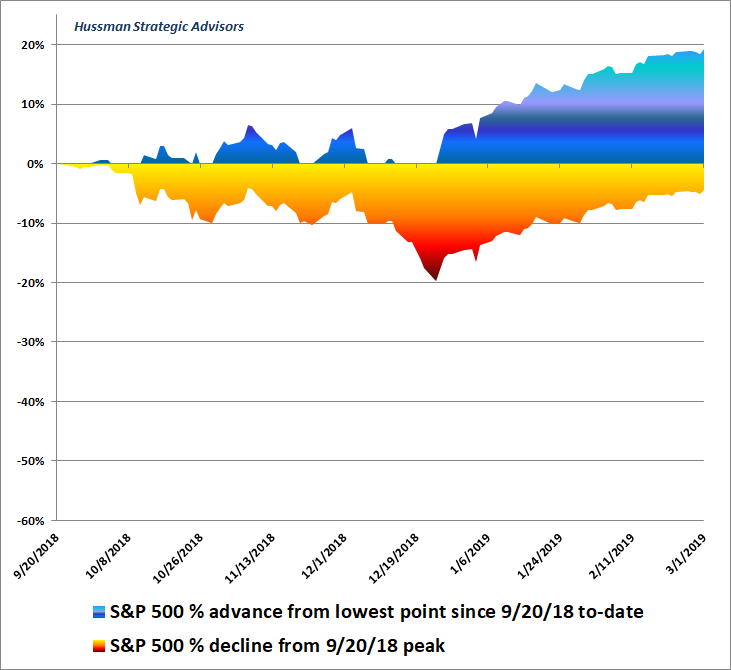
The charts below show two profiles. The blue areas at top show the advances in the stock market from the lowest point to-date of each bear market. The red/orange areas below show the cumulative market loss from the beginning of the bear market. It will quickly become apparent that bear market advances of 10-20% are not unusual. Indeed, given the near-50% market advance from the 1929 low to the June 1930 high, it should be clear that the size of a market rebound is no indication of its durability.
The first chart shows the full course of the 1929-1932 collapse. Notice the tenacity of that first bear market rally, as investors seemingly couldn’t believe that the initial collapse was “real.” They were wrong.
Despite valuations that are presently quite similar to those at the 1929 peak, our expectation for market losses in the current cycle do not contemplate a decline below historical valuation norms. It was the violation of those norms that produced a near-90% market collapse during the Depression.
The chart below shows the 2000-2002 bear market. Recall that while valuations did not reach their historical norms at the 2002 low, the market would ultimately reach an even lower trough in March 2009. Notice that the bear market included multiple rebounds in the 10% area, and three separate bear market rallies approaching or exceeding 20%.
The next chart shows the 2007-2009 collapse. Notice that the bear market was underway for nearly a year before the S&P 500 had declined by more than 20%. Furious recovery rallies approaching or exceeding 20% were subsequently wiped out by the final low.
The chart below shows the progress of the S&P 500 since the September 20, 2018 market peak. While we can’t say definitively that this was the bull market top, particularly given that the recent rebound has brought the S&P 500 within 5% of that extreme, it should be clear that the recent advance is not entirely out of character even for an ongoing bear market.
In summary, with the total equity market capitalization of U.S. financial and nonfinancial corporations now over $40 trillion, the highest multiple of GDP in history, we expect dismal consequences for the U.S. stock market over the completion of this cycle, and over the coming 10-12 years. Yet the historical reality is that once speculation shifts to risk-aversion, a period of just 18-30 months is typically required for valuations to revert to average or below-average levels, creating fresh opportunity for value-conscious long-term investors.
At present, we’re observing a clear fight between speculation and risk-aversion, with exuberance about the Federal Reserve “caving” back to dovish behavior encouraging investors that they can ignore valuations and even deteriorating economic measures. Despite full-cycle risks, it’s not clear how this fight will be resolved over the near-term. We’ve learned in this cycle that the tenacity of speculators can’t be underestimated, so with market internals at the threshold between speculation and risk-aversion, it’s best not to stand too strongly in either direction.
Fortunately, implied volatility in the options market is rather low, so it’s possible to maintain a rather neutral near-term outlook while still making some allowance for a large move in either direction. What matters most here is to recognize where valuations are in the cycle, and that even a shift to a speculative mentality could quickly run into a wall of economic deterioration, as was the case both in early-2001 and early-2008. So while our near-term outlook is fairly neutral, we also maintain our expectation of profound full-cycle market losses. Beyond that, there’s no need to approach near-term uncertainty as if we were actually certain of the market’s near-term direction.
Keep Me Informed
Please enter your email address to be notified of new content, including market commentary and special updates.
Thank you for your interest in the Hussman Funds.
100% Spam-free. No list sharing. No solicitations. Opt-out anytime with one click.
By submitting this form, you consent to receive news and commentary, at no cost, from Hussman Strategic Advisors, News & Commentary, Cincinnati OH, 45246. https://www.hussmanfunds.com. You can revoke your consent to receive emails at any time by clicking the unsubscribe link at the bottom of every email. Emails are serviced by Constant Contact.
The foregoing comments represent the general investment analysis and economic views of the Advisor, and are provided solely for the purpose of information, instruction and discourse.
Prospectuses for the Hussman Strategic Growth Fund, the Hussman Strategic Total Return Fund, the Hussman Strategic International Fund, and the Hussman Strategic Dividend Value Fund, as well as Fund reports and other information, are available by clicking “The Funds” menu button from any page of this website.
Estimates of prospective return and risk for equities, bonds, and other financial markets are forward-looking statements based the analysis and reasonable beliefs of Hussman Strategic Advisors. They are not a guarantee of future performance, and are not indicative of the prospective returns of any of the Hussman Funds. Actual returns may differ substantially from the estimates provided. Estimates of prospective long-term returns for the S&P 500 reflect our standard valuation methodology, focusing on the relationship between current market prices and earnings, dividends and other fundamentals, adjusted for variability over the economic cycle.