

Propositions for a Recessionary Bear Market


John P. Hussman, Ph.D.
President, Hussman Investment Trust
October 2019
As the financial markets enter what I expect to be a rather disruptive completion to the recent speculative half-cycle, it will be helpful for investors to consider certain propositions that are readily available from history, rather than insisting on re-learning them the hard way.
Employment data is the last to know
Proposition: Risk-sensitive assets and confidence measures generally precede economic shifts; production, consumption and income measures are coincident with broad economic activity; and labor market measures lag the economy. The unemployment rate is the single most lagging economic indicator available.
I’ll begin by noting that while some of our measures are already warning of recession risk, I currently characterize those risks as increasing but not decisive. The more sensitive the measure, the more vulnerable it is to false signals. Given that market conditions already place us in a defensive investment position, I’d prefer to sacrifice a bit of timeliness on a recession signal in return for a bit more confidence. There’s little to be gained from rushing to a recession warning on the basis of less reliable measures. The conservative version of our Recession Warning Composite wasn’t quite triggered in September data, but suffice it to say we’re quite close.
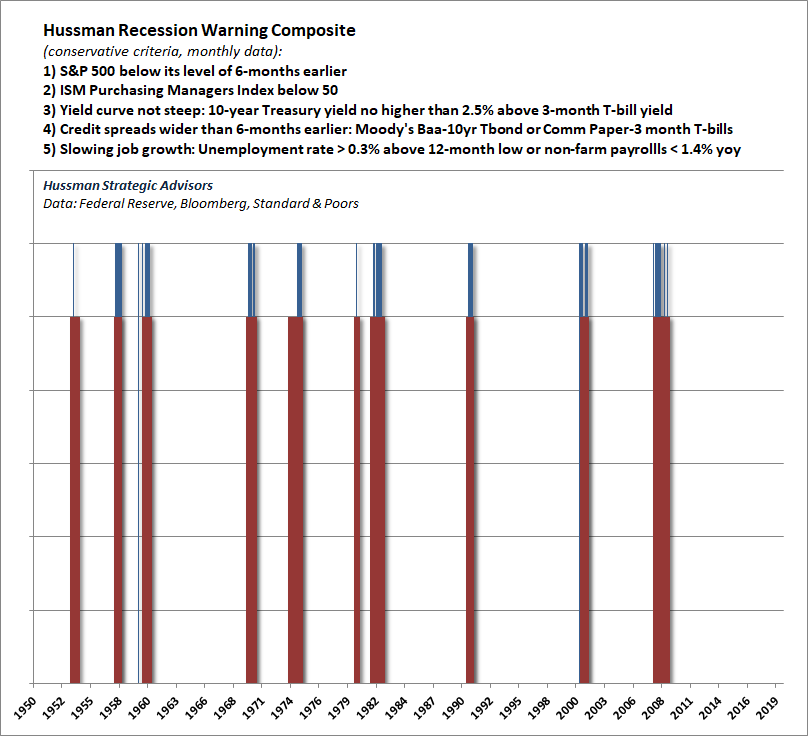
Notice that our Recession Warning Composite isn’t based on any single indicator, but on joint deterioration in financial measures (stocks, credit, yield spreads), confidence (ISM), and either a slowing of employment growth or a modest 0.4% increase in the unemployment rate. In previous cycles, I used these employment measures as confirming indicators, but I added them to increase our confidence in initial recession warning signals, despite the fact that they can add a slight delay.
As I noted in my October 2000 recession warning, also based on this composite:
It is quite true that consensus economic forecasts remain relatively upbeat here. Unfortunately, most economists have never fully internalized the ‘rational expectations’ view that market prices convey information. Of course, accepting this view does not require one to believe that prices convey information perfectly (which is what the ‘efficient markets hypothesis’ assumes). But where finance economists take this information concept too far, economic forecasters don’t take it far enough. As a result, economic forecasts are generally based on coincident indicators such as GDP growth and industrial production, or pathetically lagging indicators such as consumer confidence and the unemployment rate. Even the ‘leading indicators’ fail to live up to their name. This tendency to gauge economic prospects by looking backward is why economists failed to foresee the Great Depression and every recession since.
– John P. Hussman, Ph.D., October 2000
The reason our Recession Warning Composite focuses on psychologically-driven variables like stock prices, yield spreads, credit risk, and purchasing manager surveys is that few measures of “hard” economic activity reliably lead recessions. For example, while recessions tend to be preceded by sub-par employment growth over the preceding 6-12 month period, job growth tends to turn negative only after entering a recession, not before. Similarly, the rate of unemployment tends to tick up slightly before a recession starts, but the strongest increases in the unemployment rate typically lag the start of a recession by about 8 months. New claims for unemployment also have only slight short-leading usefulness.
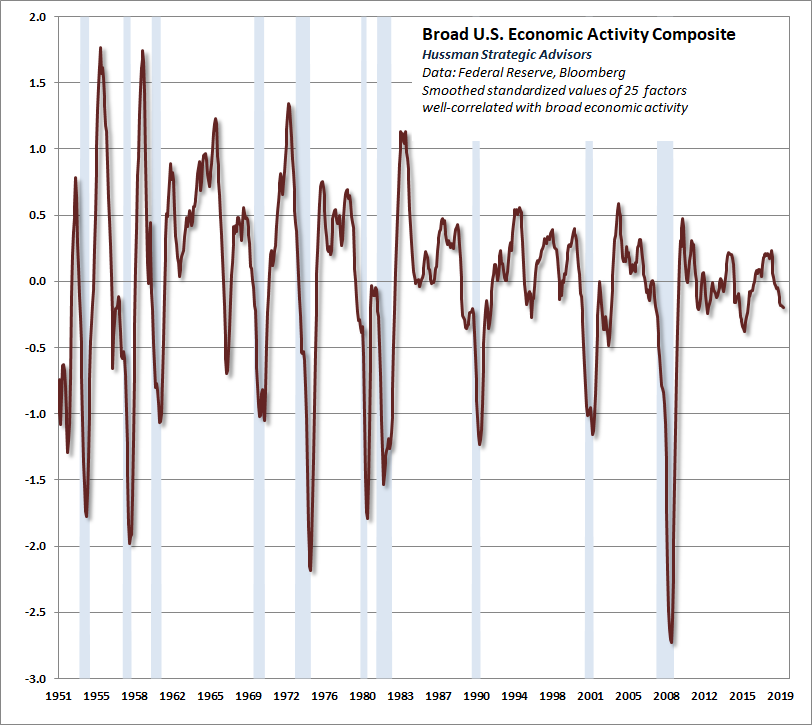
When we examine broader economic measures that are well-correlated with overall economic activity, we observe clear deterioration, but these measures are not yet at levels that one would decisively associate with recessions. The chart below shows the average standardized value of 25 economic measures we track, including employment growth, income, production, capacity use, and similar variables. Broadly speaking, this particular set is more useful in gauging the magnitude of economic fluctuations than identifying turning points.
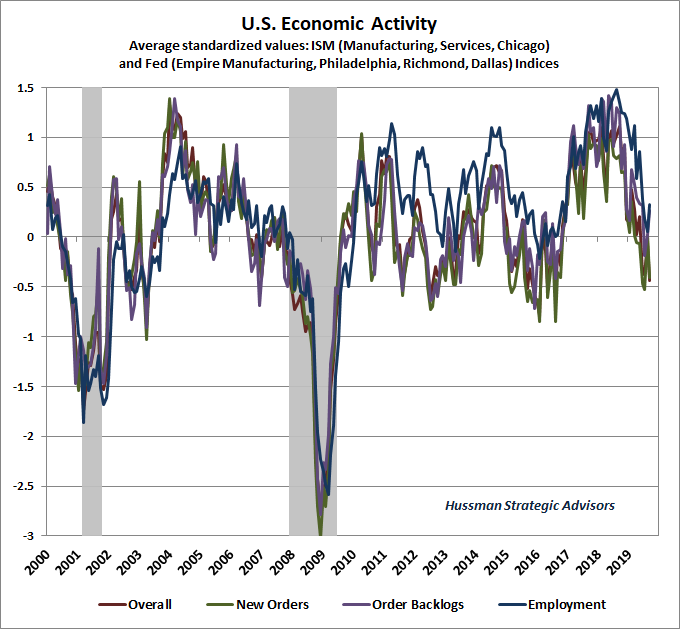
We observe slightly greater deterioration in our economic composite based on regional and national purchasing managers surveys and Federal Reserve activity measures, but again, I consider financial market variables like stock prices and credit spreads to be key elements of any recession signal.
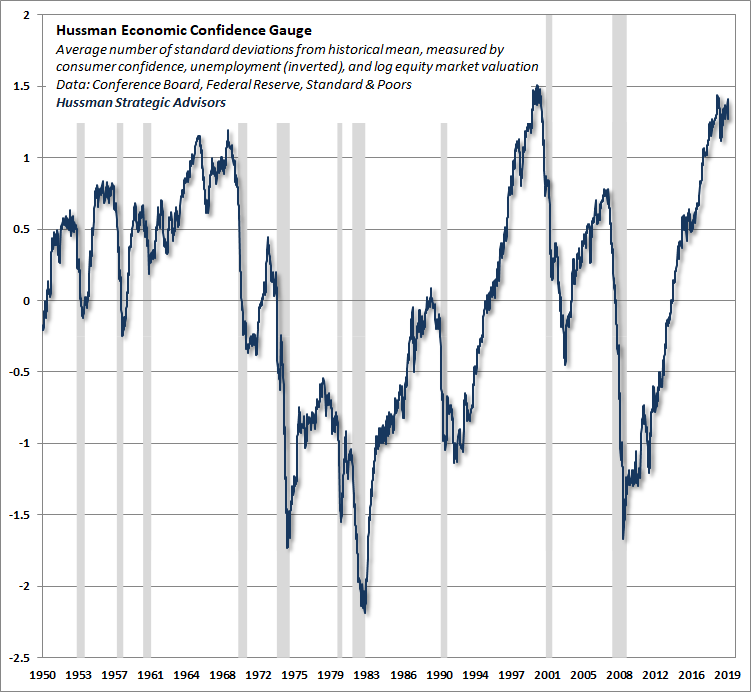
Meanwhile, it’s important to realize that the current expansion is now the longest in U.S. history, with extremely elevated confidence reflected in financial markets, consumer sentiment, and employment. While these elevated confidence measures seem to indicate a “strong” economy, they actually tend to be contrary indicators in the sense that high levels are generally followed by unusually weak economic outcomes over the subsequent 2-3 year period. Note also that once these measures jointly deteriorate, recessions tend to begin almost immediately. We would monitor them closely.
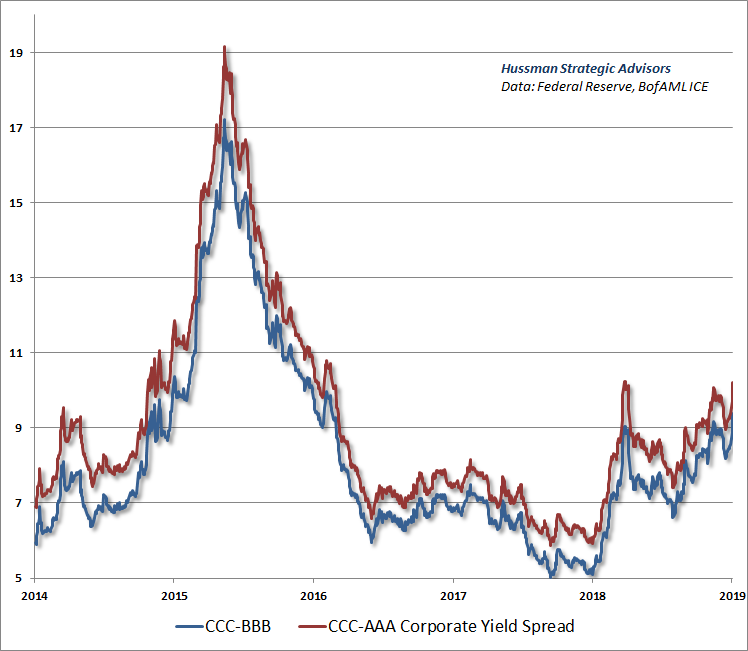
With regard to confidence, another factor that deserves attention is the behavior of credit spreads. In recent months, we’ve observed increasing strains in junk-rated debt relative to corporate bonds of higher creditworthiness. This is of broad concern because, as Morgan Stanley recently observed, fully 50% of the investment-grade corporate bond market is now rated just a single rung above junk. Even in a mild recession, the weakness we presently observe in junk debt could spread far more quickly than investors might imagine, even among so-called investment-grade bond funds. The situation is reminiscent of 2007, when investors believed that mortgage strains were confined to sub-prime debt, only to later discover that it extended to every corner of the mortgage-backed market.
Market losses precede recession recognition, not the other way around
Proposition: By the time a U.S. recession begins, stocks have typically been in a bear market for months. Indeed, by the time a recession is widely accepted, a great deal of bear market damage has typically already been done.
As a rule, when market downturns coincide with economic downturns, the bear market bottom has never occurred until the recession is widely and firmly recognized in the media. At bear market bottoms, the existence of a recession is taken as common knowledge. The media is no longer tentative about the possibility, and there’s no tiptoeing around the subject using phrases like ‘The R-word.’
– John P. Hussman, Ph.D., September 2001
(following our October 2000 recession warning)
In November 2001, the business cycle dating committee of the National Bureau of Economic Research officially declared that a U.S. economic recession had started in March of that year. Notably, the committee’s job is to set official start and end dates for business cycle turns, not to forecast them. Still, the NBER’s recession statement was broadly rejected by Wall Street. As I wrote at the time, “while I strongly agree with that assessment, many observers on CNBC and elsewhere have essentially scoffed at the notion that the U.S. is even in a recession.” This, despite the fact that the S&P 500 had already lost nearly -40% of its value from its March 2000 peak, while the Nasdaq 100 had lost -77%, on their way to losses of -50% and -83%, respectively.
Investors have been largely in denial about recession risk and the continuing onslaught of foreclosures and credit losses. ‘Capitulation’ would mean investors accepting those risks, and also believing that they will only get worse. My impression is that we will eventually observe that sort of capitulation, hand-in-hand with broad recognition that the U.S. economy is in recession.
– John P. Hussman, Ph.D., June 2008
(following our November 2007 recession warning)
In December 2008, at the height of the global financial crisis, the NBER issued a statement confirming that the U.S. economy had entered a recession in December 2007, a full year earlier. By then, the S&P 500 had collapsed by -53% from its bull market high. Notably, even in August 2008, just before the September-November collapse, investors were still skeptical that the U.S. economy might be in a recession. This doubt was supported by the fact that GDP growth was positive in the second quarter of 2008, and investors incorrectly believed (as many still do) that a recession is defined as two consecutive quarters of negative GDP growth.
As I wrote at the time, “Market tops are created because investors stop looking for a top, and simply extrapolate good news as a permanent feature of the economic landscape. Similarly, market bottoms are created because investors stop looking for a bottom, and extrapolate ongoing bad news. If you remember the lows of 1982, or 1990-1991, or 2002, you’ll recall that in each instance, the question among investors wasn’t whether the economy would recover in one quarter versus two quarters. The question was how the economy could recover at any point in the foreseeable future. Investors give up hope at bottoms. We don’t see that here. Today, there is still a lively debate about whether the U.S. economy is even in a recession.”
The central point is that by the time there is broad consensus about an economic recession, tremendous damage has often already been done in the stock market. Investors accept enormous risk if they believe they can comfortably wait until a well-recognized recession before they reduce their investment exposure.
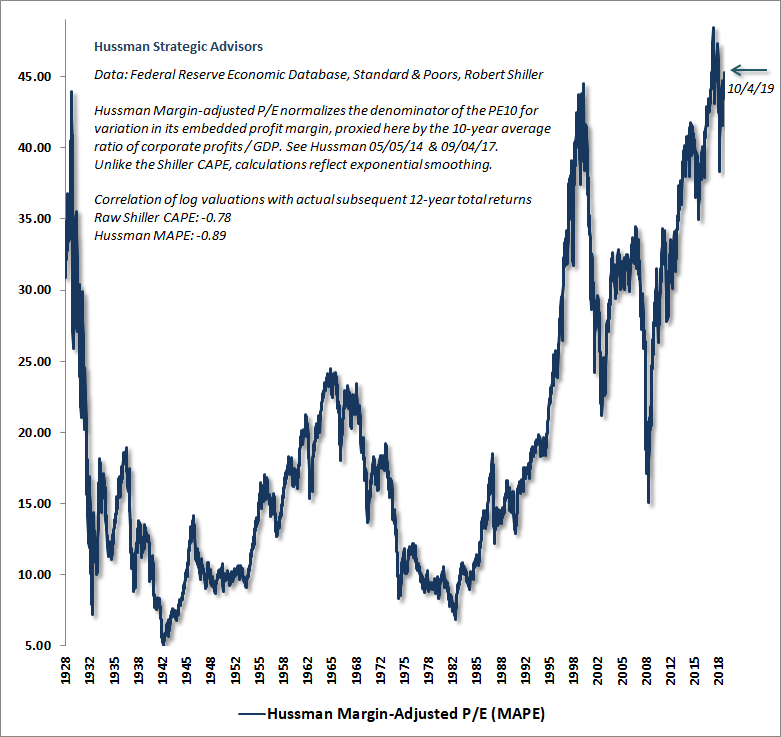
Look, I expect the S&P 500 to lose somewhere between 50-65% over the completion of the current market cycle. A 65% loss would bring the S&P 500 to historically run-of-the-mill valuation levels. A loss of that magnitude would certainly not be a worst-case scenario. A 50% market loss would take our most reliable valuation measures to the same levels we observed in October 2002, which marked the highest valuations ever observed at the completion of any previous market cycle. Neither prospect contemplates a move to undervalued levels on the measures we find best-correlated with actual subsequent market returns across history.
The chart below shows our Margin-Adjusted P/E (MAPE), which is better correlated with actual subsequent market returns than numerous popular measures, including price/forward operating earnings, the Shiller CAPE, and the Fed Model. At present, U.S. stock market valuations continue to rival or exceed those observed at the 1929 and 2000 market peaks.
Low interest rates aren’t your friends
Proposition: Low interest rates don’t “justify” elevated stock market valuations. Rather, the combination of low interest rates and high valuations simply implies that both stocks and bonds are priced to produce similarly low future returns.
One of the fallacies that investors have increasingly embraced, fully encouraged by Wall Street, is the notion that low interest rates “justify” the current extremes in stock market valuations. The killer phrase to listen for is “stocks appear fairly valued relative to interest rates”, which almost suggests that rich valuations can be ignored, and investors can still expect normal, satisfactory long-term returns in the future. This belief reflects a misunderstanding of how assets are priced.
Given a set of future cash flows that will be delivered into the hands of investors over time, we can choose an “expected” rate of return, discount the future cash flows to present value, and calculate the current price that will deliver that rate of return. For example, if a security promises to deliver a single $100 payment 10 years from today, and an investor wants to earn a 4% annual return on the investment, the appropriate price today is $100/(1.04)^10 = $67.56.
Conversely, given the current price of the investment and the expected future cash flows, one can use that information to infer the expected future rate of return: ($100/$67.56)^(1/10)-1 = 4%.
If we price the same security using a 2% annual return, the new price is $82.03. Conversely, if we know that the current price is $82.03, we can infer that the expected future rate of return is 2%. The higher the current valuation, the lower the expected rate of return (and vice versa).
In short, given some set of expected future cash flows, there is a “mapping” between the current valuation of the security and the expected future rate of return. If you understand this, you are way ahead of most investors, because you’ll immediately understand that even if Wall Street says “low interest rates justify high stock market valuations,” it doesn’t change the fact that those high stock market valuations will still be associated with poor subsequent stock market returns.
The present level of overvaluation may be even worse than it looks
Proposition: If interest rates are low because nominal growth rates are also low, those low interest rates don’t “justify” elevated valuations at all. The low growth rate itself is sufficient to produce low returns, without any change in price. In this situation, elevated valuations simply penalize returns twice.
You can do the same kind of “present value” calculation using a growing stream of cash flows. Here’s what you’ll find. For a given set of expected future cash flows, a lower long-term rate of return implies higher valuations (and vice versa). But here’s the kicker. If you change both the growth rate and the long-term rate of return by the same amount, so that both are low (or high), the appropriate security price doesn’t change at all.
I’ve written extensively about the large and gradual reduction in “structural” U.S. real GDP growth in recent decades (the sum of demographic labor force growth and trend productivity). Holding the unemployment rate constant, we presently expect the U.S. economy to grow at a rate of only about 1.6% in the coming decade, while even a doubling of productivity growth would leave structural GDP growth below 3% annually.
In the context of low structural real growth and muted inflation, the muted nominal growth rate of GDP, S&P 500 revenues, corporate gross value-added and other fundamentals is already quite consistent with the low prevailing level of U.S. interest rates.
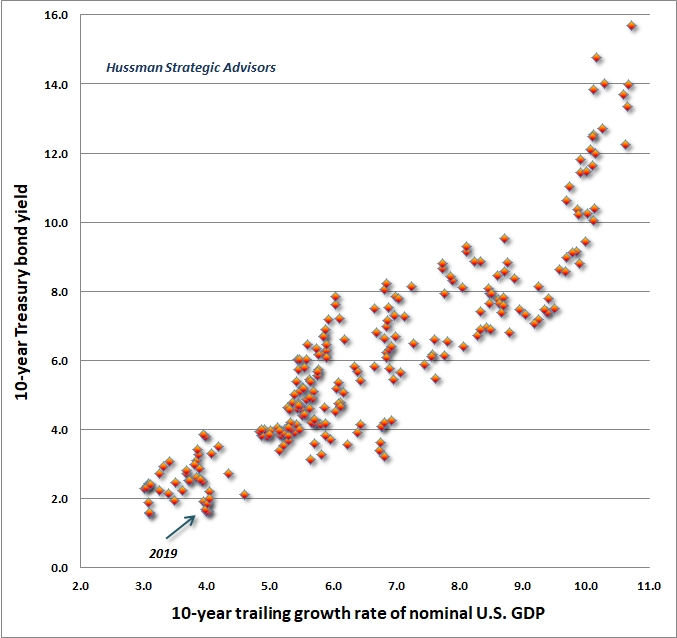
The chart below plots the 10-year growth rate of nominal U.S. GDP against the yield on the 10-year U.S. Treasury bond. Notice that co-movement of nominal economic growth rates and nominal interest rates is the rule, not the exception. In this context, the notion that “low interest rates justify elevated stock valuations” is almost maddening, because it ignores the fact that low nominal rates and low nominal growth go hand-in-hand.
One might object that yes, nominal S&P 500 revenues have grown at an average annual rate of only 3.5% since 2000, well below their historical norm, but the expansion of corporate profit margins has allowed earnings to grow at a faster rate of over 5% annually. While this is true, actually maintaining earnings growth above revenue growth would require profit margins to expand indefinitely.
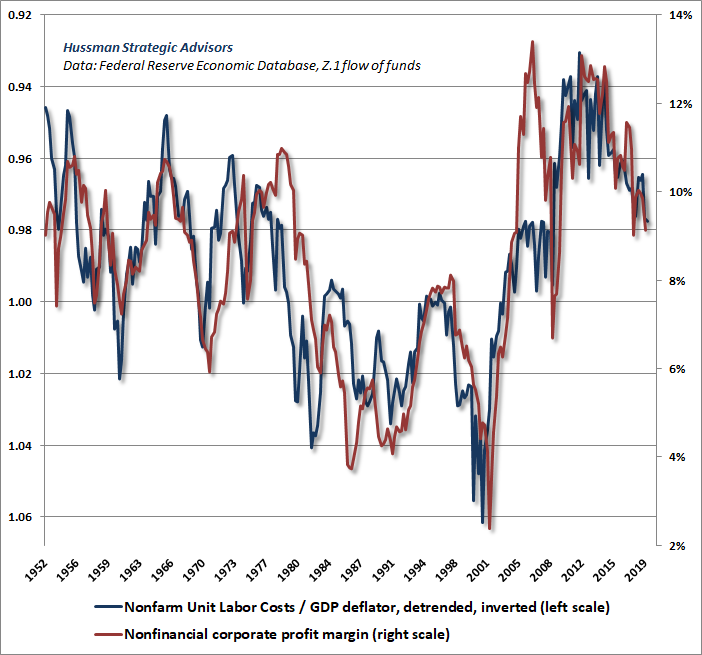
Some observers have attempted to explain elevated profit margins by waxing rhapsodic about things like “mass collaboration and sharing enabled by technology and global communications networks.” We hear versions of this “new economy” argument all the time. The fact is that profit margins have remained tightly linked to real unit labor costs. In my view, the recent boom in profit margins was largely the artifact of unusual labor market slack that followed the global financial crisis. As the chart below illustrates, those pressures are already reversing.
The bottom line is that the combination of low interest rates and hypervalued stock market valuations is not some “fair value” equilibrium. Instead, it presents investors with the worst of all possible worlds. Not only are prospective stock market returns low, but unlike the 2000 peak, when relatively elevated bond yields offered a reasonable alternative to investors, long-term interest rates are presently also depressed, as are short-term interest rates.
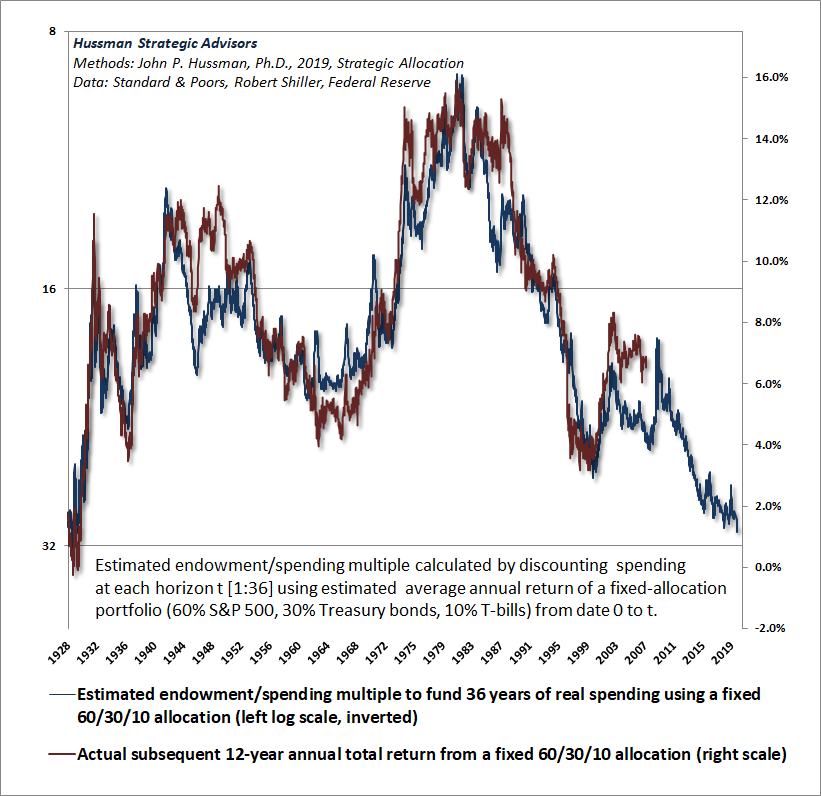
The chart below is one way we can illustrate the likely prospective investment returns of a conventional passive asset mix invested 60% in the S&P 500, 30% in Treasury bonds, and 10% in Treasury bills. The methods are described in my recent white paper, Strategic Allocation.
Two things should be clear. First, a passive investor looking to fund several decades of future inflation-adjusted spending would presently need more money up-front than at any point in history since the 1929 market peak. Second, our estimate of prospective nominal 12-year total returns on a passive investment mix is currently less than 1% annually.
Valuations aren’t enough (market internals matter)
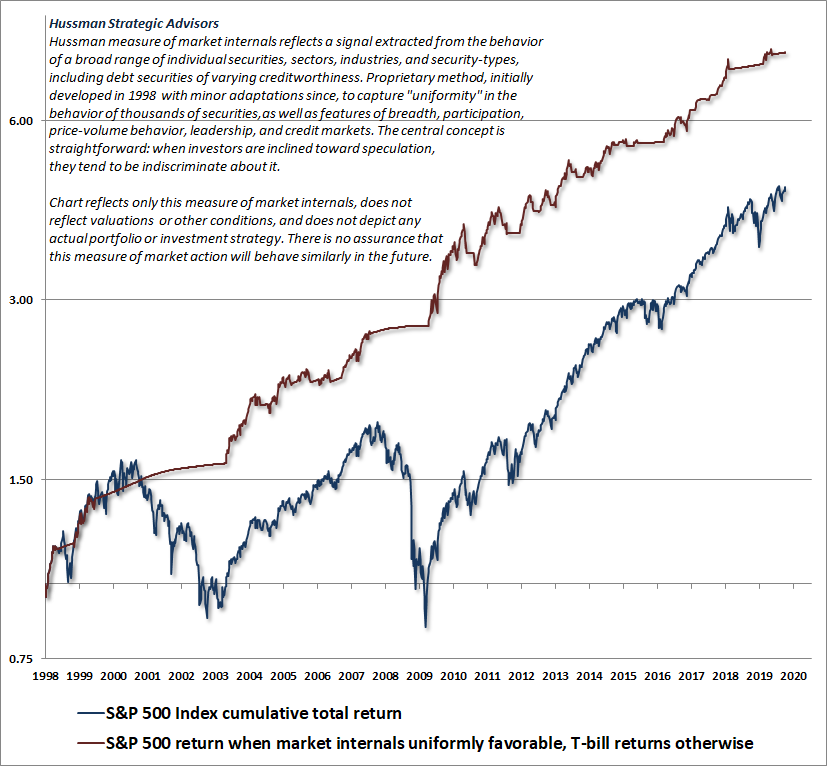
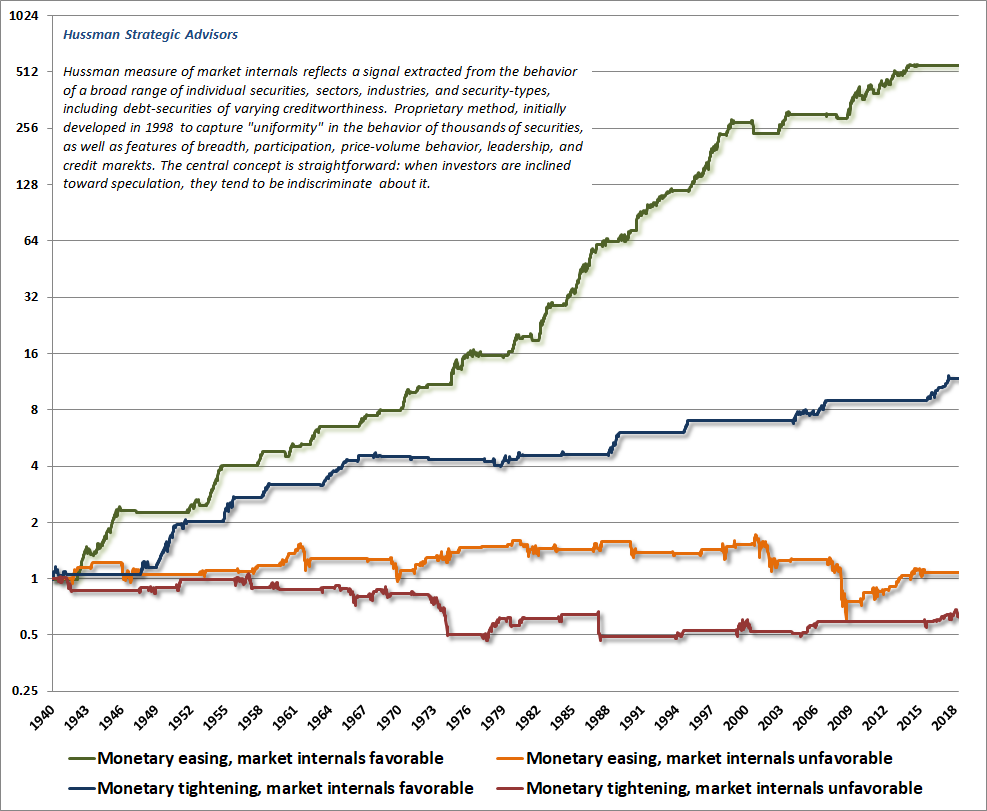
Proposition: While valuations reliably drive long-term investment outcomes, returns over shorter segments of the market cycle are primarily driven by investor psychology – specifically, whether investors are inclined toward speculation or risk-aversion. Because speculation tends to be indiscriminate and risk-aversion tends to be selective, one of the best ways to gauge this investor psychology is to monitor the uniformity or divergence of market internals, based on the market action of individual stocks, industries, sectors, and debt securities of varying creditworthiness.
I introduced our concept of market internals (what I used to call “trend uniformity”) in 1998. At present, these measures remain negative, as they have for nearly the entire period since the January 2018 market peak. Investors should recognize that this was also when the bull market in most global stock markets ended. Indeed, even the S&P 500 has barely outperformed Treasury bills since January 2018.
The chart below shows the cumulative total return of the S&P 500 since 1998, along with the cumulative total return of the S&P 500 restricted only to those periods where market internals are favorable on our measures (accumulating Treasury bill returns otherwise). The chart is historical, does not reflect the performance of any portfolio, and there is no assurance that future market returns will be similarly related to these measures.
Put simply, we currently observe an unfavorable combination of extreme valuations and ragged market internals. This creates a potential “trap door” situation for the stock market. As I’ve often noted, the greatest market losses generally emerge in periods where risk premiums are very low, and are being pressed higher. Indeed, from a valuation perspective, a market crash is nothing but a spike in the risk-premium that’s embedded into stock prices.
Long-term bonds are largely a speculative investment here
Proposition: The yield-to-maturity at which an investor purchases a bond is, emphatically, also the average annual rate of return that the investor will obtain if that bond is held to maturity and does not default. While the short-term return on a bond will exceed its yield-to-maturity during periods when the yield itself is falling, that return should not be extrapolated into the future. This is an error that investors can make when evaluating bond funds and ETFs.
In the bond market, we presently observe not only low yields, but an inverted yield curve, with short-term Treasury securities yielding nearly the same, or more, than long-dated Treasury bonds. So just as stock valuations provide no “risk premium” to investors as compensation for potential price losses, the interest rate structure also provides very little in the way of a “term premium” for holding long-term bonds rather than short-term Treasury bills.
Indeed, the main argument for holding long-term bonds here is a speculative one: the potential for an economic downturn to drive already depressed bond yields even lower. I don’t really disagree with this motive, but would emphatically recognize it as speculative, and would limit any such speculation to bonds with the highest credit ratings.
From an investment standpoint, remember that if you buy a 10-year Treasury bond at a 1.5% yield-to-maturity, you really are going to get an overall total return of just 1.5% annually over the coming decade, regardless of where the bond price or the rate of inflation goes in the interim.
There’s more inflation pressure in the pot than I suspect investors realize, though my impression is that it will boil over only after explosive deficits during the next recession finally provoke investor revulsion to government liabilities (both currency and debt). We already observe what I’ve described as “cyclically excessive” deficits, but my sense is that greater shocks will be necessary to trigger broad revulsion.
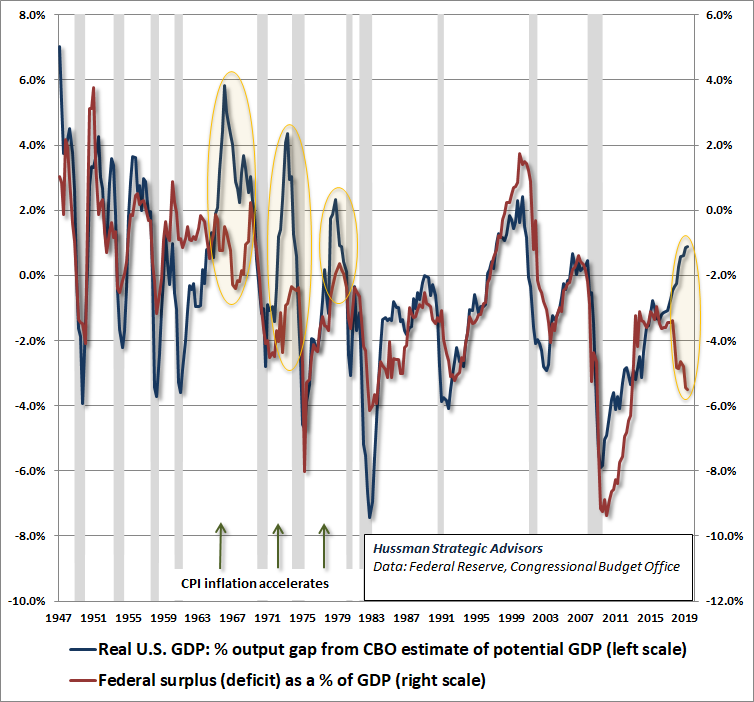
The chart below provides an update on the deficit situation. The U.S. Treasury has run a deficit of nearly a trillion dollars over the past year. The blue line (left scale) shows the U.S. GDP output gap (the difference between actual GDP and the Congressional Budget Office estimate of “potential” or “full employment” GDP). The red line (right scale) shows the U.S. Federal deficit as a percentage of GDP.
Notice that it’s not unusual for the red line to fall to significant deficits during economic recessions. What is unusual is for the red deficit line to plunge as it is doing now, despite an economy operating near full employment. That’s why I call this a “cyclically excessive” deficit. Though inflation has a strong psychological component, and it’s difficult to predict when unchecked creation of government liabilities will trigger revulsion, it’s worth noting that each previous instance of cyclically excessive deficits in recent decades was followed by an acceleration of inflation.
Meanwhile, keep in mind that Treasury bills outperformed the S&P 500 between 1965 to 1985, amid the worst inflationary episode in the postwar period. Stocks also posted zero total returns between 1915 and 1921, despite an inflation rate that soared above 20%. Don’t imagine that stocks will be a useful “inflation hedge” in an environment of rising inflation, particularly if they are purchased at elevated valuations. At present, the consumer price index would need to roughly triple before the benefit of inflation on nominal growth would overwhelm the negative effect on market valuations.
Cash has option value
Proposition: Elevated stock market valuations can make cash a much more viable investment alternative than investors seem to recognize.
One of the most frequent questions investors ask in an overvalued market is “What alternative is there? Cash?!?” The question is asked with the same indignant tone Timon used as he yelled at the Lion King “What do you want me to do? Dress in drag and do the hula?!?”
Well, actually, at present valuations, that’s not a bad idea – cash, I mean – provided that one also maintains the flexibility to shift to a more constructive investment stance at a future point where a material retreat in valuations is joined by an improvement in market action (as I’ve done after every bear market in over three decades – my error in this cycle had an entirely different origin). The flexibility to change one’s investment stance in response to improvements in valuations and market action is what gives enormous “option value” to cash.
As I detailed in Going Nowhere in an Interesting Way, the completion of a speculative market cycle can entirely wipe out the returns that stocks have enjoyed over-and-above T-bill returns, often going back a decade or more. To illustrate this point, let’s briefly ignore market internals and other considerations that help during shorter segments of the market cycle, and focus strictly on valuations. I don’t recommend this as an investment strategy, but it’s instructive.
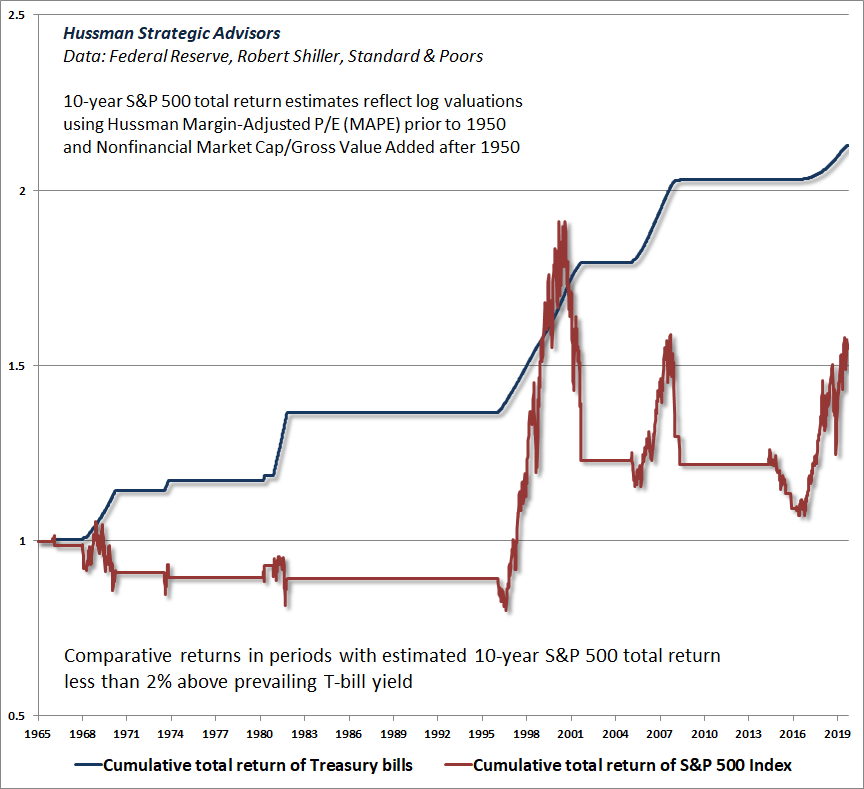
I’ve frequently demonstrated that across history, and in multiple sub-samples of history, several measures of market valuation have a reliable and stable relationship with subsequent long-term investment returns. The key feature of useful valuation measures is that the underlying “fundamentals” should act as “sufficient statistics” for the very long-term cash flows that stocks are likely to deliver over time. On this front, we find that the measures best correlated with subsequent market returns across history are MarketCap/GVA (nonfinancial market capitalization / corporate gross value-added, including estimated foreign revenues) and our Margin-Adjusted P/E (MAPE).
The shaded regions in the chart below show periods where valuations were sufficiently elevated that estimated 10-year S&P 500 total returns were less than 2% above the prevailing Treasury bill yield. Presently, our estimates for 10-year S&P 500 total returns are actually negative, so this condition is clearly true today. Notice that these periods are often quite extended, and include long segments of bubble advances, such as the late-1990’s, as well as the advance of recent years. Indeed, they cover 30% of the period since 1965.

What’s striking about these shaded periods is that despite what were often sizeable interim advances, all of the total returns that the S&P 500 enjoyed over-and-above T-bill returns were ultimately wiped out. Moreover, with the exception of the 1979-70 bear market, price declines continued well beyond the point where projected 10-year S&P 500 returns reached a 2% premium to T-bill yields. The chart below shows the cumulative total returns of the S&P 500 Index and Treasury bills, restricted to those shaded periods.
Even without the benefit of market internals, this chart is a good reminder of why I often say that, once market valuations become extreme, the full cycle is enormously forgiving of investors who make the “mistake” of managing risk and reducing their market exposure too early.
From a full-cycle perspective, it’s not surprising that periods beginning at extreme valuations, or ending at depressed valuations, have historically been unrewarding for long-term investors. As I noted last month, within the 80-year period from 1929 to 2009, the S&P 500 took three long, interesting trips to nowhere, accounting for 53 of those years (1929-1945, 1959-1982, and 1995-2009), underperforming risk-free Treasury bills after all was said and done.
Of course, each of those episodes included extended periods during which stocks were very rewarding, if only temporarily. That’s where market internals can be extremely useful, because they help to distinguish portions of the market cycle when overvaluation is supported by speculative psychology from those where overvaluation is vulnerable to risk-averse collapses. The combination of valuations and market internals has capably navigated every market cycle in history, including the most recent one.
On that point, it’s helpful to understand that my stumble in the advancing half-cycle since 2009 did not reflect any difficulty with valuations or market internals, but instead resulted from my bearish response “overvalued, overbought, overbullish” syndromes, which had signaled a reliable “limit” to speculation in previous market cycles across history. In late-2017, we abandoned the idea that speculation still has definable “limits,” and became content simply to identify periods of speculation or risk-aversion, without presuming that there is a limit to either. We now require internals to deteriorate explicitly before adopting a negative market outlook. Sufficiently extreme conditions can warrant a neutral outlook, but we will not adopt or amplify a negative outlook unless we infer growing risk-aversion among investors, based on deterioration in our measures of market internals.
I’m sometimes asked why the period since January 2018 has been challenging for hedged-equity strategies, especially given our own late-2017 adaptation. The reason is that both global stocks and the broad market – particularly value stocks – have lagged capitalization-weighted market indices such as the S&P 500 Index (which are the most liquid instruments to hedge market risk). This gap largely reflects the exodus of investors into richly valued “glamour” growth stocks and “passive” investment strategies that favor popular cap-weighted market indices, with little consideration of price or valuation.
The tendency of value-oriented stocks to temporarily lag large-cap glamour stocks is a common feature of late-stage bull markets (we observed the same thing in late-2006 – see When Value Mavens Lag). One might attempt to “fix” this more recent difficulty of hedged equity strategies by holding richly valued glamour stocks, or hedging market risk using a basket of value stocks, but that response would be as short-sighted as buying at the top of a bubble in order to “fix” a defensive portfolio. We typically observe a positive difference in performance between value stocks and large-cap market indices during bear market periods, which can substantially benefit hedged-equity strategies.
Passive investing is a form of capitulation
Proposition: The exodus of investors into passive, conventional investment strategies is largely a form of capitulation and backward-looking performance chasing. It will end badly.
One of the most popular forms of bullish “capitulation” we observe these days is the bandwagon of investors making lump-sum shifts into “conventional” asset allocations, typically involving equity allocations of 60% or more. These shifts appear motivated by the desire to “correct the mistake” of being “too defensive,” largely based on the strong backward-looking performance of passive strategies. This is late-stage, bull market top behavior, akin to the tendency of investors to abandon stocks near bear market lows.
Valuation extremes like these are precisely where the distinction between past performance and future performance has the greatest bite.
Consider a zero coupon bond that promises a single $100 payment 20 years from today. If I buy it a 6% yield to maturity (price $31.18) and the yield to maturity drops to just 2% over the next 10 years (new price $82.03), I will have enjoyed a 10.16% annual return on that bond over the first 10-year holding period.
But that’s not a return I can extrapolate! The same bond, held to maturity, will only return 2% annually over the remaining 10 years. Indeed, 10.16% over the first 10 years and 2% over the second 10 years gets you an average return of 6% over the full 20 years. How ‘bout that?
Put simply, the long-term returns that investors can expect in the future are driven by the valuations they pay for their investments, at the time of their investment. When glorious past performance is driven by an advance to rich valuations, past performance is absolutely the last thing that investors should consider, except as a contrary indicator of future prospects.
The past performance that now entices investors into passive strategies was driven by an enormous advance in stock and bond market valuations, accompanied by an equally striking collapse in the long-term returns that are now embedded in those prices. These seemingly attractive past returns are the mirror image of the dismal future returns that those same investments are now likely to produce.
On a related note, we presently see some investors attempting to “dollar cost average” their portfolios into more conventional asset allocations, as a way of reducing their sensitivity to market valuations at any particular point in time. The problem is that they are trying to invest the entire lump sum over periods as short as 12 months. This is hardly better than investing everything at once. The whole point of dollar cost averaging is to allocate funds over a complete market cycle, covering a very wide range of market valuations. Instead, some investors are merely committing their entire life savings across the final top formation of a speculative market peak.
The impact of monetary policy on stocks depends on investor psychology
Proposition: When investors are inclined toward speculation, safe liquidity is an inferior asset, so it behaves as a hot potato that supports the stock market. When they are inclined toward risk-aversion, safe liquidity is a desirable asset, so creating more of the stuff doesn’t support stocks at all. Investors should evaluate the implications of monetary policy on stocks directly through the lens of market internals.
The belief that “easy money” means “rising market” is likely to be the undoing of many investors over the completion of this market cycle. Investors seem to forget that the Federal Reserve eased persistently and aggressively through the entire 2000-2002 and 2007-2009 market collapses.
I’ve been very open about my overreliance on “overvalued, overbought, overbullish” syndromes during the recent advance, and about our late-2017 adaptation, which prioritizes the condition of market internals, with no exceptions. Investors will make a tremendous error of their own over the completion of this cycle if they respond directly to monetary easing, rather than focusing on whether investors are inclined toward speculation or risk-aversion.
The chart below is a reminder of how all of this works (for more details, see Warning: Federal Reserve Easing Ahead). Each line shows the cumulative total return of the S&P 500, based on the status of monetary policy and market internals. Note that it is far better for the Fed to be tightening in an environment of favorable internals and speculative psychology than it is for the Fed to be easing in an environment of unfavorable internals and risk-averse psychology.
Indeed, the entire net gain of the S&P 500 from the 2007 peak to the most recent market peak in July occurred during periods when our measures of market internals were favorable, while nearly all of the 2007-2009 collapse occurred in periods when they were not.
Final notes
Some observers seem to imagine that I enjoy market collapses like 2000-2002 and 2007-2009, and that a 50-65% loss in the S&P 500, as I continue to expect over the completion of this cycle, would have me dancing. There’s no question that I’m most content when my analytical work proves to be correct and useful, but I would much rather observe conditions that would enable me to project strong, positive market returns. Those conditions will come – particularly when we observe a material retreat in valuations coupled with an improvement in market internals. Those conditions have emerged early in every market cycle in history. It’s just not the environment we have at present.
The truth is that I was distressed by the 2000-2002 and 2007-2009 collapses, because so many innocent investors were hurt. I don’t accept the idea that “it was their own fault” and “they should have known better” in a world where Wall Street feeds investors nothing but sugar and opium on a daily basis.
Trust that I am doubly distressed about my own admitted error in this advancing half-cycle. But understand that my error resulted from the departure of market behavior from a century of history. Our late-2017 adaptation eliminated that aspect of our investment discipline, while preserving the elements that allowed us to admirably navigate previous complete market cycles. In contrast, a 50-65% market loss over the completion of this cycle would be consistent with a century of history, given present valuation extremes, and investors remain fully vulnerable to the same downside risks they faced in 2000 and 2007.
The difficulty here is that every security that is issued must be held by someone until that security is retired. In aggregate, there’s no such thing as investors “getting into” or “getting out of” stocks, or cash, or anything else. Securities merely change hands. Buyers get the stock in return for cash. Sellers get the cash in return for stock.
So my intent isn’t to encourage investors to “sell.” That’s not even possible, in aggregate. My intent is to share evidence that I view as important, so that whether investors choose to embrace market risk or not, they do so with full information. I expect that my most resolute trolls will be among those who reject my work and carry overweighted allocations in stocks. I can’t say I’m terribly uncomfortable with that. Bull market or bear market, every share of stock must be held by someone.
Finally, my impression is that many investors are vastly overestimating their tolerance for risk. The argument that “well, the stock market might go down, but it always comes back” seems to be an increasingly popular way of dismissing risk entirely. Unfortunately, that argument only works on the way up to hypervaluation. It does not work on the way down.
I’ll emphasize again that the S&P 500 underperformed T-bills from May 1995 to March 2009, despite two intervening bubbles. It did the same from 1959-1982 and from 1929-1945. What these periods have in common is either overvaluation at the beginning or undervaluation at the end. I don’t know where valuations will be at the end your preferred holding period, but I can say with confidence that – on the measures we find best correlated with actual subsequent market returns across history – we’re at a point of hypervaluation here. Coupled with unfavorable market internals and emerging signs of a potential recession, consider your risk tolerance carefully.
Keep Me Informed
Please enter your email address to be notified of new content, including market commentary and special updates.
Thank you for your interest in the Hussman Funds.
100% Spam-free. No list sharing. No solicitations. Opt-out anytime with one click.
By submitting this form, you consent to receive news and commentary, at no cost, from Hussman Strategic Advisors, News & Commentary, Cincinnati OH, 45246. https://www.hussmanfunds.com. You can revoke your consent to receive emails at any time by clicking the unsubscribe link at the bottom of every email. Emails are serviced by Constant Contact.
The foregoing comments represent the general investment analysis and economic views of the Advisor, and are provided solely for the purpose of information, instruction and discourse.
Prospectuses for the Hussman Strategic Growth Fund, the Hussman Strategic Total Return Fund, the Hussman Strategic International Fund, and the Hussman Strategic Dividend Value Fund, as well as Fund reports and other information, are available by clicking “The Funds” menu button from any page of this website.
Estimates of prospective return and risk for equities, bonds, and other financial markets are forward-looking statements based the analysis and reasonable beliefs of Hussman Strategic Advisors. They are not a guarantee of future performance, and are not indicative of the prospective returns of any of the Hussman Funds. Actual returns may differ substantially from the estimates provided. Estimates of prospective long-term returns for the S&P 500 reflect our standard valuation methodology, focusing on the relationship between current market prices and earnings, dividends and other fundamentals, adjusted for variability over the economic cycle.