

Make Good Choices!


John P. Hussman, Ph.D.
President, Hussman Investment Trust
March 2020
Abrupt market weakness is generally the result of low risk premiums being pressed higher. The market currently exhibits neither favorable investment merit (based on valuations) nor favorable speculative merit (based on the quality of internal market action). The potential for a snap-back rally aside, we simply have no basis on which to accept an unhedged exposure to market risk.
John P. Hussman, Ph.D., July 30, 2007
There are two key drivers of investment returns. One is valuations, which provide a great deal of information about long-term investment prospects, and about the income component of total returns. The other is the uniformity or divergence of prices across thousands of individual securities, which helps to distinguish whether shorter-term investor psychology is inclined toward speculation or risk-aversion. Our disciplined approach to full-cycle investing is driven primarily by those two considerations, because together, they capture the central elements that define capital gains, income, and total return.
The menu of passive investment choices is now the worst in history
When market valuations are reasonable or depressed, investors can expect that their willingness to take risk will be compensated by a satisfactory “risk premium” over the long-term. Conversely, when market valuations are elevated or extreme, investors put themselves in a position where the long-term compensation for taking risk becomes very thin.
To offer some idea of how dismal the menu of investment prospects has become, the chart below shows our estimates of prospective 10-year investment returns across T-bills, Treasury bonds, Baa corporate bonds, utility stocks, and the S&P 500, for various points in time over recent decades. Each line shows a separate moment in history.
The highest line, in black, shows the menu of investment choices that passive investors faced at the August 1982 market low. The lowest line, in red, corresponds to the menu they face today. All of these estimates reflect our own investment methods, detailed in prior market commentaries, and all of them have a correlation of 0.89 or higher with actual subsequent market returns, based on decades of prior market cycles.
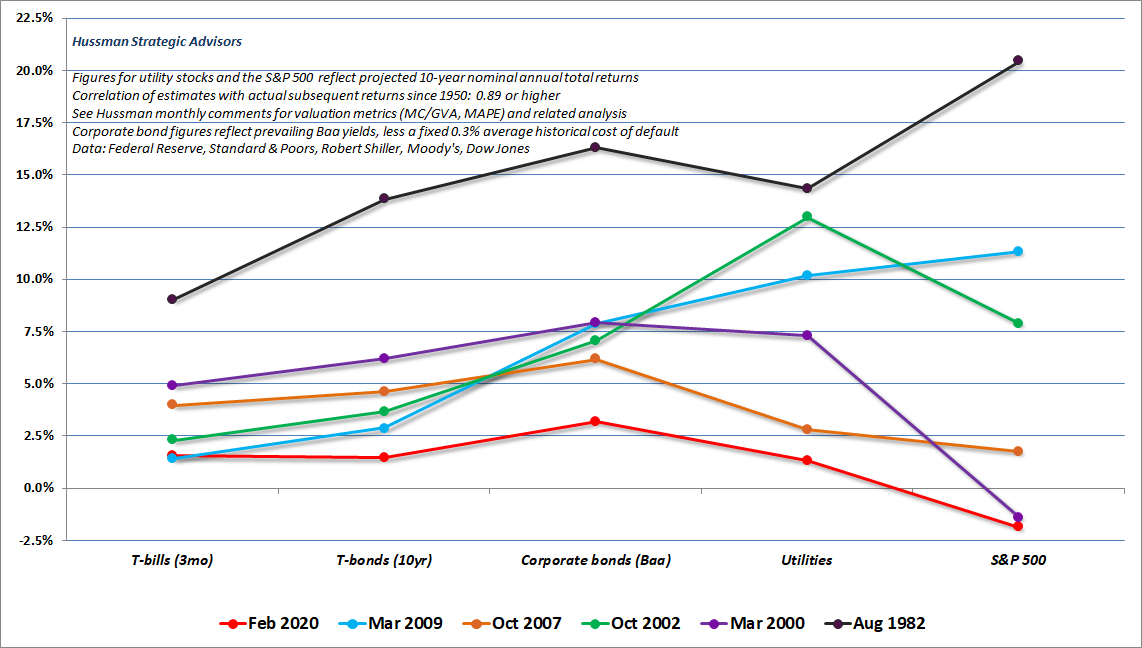
Notice that in 1982, both stocks and bonds were priced at valuations that implied enormous compensation for embracing risk. Indeed, those promising returns were actually realized over the following decade, with investors enjoying total returns of close to 20% annually in the S&P 500, and bond market investors enjoying total returns in the range of 12-15% annually.
You’ll also notice that across most of these profiles, a low level of interest rates was typically associated with a low level of expected returns for utility stocks and the S&P 500. In that sense, one could say that the low interest rates “justified” elevated stock valuations. But that so-called “justification” did nothing – nothing – to prevent the collapses that followed those elevated stock valuations. It also did nothing to prevent the low subsequent investment returns on stocks that were baked in the cake by virtue of elevated valuations.
Look closely at the red line, which shows the current menu of investment prospects. The menu of estimated prospective returns available to passive, long-term investors is easily the worst in history. This is the consequence that years of Fed-induced yield-seeking speculation have produced.
For the S&P 500, our estimate of likely 10-year nominal total return is actually negative here (as it was, correctly, at the 2000 market peak). The claim that stocks, at current valuation extremes, offer a satisfactory – or even positive – “risk premium” over Treasury bonds rests on valuation measures that have little correlation with actual subsequent market returns across history.
People are reaching for yield. There’s no question about that. And that’s stupid, and it has consequences over time. But it’s very human.
– Warren Buffett, CNBC, February 24 2020
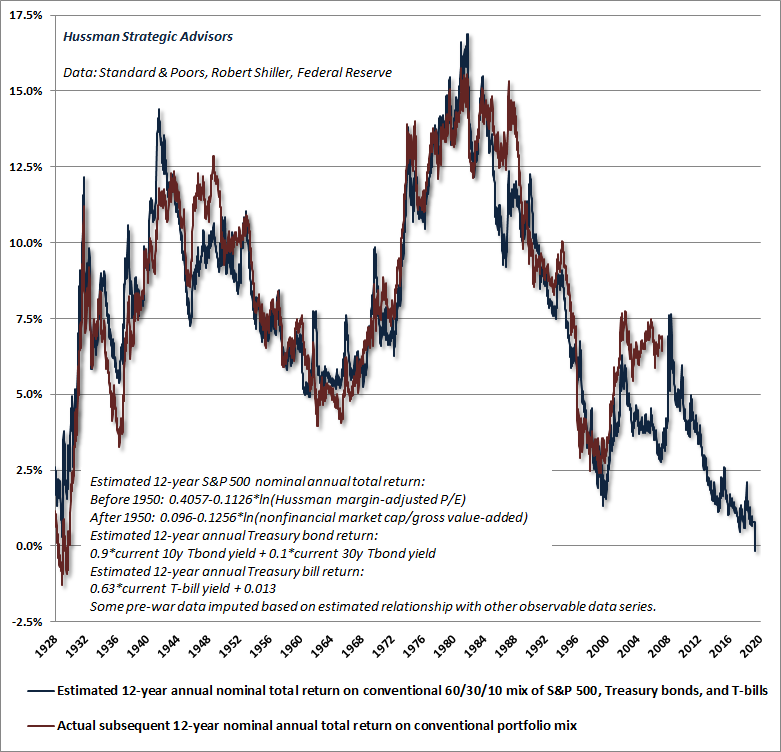
The chart below shows what this menu means for the likely returns of passive investors. Last month, our estimate of prospective 12-year total returns on a conventional passive investment portfolio (invested 60% in the S&P 500, 30% in Treasury bonds, and 10% in Treasury bills) fell below zero for the first time in history. The recent low of -0.16% even lower than the level of 0.34% reached at the market extreme of August 1929.
Across a century of market cycles, the most favorable environments to invest are invariably when market valuations retreat to reasonable or depressed levels, providing a long “runway” for the market to advance for years or decades, while a shift to favorable uniformity across market internals suggests that investors are inclined to speculate and embrace risk.
Likewise, the most hostile environments to invest are invariably when market valuations advance to extreme or hypervalued levels, creating dismal prospects for long-term returns, while a shift to divergent price behavior across market internals suggests that investors are inclined toward skittishness and risk-aversion.
Amidst an “everything bubble” driven by yield-seeking speculation across nearly every asset class, I do not believe that investors should imagine that there is some widely appropriate passive investment that promises a satisfactory return despite such broad extremes. Even international stocks tend to lose significant value when U.S. stocks decline, regardless of their valuations. Certain sectors may be useful for diversification – precious metals shares, for example – but even when investment conditions are favorable for these sectors, their volatility makes them inappropriate as the cornerstone of an investment strategy.
As I noted in January, the primary “alternative” that investors have here, in my view, is cash, patience, and hedged investment exposure. Nothing demands that investors “lock in” the lowest investment prospects in U.S. history. The alternative that investors have is flexibility. The alternative they have is the capacity to imagine a complete market cycle. The alternative investors have is discipline – the willingness to lean away from risk when the market is richly valued and unsupported by uniformly favorable internals, and to lean toward risk when a material retreat in valuations is joined by an improvement in the uniformity of market internals. I have every expectation that we will observe such opportunities over the completion of this cycle.
A market crash is simply a low risk-premium spiking higher
When speculation drives prices to hypervalued extremes and likely risk-premiums to zero – or worse – investors face an additional problem. A market crash is simply a low risk-premium spiking higher. That’s not hyperbole, and it’s not a market call. It’s just a fact.
As I’ve noted in previous market cycles, every market crash is always driven first and foremost by a spike in risk premiums. During the 2000-2002 market collapse, I wrote: “Remember that favorable trend uniformity is essentially a signal that investors have a robust preference for taking risk. Right now, there is no evidence of the sort. In a market with razor thin risk premiums, any increase in risk aversion can lead to spectacular price declines.”
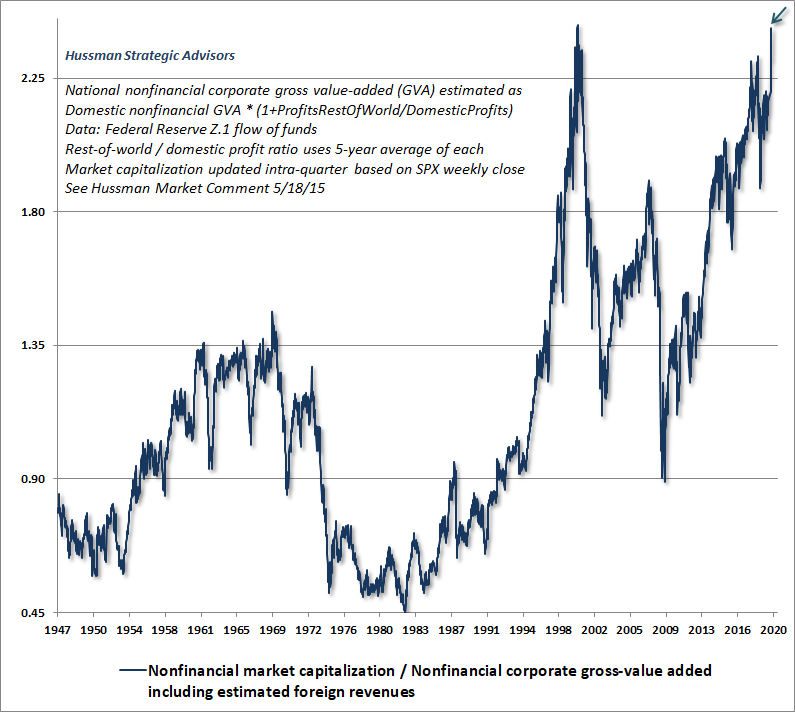
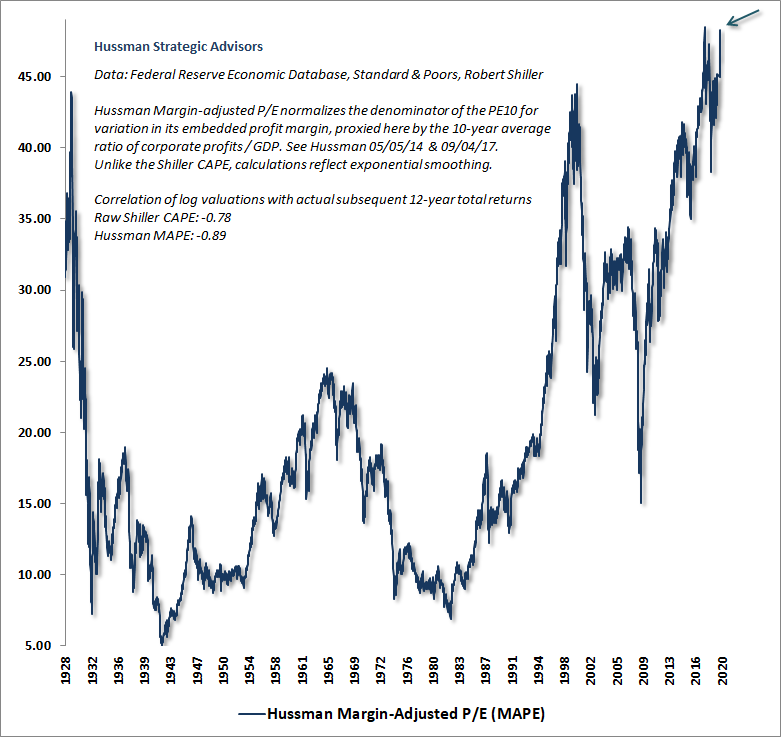
The following charts show two of the most reliable market valuation measures that we’ve studied or introduced over time. Both are better-correlated with actual subsequent stock market returns across history than numerous alternatives, including price/forward-earnings, the Shiller cyclically-adjusted P/E (CAPE), and the so-called Fed Model, among others.
The first chart below shows the ratio of nonfinancial market capitalization to corporate gross value-added, including estimated foreign revenues. I introduced this valuation measure in 2015, and it remains the measure that we find best-correlated with actual subsequent market returns across history. In recent weeks, this measure has moved to extremes implying negative estimated total returns for the S&P 500 on both 10-year and 12-year horizons.
The menu of investment prospects for passive, long-term investors is now the worst in history. When speculation drives prices to hypervalued extremes and likely risk-premiums to zero – or worse – investors face an additional problem. A market crash is simply a low risk-premium spiking higher. That’s not hyperbole, and it’s not a market call. It’s just a fact.
Our Margin-Adjusted P/E (MAPE) is nearly as reliable as MarketCap/GVA and spans a much longer history to the early-1900’s. Notably, this measure has moved to extremes that eclipse both peaks observed in 1929 and 2000.
The greatest market losses generally emerge in periods where risk premiums are very low, and are being pressed higher. Indeed, from a valuation perspective, a market crash is nothing but a spike in the risk-premium that’s embedded into stock prices.
– John P. Hussman, Ph.D., October 2019
Do valuations still “work”?
Investors sometimes assume that if the market continues to advance despite rich valuations, then the valuation measures must somehow be incorrect. That’s not how valuations work. If overvaluation itself was enough to drive prices lower, one could never observe extremes like 1929, 2000, and today, because the market would have been weighed down by far lesser extremes.
Indeed, it is a hallmark of financial bubbles that actual market returns in the years preceding the speculative peak tend to be higher than the returns that investors would have expected, based on typical historical relationships between valuations and subsequent returns. At speculative extremes, past returns appear magnificent in hindsight. While the advance to extreme valuations can encourage investors to abandon any concern about risk, these episodes have historically proved to be disastrously temporary.
The chart below provides a reminder of the ultimately temporary “errors” that emerge occurs in periods that end in extreme valuations. In particular, note 12-year periods ending in 2000, 2007, and today. This is a common feature of speculative extremes, yet it’s precisely what leads investors to abandon the information provided by valuations exactly when they are giving the loudest warnings.
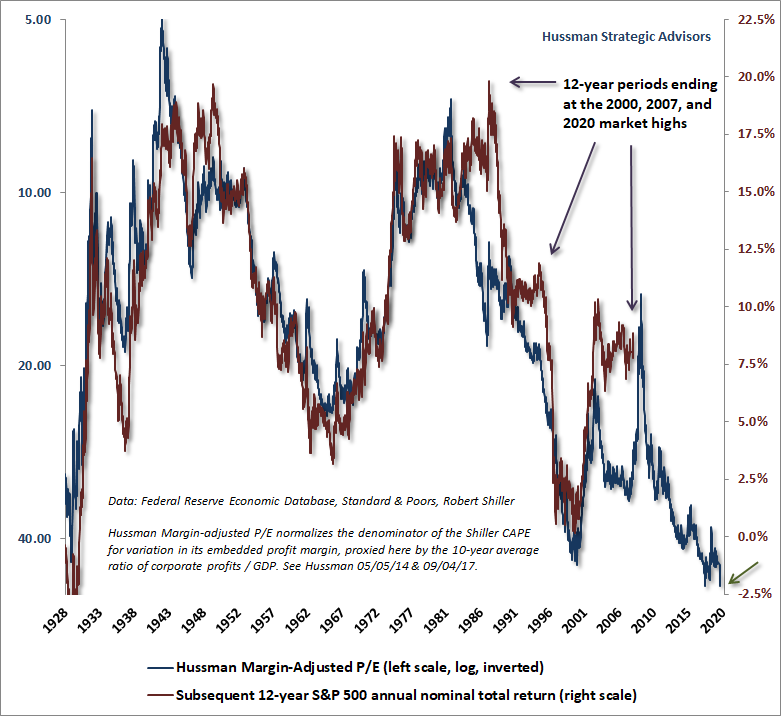
Notice, for example, that actual S&P 500 returns for the 12-year period following 1988 were higher than those implied by 1988 valuations, precisely because valuations in 2000, at the end of that 12-year period, were so extreme. Similarly, the actual returns of the S&P 500 the most recent 12-year period have been higher than those implied by early-2008 valuations, precisely because current valuations are so extreme.
Across history, and even in recent cycles, market valuations have remained extremely informative about long-term market returns on a 10-12 year horizon, as well as potential market losses over the completion of a given market cycle.
At the same time, however, market returns over shorter segments of the market cycle are driven by the psychology of investors – specifically, their inclination toward speculation or risk-aversion. For our part, the best measure we’ve identified to gauge that psychology is the “uniformity” of market internals. We draw that signal from the collective behavior of thousands of individual stocks, industries, sectors, and security types, including debt securities of varying creditworthiness. The central idea behind our measure of market internals, which I first introduced in 1998, is that when investors are inclined to speculate, they tend to be indiscriminate about it.
Investors sometimes assume that if the market continues to advance despite rich valuations, then the valuation measures must somehow be incorrect. That’s not how valuations work. If overvaluation itself was enough to drive prices lower, one could never observe extremes like 1929, 2000, and today, because the market would have been weighed down by far lesser extremes. Valuations are informative about long-term market returns on a 10-12 year horizon, as well as potential market losses over the completion of a given market cycle. At the same time, however, market returns over shorter segments of the market cycle are driven by the psychology of investors – specifically, their inclination toward speculation or risk-aversion. For our part, the best measure we’ve identified to gauge that psychology is the “uniformity” of market internals.
The chart below shows the cumulative total return of the S&P 500 in periods where our measures of market internals have been favorable, accruing Treasury bill interest otherwise. The chart is historical, does not represent any investment portfolio, does not reflect valuations or other features of our investment approach, and is not an assurance of future outcomes.
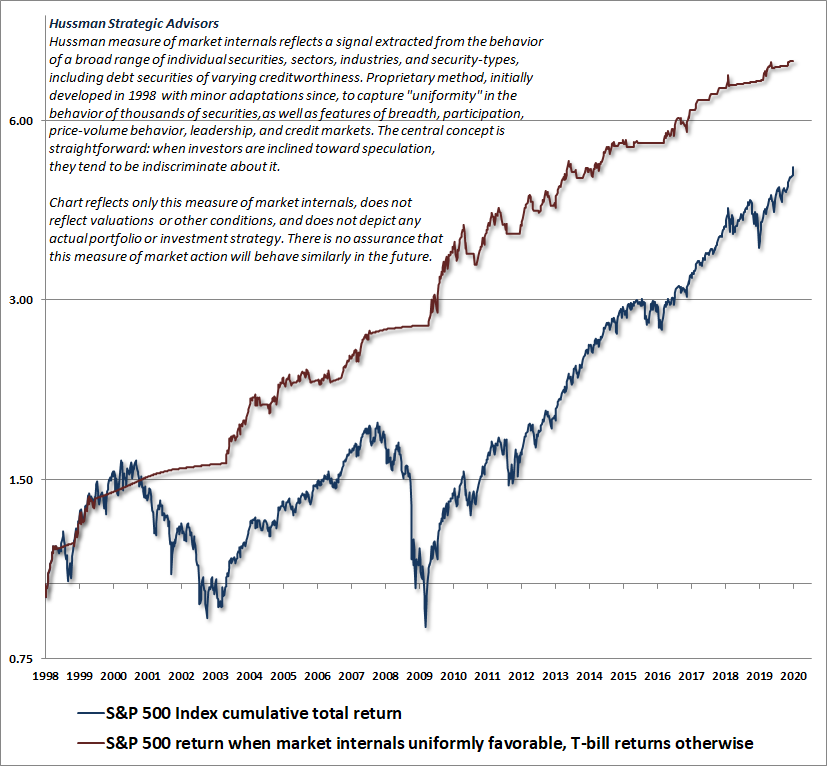
Probably the most striking feature of the period since late-2017 is that except for a few brief whipsaws, market internals have failed to recruit the sort of “internal uniformity” that typically defines robust speculation. Instead, we continue to observe the sort of tepid participation and internal divergence that was characteristic of the final advances of the 2000 tech bubble and the 2007 mortgage bubble.
How this time was “different”
The question that investors should ask themselves, very reasonably, is why recent years have been challenging for our investment discipline given that the combination of valuations and market internals has performed admirably even during the most recent market cycle. This is exactly the right question, because understanding my admitted error in recent years will spare you the consequences of incorrectly concluding that valuations and market internals no longer matter.
The problem was this: our reliance on historically reliable “limits” to speculation, which ultimately exerted no limits at all. We’ve adapted to that.
Recall the late-2017 change in our investment discipline. Our central difficulty during the advancing half-cycle since 2009 related to our pre-emptive bearish response to “overvalued, overbought, overbullish” syndromes, which had signaled a reliable “limit” to speculation in previous market cycles across history. Because of that reliability, we had prioritized those syndromes following our 2009-2010 stress-testing exercise against Depression-era data. Amid the novelty of zero-interest rate policies, the yield-seeking speculation of investors obeyed no such “limits” at all.
In late-2017, we abandoned our willingness to adopt a bearish outlook unless our measures of internals have explicitly deteriorated. Some conditions may be extreme enough to justify a neutral outlook, but a bearish outlook requires deterioration in internals. As of early-February 2020, these measures of internals remain unfavorable.
It’s worth highlighting that both valuations and internals have performed admirably in the recent market cycle. Indeed, as I observed in real-time, our valuation measures properly identified the S&P 500 as undervalued at the late-2008 and 2009 market lows. Meanwhile, the entire total return of the S&P 500 during the complete market cycle from the 2007 peak to the recent market highs has accumulated during periods when our measures of market internals were favorable, while the majority of the 2007-2009 market collapse, as well as substantial corrections since 2009, have occurred when those measures were unfavorable.
In short, it was my reliance on historically-reliable overvalued, overbought, overbullish “limits,” following our 2009-2010 stress-testing exercise against Depression-era data, that proved detrimental in recent years. We prioritized the condition of market internals in late-2017.
The remaining headwind we’ve experienced since late-2017 has been a much more conventional and impermanent feature of late-stage speculative bubbles. As speculation becomes focused on an increasingly narrow set of speculative “shooters” and large-capitalization “glamour” stocks, the final advance of a bubble often features a temporary period of broad-market underperformance, particularly among value-oriented stocks.
As I noted in my January comment, One Tier and Rubble Down Below, recent market action has featured internal dispersion reminiscent of the “Nifty Fifty” mania, with speculators favoring richly valued glamour stocks and the largest components of passive indices, rather than broad value-conscious stock selection. According to Morgan Stanley, just 38% of the stocks in the S&P 500 have outperformed the index itself over the past six months – the lowest percentage in at least 15 years. The only other time this total fell below 40% was at the October 2007 pre-collapse peak.
This dispersion has contributed to the negative condition of our measures of market internals, and is particularly unfavorable for the stock market given current valuation extremes. Meanwhile, at least temporarily, it has also been a headwind for hedged-equity investment strategies.
I’ve said this before, but it’s essential to understand this point: We do not need to rule out the possibility that “this time is different” in a positive way. Our assertion is instead that nearly all of the factors that might make this time “different” are likely to exert their effect through price behavior, and specifically, through the uniformity or divergence of market internals. We have the ability to monitor and respond to that directly.
Public health notes
Apart from counting the novel coronavirus as one of the many factors that could prompt an episode of risk-aversion, I prefer to avoid discussing the financial aspects of a public-health crisis. Suffice it to say that market valuations are extreme and risk-premiums are more compressed than at any other point in U.S. history. It’s misguided to imagine that the extraordinary full-cycle market risk that is already baked in the cake would somehow go away if coronavirus was to abate (which is my hope).
I continue to expect the S&P 500 to lose about two-thirds of its value over the coming years. Avoiding profound market losses over the completion of this cycle would require a permanently high plateau in valuations, at their present hypervalued extremes, and the absence of even one episode of significant risk-aversion in the future.
That said, a few observations regarding the public health implications surrounding the novel coronavirus may be helpful (see some of my research papers, this article in Nature for example, to assure yourself that I’m not shooting wildly from the hip).
As I noted last month, two of the features worth monitoring are the 5-day compound growth rate of reported cases, both in China and elsewhere, as well as the mortality rate of nCov-19.
Here, it’s important to recognize that ascertainment remains an issue, as the number of actual cases is estimated to exceed the number of reported cases by a factor ranging from 10x (Johns Hopkins CSSE) to 38x (Wu, et. al., Lancet, 2020). The hopeful aspect of this is that unreported cases are also likely to be less severe. Likewise, since the reporting of actual fatalities is likely to be more accurate than the reporting of cases, the ratio of fatalities/actual cases is also likely to be much smaller than the current 3.3% figure based on fatalities/reported cases. Still, the increase in the “reported” ratio from 2.1% in early February to 3.3% today underscores that the public health risk should be taken seriously.
Probably the most important aspect of nCov-19 is its relatively high reproductive rate R0, estimated to be about 2.6. That figure represents the average number of people that contract the virus through contact with someone who already has it. By comparison, the R0 value for seasonal flu is only about half that rate. Likewise, although the seasonal flu affects vastly more people (at present), it also has a far lower mortality rate, closer to 0.1%. The seasonal flu produces so many fatalities primarily because it emerges in constantly varying strains, each which tends to be poorly contained.
To put R0 into perspective, in order for the number of cases to stabilize, approximately 1-1/2.6 = 62% of potential contacts (I prefer not to use “herd”) must either be immune or contained once a new transmission “hub” emerges. That’s why containment efforts need to be taken so seriously.
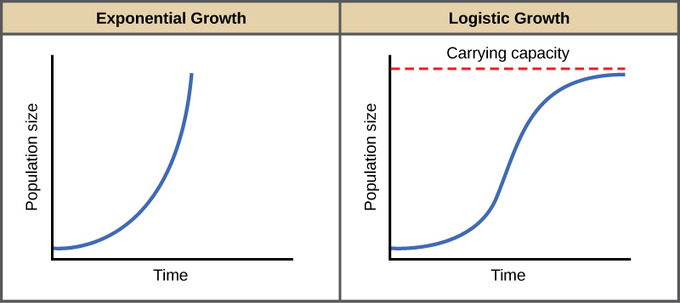
Provided that containment efforts are strong, the total number of cases can be expected to follow a “logistic” growth trajectory, where the growth rate of new cases progressively declines toward zero as the total number of cases stabilizes. Without strong containment, the total number of cases would follow an “exponential” growth trajectory more closely.
My impression is that, in practice, we may observe a mixture – logistic growth in areas that are (or quickly become) well-contained, but exponential growth in smaller hubs. That kind of mixture would produce a sort of stop-start profile in total global cases, where the total number of cases stabilizes, then takes off again for a period of time.
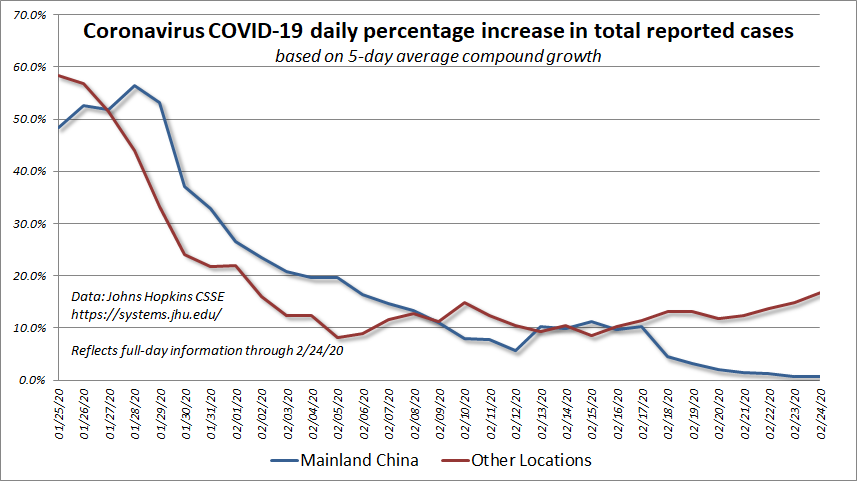
The chart below is based on data from Johns Hopkins CSSE (with great admiration for the work of Lauren Gardner and her team), and reflects the 5-day compound growth rate of cases both in China and elsewhere. Note that early on, we observed extremely high growth rates on the order of a 50% daily increase in total reported cases. Since then, evidently due to strong containment efforts, we’ve observed a gradual decline in the growth rate of cases in China. Not quite zero, but getting there. I recognize that many people view the data from China with suspicion. I have no insight that would lean my views strongly in that direction, other than recognizing that accurate ascertainment is almost surely an issue both in China and elsewhere. My impression is that the figures we’re seeing out of China may be limited to the areas where strong monitoring efforts are actually taking place.
The next chart shows the total number of cases in China and elsewhere, on log scale (each vertical segment represents a doubling of cases) but with cases abroad starting from a significantly smaller base. Notice that total cases in China appear to be stabilizing, but cases abroad, at least at present, have continued to grow at a constant, and even slightly accelerating rate.
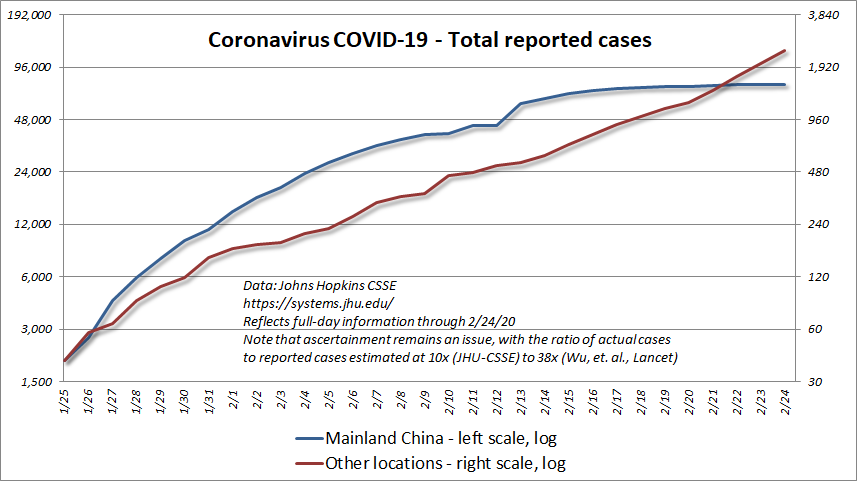
At present, all of this is just informational, and ideally it will stay that way. In any event, if you find yourself in or near a “node” of new cases, my hope is that you will take containment efforts seriously, however inconvenient they may be. Based on predicted transmission hubs, it’s not unreasonable to maintain strong monitoring efforts in New York, Houston, Washington D.C., and Honolulu. Without widespread immunity or vaccines, it’s those containment efforts that allow the growth process to go from exponential to logistic.
Logistic growth and glamour stocks
Ok – back to the financial markets. While we can leave nCov-19 out of the discussion, the distinction between logistic growth and exponential growth is also enormously relevant on its own.
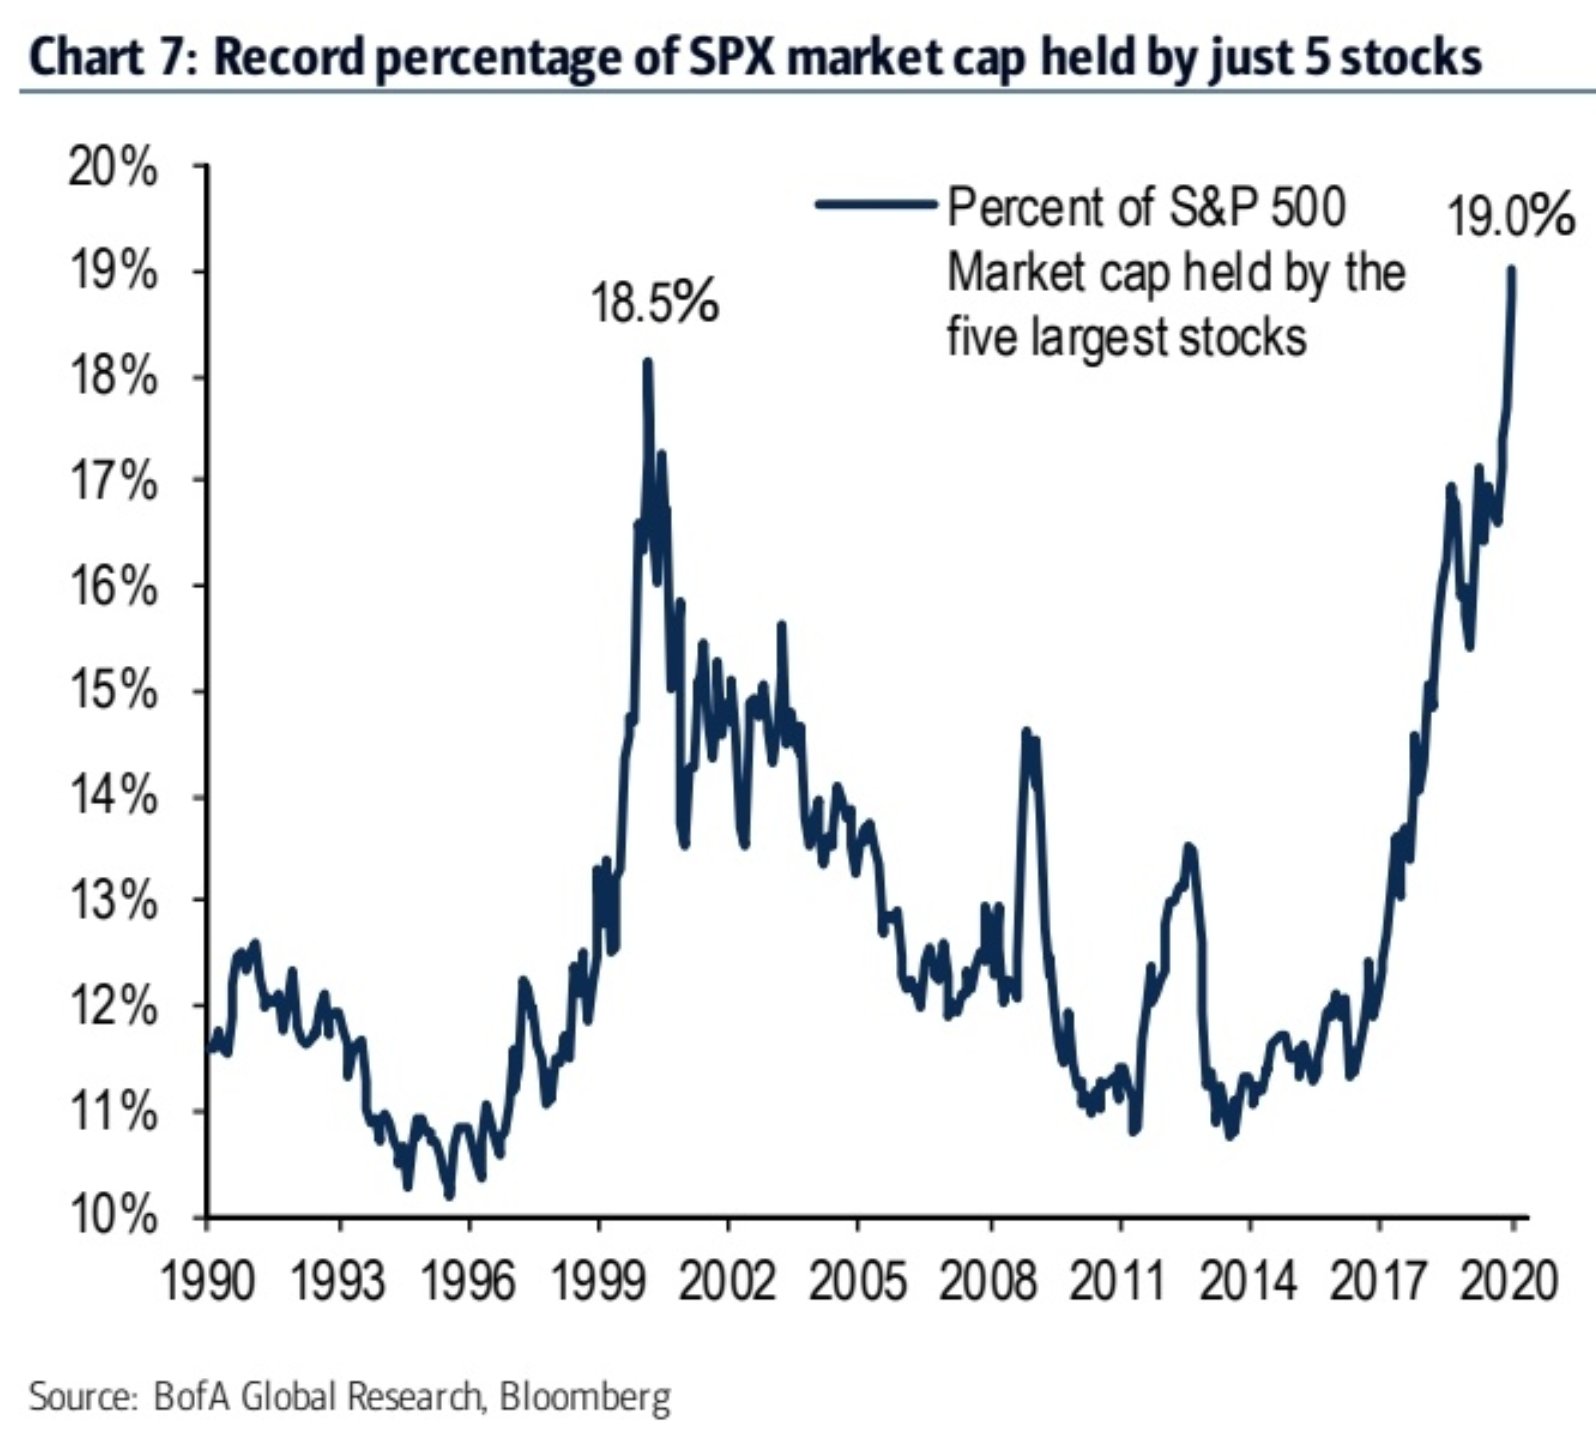
The following chart is from BofA Global Research (h/t Teddy Vallee). In recent weeks, the combined market capitalization of the largest 5 U.S. companies has reached 19% of the S&P 500 Index, exceeding the previous record of 18.5% at the height of the tech bubble. These include Microsoft, Apple, Amazon, Facebook, and Alphabet (formerly Google). As in 2000, investors are exuberant about the “exponential growth” of these companies.
But recall the feature that distinguishes exponential growth from logistic growth. Exponential growth doesn’t “saturate.” Instead, the growth rate remains relatively constant even as size increases. In contrast, the hallmark of logistic growth is that the rate of growth declines as size increases toward its “carrying capacity.”
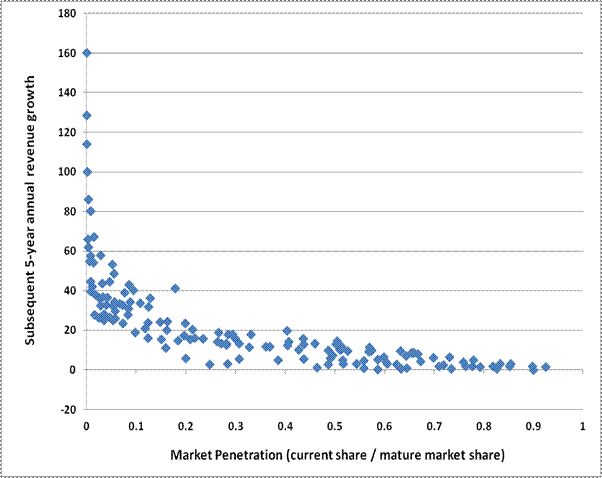
To offer an idea of how this works, the chart below is one I published years ago, showing the revenue growth rates of Microsoft, Cisco, Intel, Oracle, IBM, Dell, and one non-tech stock, Wal-Mart, all which were among the speculative darlings at the peak of the 2000 bubble. The basic concept here is that while growth rates can be extraordinarily high as disruptive companies expand from a small base, those growth companies ultimately become large and mature. As they do, their growth rates slow dramatically, toward the growth rate of the overall economy (and sometimes, toward zero).
Investors might imagine that today’s glamour stocks are somehow different. The data suggest that they are not. Among the largest capitalization stocks in the S&P 500, we observe clear hallmarks of logistic growth: as the companies have expanded toward maturity, their growth rates have progressively eroded. Indeed, the 5-year revenue growth rates of both Apple and Microsoft have declined to just 5-8%.
The chart below shows how 2-year revenue growth rates of today’s most embraced glamour stocks have gradually eased. Each data point is one calendar quarter. While Apple is the furthest along the trajectory to zero growth, the others are likely to reach similarly conventional growth rates over the next few years as well.
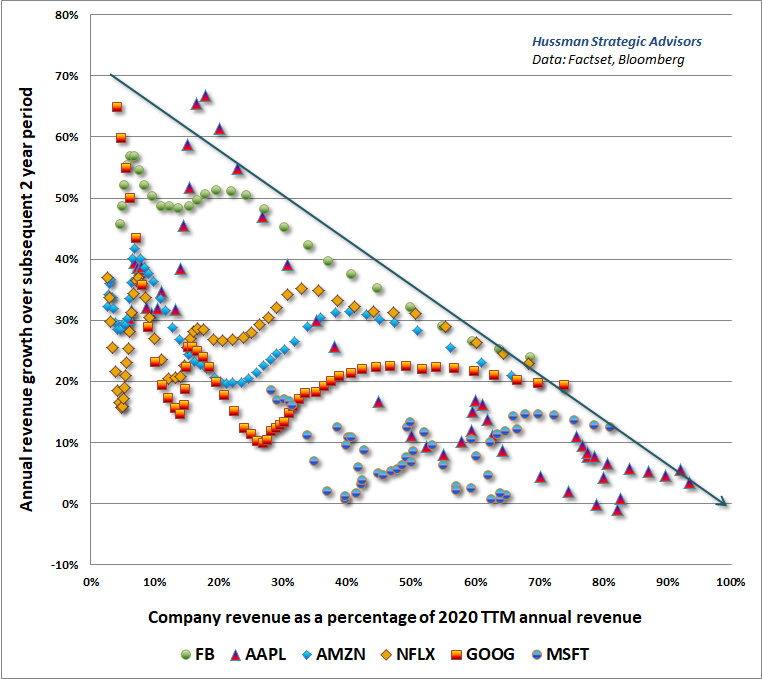
As in 2000, the extreme valuations being placed on glamour growth stocks suggests that investors are overlooking the actual, slowing logistic growth of these companies, and instead assuming that their growth will be exponential, sustained, and unlimited. The disappointment is likely to be substantial.
Keep Me Informed
Please enter your email address to be notified of new content, including market commentary and special updates.
Thank you for your interest in the Hussman Funds.
100% Spam-free. No list sharing. No solicitations. Opt-out anytime with one click.
By submitting this form, you consent to receive news and commentary, at no cost, from Hussman Strategic Advisors, News & Commentary, Cincinnati OH, 45246. https://www.hussmanfunds.com. You can revoke your consent to receive emails at any time by clicking the unsubscribe link at the bottom of every email. Emails are serviced by Constant Contact.
The foregoing comments represent the general investment analysis and economic views of the Advisor, and are provided solely for the purpose of information, instruction and discourse.
Prospectuses for the Hussman Strategic Growth Fund, the Hussman Strategic Total Return Fund, the Hussman Strategic International Fund, and the Hussman Strategic Allocation Fund, as well as Fund reports and other information, are available by clicking “The Funds” menu button from any page of this website.
Estimates of prospective return and risk for equities, bonds, and other financial markets are forward-looking statements based the analysis and reasonable beliefs of Hussman Strategic Advisors. They are not a guarantee of future performance, and are not indicative of the prospective returns of any of the Hussman Funds. Actual returns may differ substantially from the estimates provided. Estimates of prospective long-term returns for the S&P 500 reflect our standard valuation methodology, focusing on the relationship between current market prices and earnings, dividends and other fundamentals, adjusted for variability over the economic cycle.