

Avoiding a Second Wave


John P. Hussman, Ph.D.
President, Hussman Investment Trust
August 2020
Owing to the lack of effective therapeutics or vaccines, the best measures to control human coronaviruses remain a strong public health surveillance system coupled with rapid diagnostic testing and quarantine when necessary. For international outbreaks, cooperation of governmental entities, public health authorities and health care providers is critical.
– Fehr & Perlman, Methods in Molecular Biology, 2015
Why containment is so important: This will become clearer in a matter of weeks, but given the reproductive rate of COVID-19, the only alternative to immunity is reduction by ~62% in the number of person-person contacts.
– John P. Hussman, Ph.D., Feb 28, 2020, 16 U.S. cases, 0 fatalities
We’ve lost 100,000 Americans running a 5th grade science experiment to learn what science already knew.
– John P. Hussman, Ph.D., May 27, 2020
Quick note – I’m happy to share that my paper Cellular and Molecular Mechanisms of COVID-19, and Potential Points of Therapeutic Intervention has been published in Frontiers in Pharmacology, the most-cited, peer-reviewed, open-access journal in the field. Emphatically, the paper is investigational, not prescriptive. It’s something of a beast, and it reflects an enormous labor of love. Most of my scientific publications and collaborations are in autism, neuroscience, statistical genetics, and molecular pathway analysis. I’m good at that, but I’ll emphasize that I’m a researcher, not a physician.
Please feel free to share the paper with physicians or researchers involved in the response to this epidemic. My hope is that it will contribute to their thinking about the mechanisms, rationale, and timing of various potential interventions.
Public health note
The way to create a second wave of an epidemic is to relax containment practices while there is still a large pool of active, infective cases.
About two-thirds of this month’s comment is about COVID-19 and the risk of a second wave. This is not only for the sake of public health, which would be enough, and not only to contribute to a better understanding of the epidemic. It’s also because there’s a growing likelihood that the remainder of the year – if we’re not careful – could bring far larger disruptions than most people seem to envision, and far greater risks than the pain-killing opiates of the Federal Reserve have allowed investors to perceive.
Heads up. I’m going to let my geek flag fly a bit here, because there’s an enormous amount of misinformation (and disinformation) circulating. You know my view on noise reduction: you get more reliable information by drawing on common signals from a wide range of independent sensors. My views reflect my best understanding of hundreds of studies and research papers on all this. Some of my views may prove incorrect, so I do read contradictory findings. But when someone claims that all of the scientific and clinical findings are wrong, the evidence should be compelling, and it should be possible for other researchers to corroborate the new hypothesis. For those who disagree with my perspectives, look, nobody is forcing anyone to read this. Hey, grab a comic book or watch a conspiracy video.
Shrink the pool
In finance and economics, we’re used to talking about “multipliers.” If you hate math, please just scan past the arithmetic, but stick with me here. The key points are well worth it.
The basic multiplier argument goes something like this: if I spend $1 of income, and the next person spends a fraction “c” of that income, and the next person spends a fraction “c” of their income, then $1 of initial spending will produce a series of subsequent spending:
1 + c + c^2 + c^3 + …
The whole series converges to 1/(1-c). So if everyone spends three-quarters of their income, c is 0.75, and we get a “multiplier” of 1/(1-.75) = 4. That $1 of initial spending leads to $4 of total spending. Yay. Of course, there are a lot of conditions, like preferences, whether people see the added income as permanent, whether new production can be drawn into existence and so forth, but if you’ve taken Economics 101, you’ve seen that basic arithmetic.
The following discussion is intended to offer some intuition into why containment behaviors matter in stopping an epidemic. I haven’t seen this particular arithmetic elsewhere, so an epidemiologist or two may yell at me that I haven’t used differential equations, but this will give you the intuition.
Suppose someone has COVID-19. Let’s start by assuming that each infected person comes in contact with only one other person; and that the probability of transmitting the disease to a given contact is p. Then including the original infected person, the total number of people infected will be:
1 + p + p^2 + p^3 + …
As long as p is less than 1.0, this sum converges to 1/(1-p).
Now let’s scale this result up. Assuming that an infected person encounters an average of N people a day, and that the duration of the infective period is D days, each person infected by the virus will go on to infect, on average, N*D*p additional people. That’s what’s called the “base reproductive rate” or R0. If that number is greater than 1.0, the spread of the virus becomes exponential.
So for example, if the probability of infecting a contact is 10%, and an infected person comes in close contact with an average of 4 people a day, and remains infective for 7 days, each infected person will infect an average of R0 = 4*7*0.10 = 2.8 additional people.
In a world where all people are initially susceptible, that’s what we call “R0” – the “basic reproductive rate.” It’s determined by the infectivity of the disease p, the average number of contacts N, and the duration of infectivity D.
Fortunately, there are effective ways of slowing or stopping an epidemic, and we can literally read them right out of the arithmetic:
- Reduce the probability that contact with an infected person will transmit the disease, which is where the use of face masks in shared indoor public airspace is critical, along with increased person-to-person distance, shorter interactions, and hygiene like hand washing and disinfecting common touchpoints;
- Reduce the number of contacts and social interactions, particularly involving “superspreading” events where one infected person can come into contact with lots of uninfected people, and “hub” locations where previously isolated groups of people come together and mix;
- Reduce the duration of infectivity, by quickly isolating new cases and tracing their recent contacts, in order to prevent transmission to additional people.
Of course, as more and more people have the disease, the pool of susceptible people will decline, so the rate of infection will slow. Consider this. If the whole population is vulnerable, each infected person transmits the disease to an average of R0 other people (2.8 in our example). But suppose we reduce the pool of susceptible people to 1/R0 of the population (36% in our example). Then each newly infected person will infect not R0 people, but R0 x 1/R0 = one additional person. At that point, 1–1/R0 of the population (64% in our example) would already be infected, and that defines what’s called “herd immunity.” Now, that’s not enough to stop the disease entirely, but it’s enough to stop it from growing exponentially.
By the way, the reason I’ve picked these particular numbers is that they’re consistent with estimates of R0 for COVID-19.
One of the arguments that you’ll often hear is “well, if there’s no vaccine, then everyone is going to eventually get COVID-19.” That’s not correct. It might be nearly correct if people abandon containment measures, testing, isolation, and contact tracing. But if we can substantially reduce the pool of infective people, scale back containment behaviors only when and where we have been successful, and then use strong testing and contact-tracing measures when new pockets of infection do break out, there’s nothing that “requires” us to get to herd immunity.
What you’re trying to do is to immediately impose a very high level of containment around new outbreaks. If you can do that, you don’t need to impose stringent containment on the whole population. The failure to act quickly and contain new outbreaks through testing, isolation and contact-tracing is what forces population-level containment later. That’s exactly what happened here in the U.S.
Please understand this. The notion of herd immunity for COVID-19 is an absolute nightmare. We’ve already had over 150,000 U.S. fatalities, and based on a variety of models and methods that tightly explain the relationship between case growth, test positivity, and fatalities, the most likely number of Americans that have been infected is presently somewhere in the range of 15-30 million. That would put the likely number of U.S. fatalities at “herd immunity” somewhere between 1-2 million. Again, that’s not where fatalities would stop – it’s just where the reproductive rate Rt would drop below 1.0 in the absence of containment measures. My hope is that we wake up, and collectively use containment measures strong enough to drive Rt below 1.0 without insisting on genocidal outcomes first.
We can immediately see how to slow down an epidemic: reduce the probability that contact with an infected person will transmit the disease; reduce the number of contacts and social interactions, particularly involving ‘superspreading’ events; and reduce the duration of infectivity, by quickly isolating new cases and tracing their contacts.
We know from large-scale testing and multiple studies involving both symptomatic and asymptomatic people that roughly 45-50% of people with COVID-19 do not exhibit symptoms, yet have similar viral loads and infectivity. Even so, these studies indicate that roughly half of asymptomatic adult cases still show some level of inflammatory lung damage, typically “ground glass opacities” that are consistent with injury to alveolar cells (the “air sacs” of the lung). That may be why some people say “I feel fine,” but when you check their oxygen saturation, it’s down to 85%. Will it heal? Hopefully, but it’s a concern.
While asymptomatic carriers do complicate containment efforts, they’re a major problem only if the rest of the population is behaving like idiots (thankfully, that’s only true for a subset of ours). Once containment shrinks the pool of infective cases, yes, you might miss an asymptomatic carrier, but as soon as you’ve got even a few infected individuals, it’s likely that at least one of them will show symptoms. A combination of isolation, testing, contact tracing, and locally enhanced containment measures can address the pocket before it gets out of hand. The early failure to do this is exactly what predictably made this epidemic a slow-motion train wreck.
Without an effective vaccine, one of the most important priorities should be increasing the speed of testing. Presently, many people have to wait one or even two weeks for test results, which dramatically weakens their usefulness for containment. See, even if we brought the number of active U.S. cases down to just 100 and simply opened up, we’d be in exactly the same place we were at the beginning of March.
In order to contain the spread of the virus, you don’t need herd immunity, and you don’t need lockdown and isolation everywhere, but you absolutely do need to immediately impose a high level of containment for newly infected individuals, and to quickly test and trace their recent contacts. Without that ability, the best we can do is to push a major second wave into the future.
I’ll repeat that SARS-CoV-2 is not an influenza virus, and while certain coronavirus strains can cause the common cold, COVID-19 is not the common cold. This virus has features that alter the immune system in ways that reduce the defenses of airway cells (particularly interferon response), and can trigger an inflammatory cascade that can lead to severe acute respiratory distress, degradation of blood vessel linings, tissue damage, and death.
Cases that remain asymptomatic are estimated to have the same communicable period (~10 days) as symptomatic cases. Perhaps not surprisingly, cases that are asymptomatic at the time of testing, and then go on to produce symptoms (“pre-symptomatic” cases), have a longer communicable period (~14 days). Viral load is reported to be similar across groups. While “shedding” of viral particles has been observed even 28 days after infection, transmission of live virus hasn’t been reported beyond 10 days after symptoms emerge, to my knowledge. Based on all of this, it seems that 14 days should be adequate to avoid further transmission after a positive test.
Both symptomatic and asymptomatic cases of COVID-19 generate mucosal (IgA) antibodies in the early stage of inflection, with virus-specialized antibodies (IgG) appearing a bit later, reportedly making tests that include IgA more timely and reliable. Asymptomatic cases produce lower levels of large, acute-stage, early-response antibodies (IgM), as well as fewer inflammatory markers like IL-6 and CRP. Presently, molecular PCR tests for the presence of the virus itself can take 7-14 days to get results. By then, most symptomatic patients have “seroconverted” and show antibodies (with about 60% expressing IgG or IgM by 7 days, and 90% after 14 days). My impression is that rapid antigen and antibody tests may have to suffice as the “right test at the right time” to inform decisions about isolation (especially IgA/IgM high) and contact-tracing (positive test, recent symptoms), at least until PCR test times can be shortened. Circulating antibody levels can, do, and should decline after an infection. That doesn’t mean that immunity has been lost. It just means that the body has “memory” B-cells and doesn’t need to crank out antibodies when they’re not needed.
My main concern about vaccines is the modest effectiveness threshold (50%) that’s being discussed. Neutralizing antibodies disable a virus by binding to it, followed by bringing the whole antibody-virus complex to “Fc receptors” that then target the complex for destruction. In certain viral infections, including Dengue, Zika, Ebola, and the first SARS coronavirus, non-neutralizing antibodies or insufficient numbers of neutralizing ones can be exploited by the virus to enter cells via the Fc receptors. So rather than destroying the virus, the result is “antibody-dependent enhancement” (ADE) of the infection.
A similar mechanism may have been involved in the 1966-67 failure of the vaccine for respiratory syncytial virus (RSV), which causes lung inflammation in infants, and worsened both infection and severity among those that received the vaccine. An early measles vaccine that produced low-avidity antibodies led to similar outcomes. I’ve been assured by a director of the NIAID that they’re taking the risk of ADE seriously in vaccine development. I’m hoping they can also offer reasonable assurance once a specific vaccine becomes available. It’s important for any vaccine to reliably generate protective levels of neutralizing antibodies.
Without an effective vaccine, one of the most important priorities should be increasing the speed of testing. In order to contain the spread of the virus, you don’t need herd immunity, and you don’t need lockdown and isolation everywhere, but you absolutely do need to immediately impose a high level of containment for newly infected individuals, and to quickly test and trace their recent contacts. Without that ability, the best we can do is to push a major second wave into the future.
Children under 10 do have substantially lower rates of SARS-CoV-2 infection, and are also disproportionately asymptomatic. They also tend to infect fewer people on average, both because their communicable window is on the shorter side, and because younger children generally have smaller social networks. The risk of transmission from young children isn’t zero, but only about 10% of household clusters have a child as the “index case” responsible for the cluster.
My impression is that the disproportionately asymptomatic cases in children are related to differences in the “innate” immune system (rather than the “adaptive” system that is specific to the virus or pathogen). Given that certain components of the innate system that drive inflammation (e.g. TLR2/TLR4) are reported to have lower expression in children than adults, and that children who do develop severe COVID-19 can present with inflammatory, Kawasaki-like symptoms, the difference between kids and adults may be that they’re generally less susceptible to the type of hyper-inflammatory response that causes fatalities in adults. Children still acquire the virus. They just may clear it differently.
Older children and teens in the 10-19 age range appear to have about half the rate of infection as adults, and only about 20% develop symptoms. However, they typically have larger social networks, and as a result, their lower rate and duration of infectivity is partly offset by a higher number of contacts (in our R0 arithmetic, that would be a lower D and possibly a lower p, but a higher N). For those reasons, estimates based on social tracking data suggest that, provided the initial pool of infective cases is low and other containment measures remain in place, opening primary schools alone would be expected to have only a modest effect on transmission. Opening high schools as well can be expected to have a larger impact, so masks, ventilation, smaller and stable groups, as well as contact tracing and other containment measures would remain important.
With regard to school reopening, my impression is that local conditions are important to consider, as well as the practices your schools put in place, the age of your kids, and the risk-profile of your family’s social circle. Different communities vary in their level of infection, but this will hopefully shrink nationally. This paper describing school reopening guidelines in Norway is among the best I’ve read, and the PDF of “Supplementary Material” is worth sharing with your elementary school administrators to support their planning efforts. For middle and high school students, additional containment measures are worth considering. Please feel free to share anything in this comment that you find useful as well.
As long as containment measures remain strongly in place until the “pool” of infective cases becomes low and manageable, we can begin to “normalize” even without a vaccine. But it’s the people who are most adamant about “opening up” and sending kids back to school that should also be most adamant about strong containment measures that would shrink the pool and allow us to do that. Local conditions also matter, so we should not expect different states and localities to be able to open up equally if their infection prevalence is not equal.
Unless containment measures have first reduced the pool of infective cases, even a slight relaxation in containment behavior can produce explosive growth. Once we reduce the infective pool, the more quickly we can test, isolate, and contact-trace new cases to contain local outbreaks, the more we can relax containment measures for the nation as a whole.
Even assuming schools and businesses “open up,” it will be important to remain vigilant about “superspreading.” About 20% of cases are estimated to be responsible for as much as 80% of transmission, and the events and locations involved tend to be situations where lots of people who were previously isolated in separate groups are brought together, or in the case of aged-care facilities, confined together. A New Zealand study, for example, identified high-schools, weddings, hospitality venues, aged-care facilities, conferences, and similar social events. It’s reasonable to assume that schools where kids are drawn from the same narrow geographic zone may be at less risk than those that draw from a broad range of districts.
The main issue, again, is that unless containment measures have first reduced the pool of infective cases, even a slight relaxation in containment behavior can produce explosive growth. That’s particularly true in the U.S. because there are many regions that remain on the “razors edge” between linear growth and exponential growth. The ability to quickly obtain test results, isolate new cases, and trace their contacts is also absolutely essential. Once we reduce the infective pool, the more quickly we can test, isolate, and contact-trace new cases to contain local outbreaks, the more we can relax containment measures for the nation as a whole.
One of several measures I’ve used to monitor the trajectory of the epidemic is the relationship between total 7-day cases and fatalities relative to the previous non-overlapping 7-day period. This isn’t quite a measure of reproductive rate Rt, but it captures many of the same dynamics. As this chart of U.S. 7-day fatalities shows, we pushed this ratio below 1.0 between May and June, but outbreaks in Florida, Texas, and elsewhere have driven growth higher again. This is a remarkably dangerous condition under which to relax containment measures.
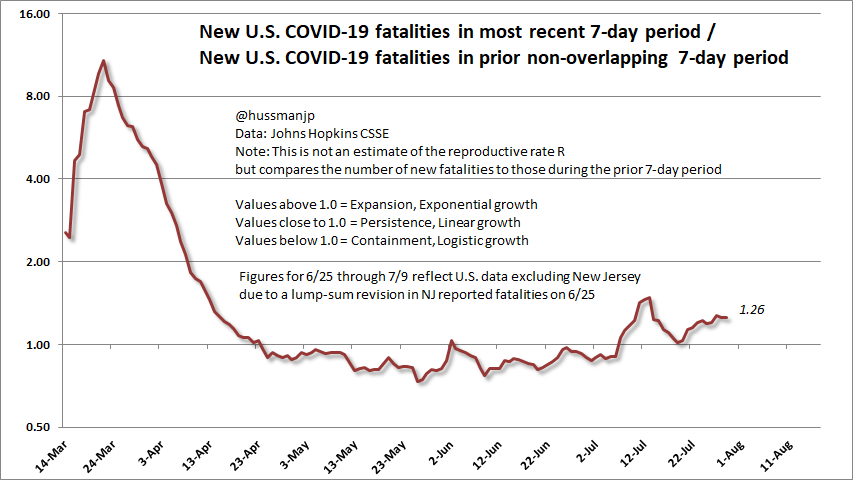
As I noted last month, it’s true that part of the explosion in new case reports can be attributed to broader testing. We see that reflected in a gradual reduction in the “case fatality ratio” (CFR) which measures fatalities as a ratio to reported cases. My gap between reported cases and my own estimate of “shadow cases” is also gradually narrowing, though it’s still significant. Even doubling or even quadrupling the “shadow case” estimate to allow for asymptomatic cases that will never show up in reports, the likely number of Americans that have been infected by SARS-CoV-2 is currently in the range of 15-30 million (which is in line with broad-based studies).
That suggests the actual number of U.S. COVID-19 cases could reasonably be 7 times higher than the number of cases that have been reported, but back in June, I would have put that multiple at more than 10. We’re gradually doing better on testing, but the reporting lags remain unacceptable. Meanwhile, only about 5-9% of the population has been infected to-date. Yet we’ve already had over 150,000 U.S. fatalities.
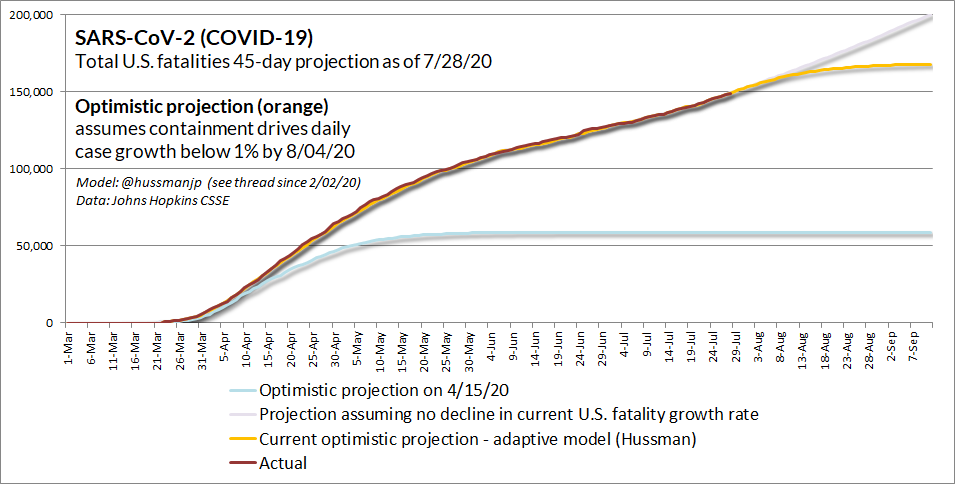
So much for the optimistic scenario. We’re way off book. I had hoped this was just a one-time adjustment. Understand this: peak daily new cases in a containment scenario is also peak infectivity if containment is abandoned at that moment.
– John P. Hussman, Ph.D., April 18, 2020
The chart below shows the 45-day projection from a model I introduced back in March, which captures the distinction between reported cases (which are sensitive to the availability and intensity of testing) and underlying “shadow cases” that have a more stable relationship to fatalities. The orange line is the current “optimistic” projection – a word that we’ve had to abandon far too often in recent months. I’ve kept the April “optimistic” projection, shown in light blue, for reference. The highest line, in light purple, shows the trajectory that would result if the current growth rate remains constant. Emphatically, none of these show the trajectory that we could expect if we were to relax containment efforts here.
How to avoid a second wave
The discussion that follows is not intended to be alarming, but I do want it to wake you up, because it’s a real risk. The only thing that prevents the worst outcomes below is that humans are capable of changing their behavior, and I would expect that we would do so in response to an emerging second wave. Given the needless politicization of even basic containment measures like masks, I’m not certain of that. So my hope is to provide not only an illustration but also a warning.
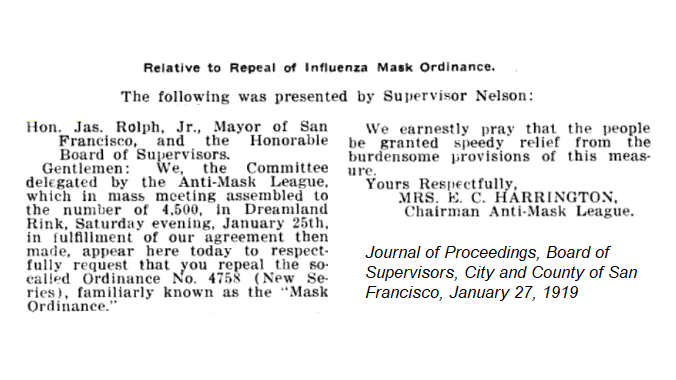
If you examine the 1918-1920 influenza pandemic, you’ll see that it occurred in multiple “waves,” where the second episode was markedly worse than the first. Though some historians have proposed that maybe the virus mutated between those two episodes, there’s actually no scientific evidence to support that. Indeed, the scientist who reconstructed the 1918 virus from RNA extracted from century-old lung tissue (talk about Jurassic Park) notes that the period between waves was almost undetectable in some areas, and the virus would have had to mutate simultaneously around the world.
While influenza viruses do have some amount of seasonality to them, an important driver of the second wave was most likely an increased level of interaction in the fall of 1918, not only as kids returned to school (children do tend to be significant vectors when it comes to influenza), but also as summer ended and adults increased their own interactions, particularly indoors – all of this in an environment where there was a larger pool of active cases to “feed” that second wave.
Here’s what the British data looked like during that pandemic.
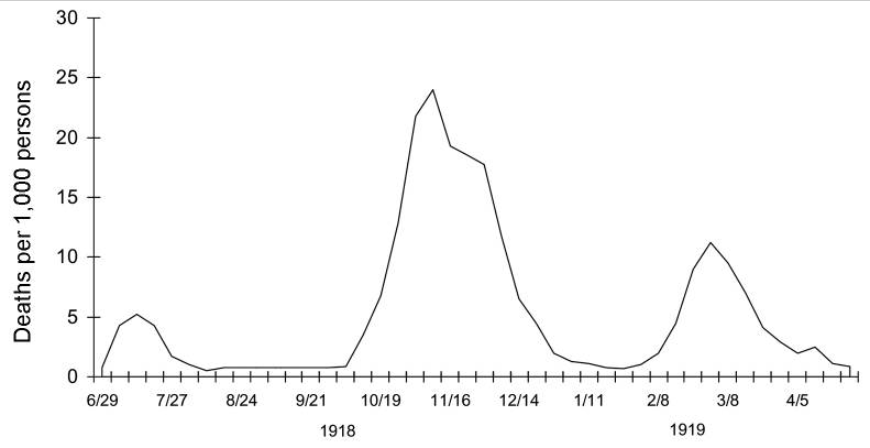
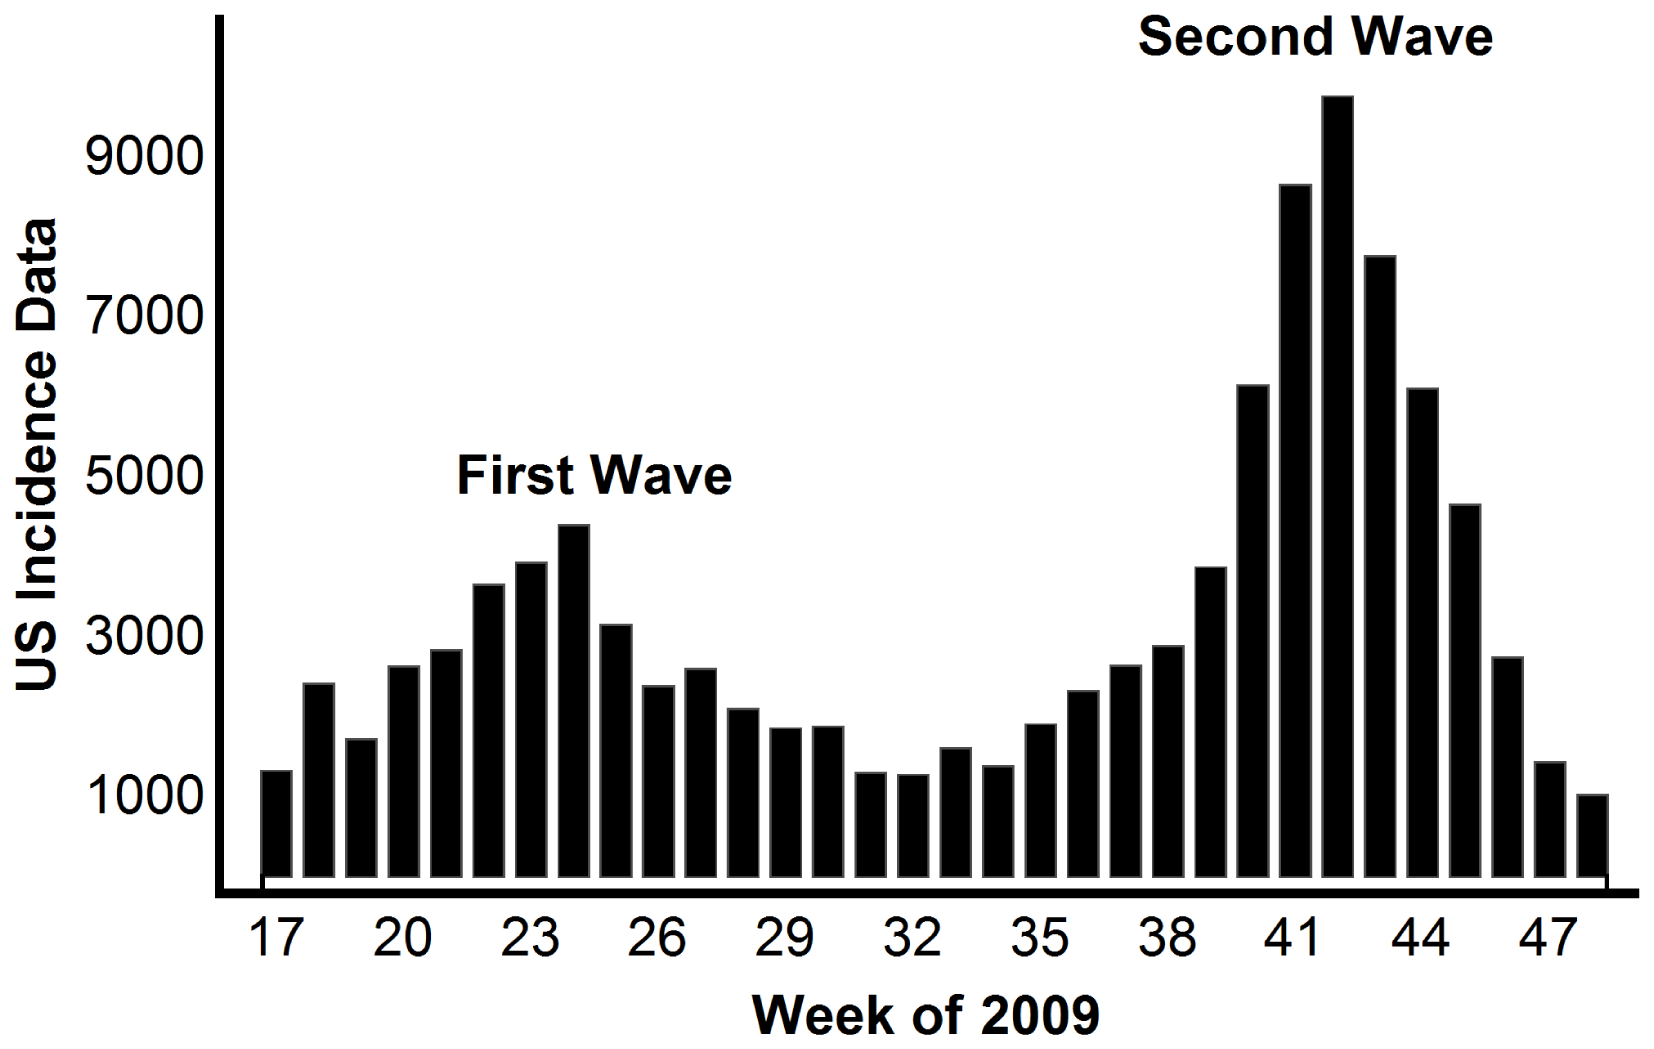
We can see a similar pattern in the second wave of the H1N1 mini-epidemic in 2009.
The 1918-1920 pandemic is estimated to have led to 50 million global fatalities, with about 675,000 deaths in the United States. Philadelphia, which decided to throw the superspreader “Liberty Loans” parade in September 1918, suffered disproportionate casualties. San Francisco was also among the hardest hit in terms of fatalities per million.
Interestingly, all influenza pandemics, and nearly all influenza A cases, descend from the 1918 virus, though modern strains lack certain genomic features (particularly in the HA gene and the polymerase gene) that allowed the 1918 virus to be so infective, and to generate 39,000 times more virus particles than typical strains. Yikes.
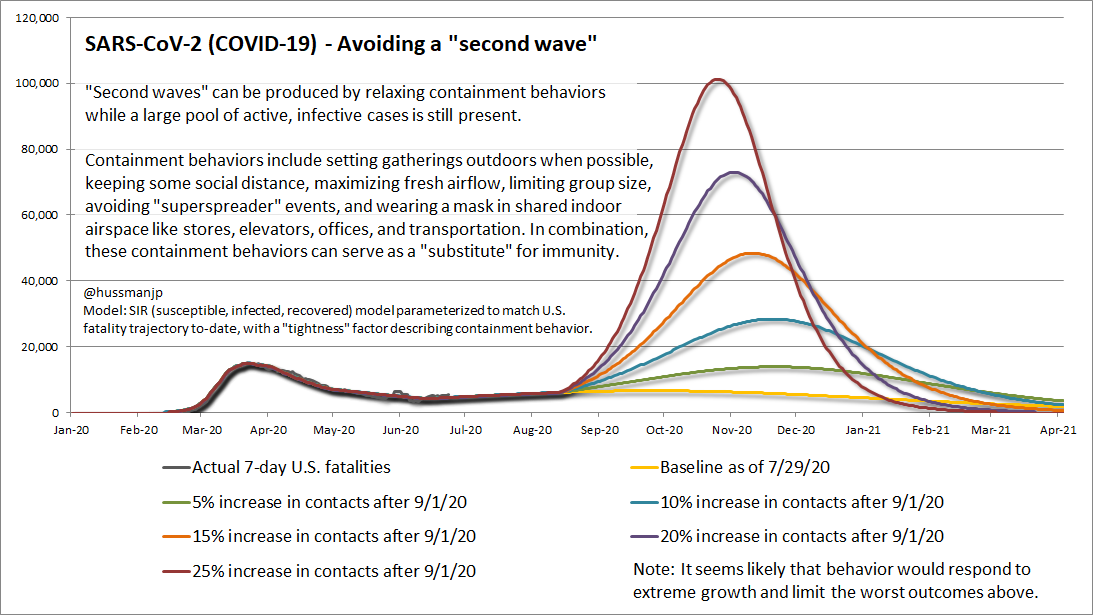
The model below captures the dynamics of the SARS-CoV-2 epidemic to-date. It’s essentially a SIR (susceptible, infected, recovered) transmission model, where I’ve included an additional parameter to gauge the “tightness” of containment measures. We can generate, almost exactly, the fatality curve of the U.S. using this model, which infers from the data that containment “tightness” increased sharply between March 1 and roughly April 20, with two slight relaxations of containment: one near May 20, when CDC “reopening” guidelines were released, and the other just before Independence Day at the beginning of July.
Presently, the level of containment inferred from this model is not dramatically looser than the level of containment we observed in March and April. Things have certainly “opened up” in certain states, with poor consequences for those that did so without shrinking the “pool” first. But for the nation as a whole, interaction levels and transmission rates remain markedly lower than they were before March. So although containment measures, mask use, distancing and other factors were weak, dismissive, and delayed in the critical early weeks, the epidemic has been taken seriously enough since then to effectively reduce the spread of COVID-19.
The problem is that the pool of infected cases has expanded again, and it remains large enough to keep us teetering right at the edge of a second exponential outbreak.
It’s important to understand how bad this could get, and how quickly the situation could deteriorate in response to even a slight easing of containment – unless we shrink the infective pool first.
The chart below shows the actual course of U.S. fatalities to-date, along with several easing scenarios beginning on September 1. All of them but the baseline scenario (no change) are bad, but they are also non-linearly bad. So a 20% increase in person-to-person contacts would currently produce vastly more than twice the fatalities as a 10% increase in contacts. That’s because as we move Rt from below 1.0 and increasingly above 1.0, the transmission of the virus becomes exponential. I’ve embedded a bunch of text in this chart because I don’t want it to be misused. None of these scenarios is a prediction, because I believe that our behavior can change in response to fresh outbreaks, but we should take these possibilities seriously.
We are doing neither enough to defend our public health, nor enough to defend our economy. These are not competing goals. They go hand-in-hand. The main prerequisite for opening up on a large scale is to first shrink the infective pool. The other prerequisite is to improve the speed and effectiveness of testing, isolation and contact tracing when new cases emerge. Again, the people who are most adamant about “opening up” and sending kids back to school are also the people that should be most adamant about measures that would first shrink the pool enough to get going.
Containment measures essentially provide a combination of actions that “substitute” for immunity. Provided that strong testing, isolation, and contact tracing measures are in place, other containment measures can be gradually relaxed as case numbers diminish. At present, essential ones include social distancing, use of outdoor settings where possible, ventilation, encouraging face masks – particularly in shared public indoor airspace (including transportation) and also outside if distancing isn’t possible, avoiding the creation of “network hubs” where previously separated groups are mixed without other containment measures in place, limiting superspreader events that involve large numbers of person-to-person interactions, reducing the length of meetings, using stable student groupings, and ensuring that local “reopening” decisions are supported by local containment practices and a sustained reduction in infection rates.
The main prerequisite for opening up on a large scale is to first shrink the infective pool. The other prerequisite is to improve the speed and effectiveness of testing, isolation and contact tracing when new cases emerge.
Look. This thing has not suddenly gone to sleep. We’ve had 7000 U.S. fatalities from COVID-19 in just the past week. That’s more than twice the number of Americans lost on 9/11. We’ve already lost more Americans than the number of U.S. soldiers lost in World War I; more than in every war since World War II. For those who reveal their baseness of character by arguing that “it’s mostly old people,” I somehow can’t imagine they would have the same dismissive response if terrorists were lining up the same Americans and shooting them in the head. Must we really insist on protecting others only when the response involves hatred and bloodshed, but rail against every measure that involves reason and common humanity?
Market conditions
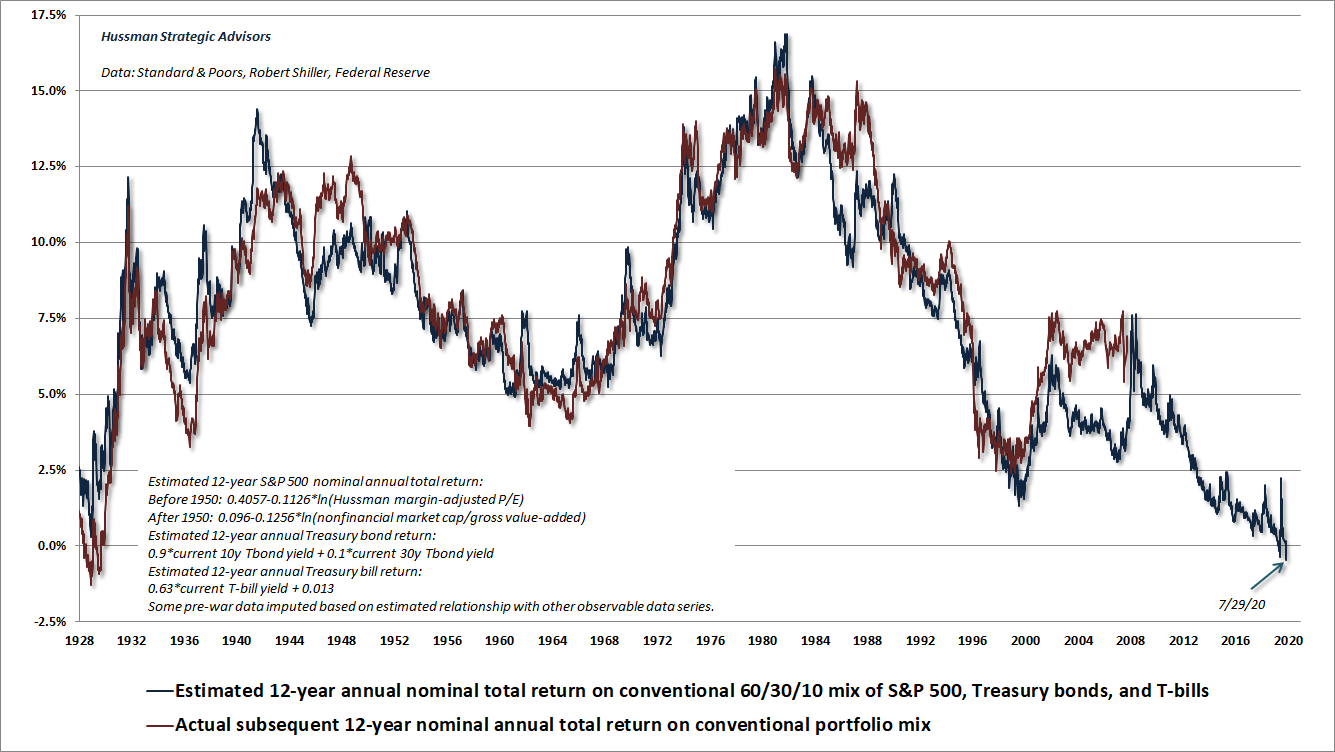
On Wednesday July 29, the U.S. financial markets quietly made history, as our projection of 12-year nominal total returns for a conventional passive portfolio mix (60% S&P 500, 30% Treasury bonds, 10% Treasury bills) fell to -0.45%, the lowest level in history. While 10-year Treasury bond yields are at just 0.6%, we estimate that the 12-year average annual total return of the S&P 500 will fall short of that level by about 2%, producing a very long, but likely interesting, trip to zero or negative returns for more than a decade.
The chart below shows our estimate of prospective passive investment returns for this portfolio mix back to 1928, along with the actual subsequent 12-year nominal total return. As I regularly note, actual returns have regularly exceeded projected returns in 12-year periods that end at bubble extremes (like the 12-year return measured from 1988). That, of course, is precisely what defines bubbles. Past returns are surprisingly glorious, because subsequent returns are surprisingly dismal.
Of course, in addition to valuations, which are informative about long-term returns and full-cycle downside risk, we have to attend to the uniformity or divergence of market internals, which is our best gauge of whether investors are inclined toward speculation or risk-aversion. Back in late-2017, I abandoned the idea that extreme “overvalued, overbought, overbullish” syndromes still impose a reliable “limit” to speculation. Since then, we have been content to identify the presence or absence of speculative pressure, based on our measures of internals, without the added assumption that either speculation or risk-aversion have measurable “limits.”
My hope is that the impact of that change has been a bit more evident this year, even in the face of the most extreme valuations in history, which continue to imply a two-thirds loss in the S&P 500 over the completion of this cycle.
I’ve regularly detailed the fact that the impact of monetary policy on the market is enormously dependent on the condition of market internals, and that easy money only reliably benefits stocks if investors are inclined to speculate. That’s why our response to monetary intervention is sensitive to the condition of market internals.
It’s worth repeating that the Fed eased aggressively and persistently throughout the 2000-2002 and 2007-2009 collapses. The psychology of investors can either amplify the effect of monetary policy, or render it practically useless.
Here and now, market conditions feature 1) historically extreme valuations, 2) unfavorable dispersion in our measures of market internals, and 3) unusually “overvalued, overbought, overbullish” conditions. That combination holds us to a hard-negative market outlook, but it’s also a flexible outlook. Our measures of market internals are close enough to “borderline” that we would not plan to “fight” a material market advance if it occurs.
Instead, if market internals were to improve, our near-term view would likely become more neutral, and could even become constructive under certain conditions – with a safety net of course.
As a side-note, the valuation measures used above do not reflect the profound decline in GDP in the second-quarter of 2020. As I’ve always argued, the denominator of any useful valuation multiple should be a “sufficient statistic” that’s proportional to the likely long-term stream of future cash flows. Generally speaking, GDP, corporate revenues, and corporate gross-value-added are among the most reliable measures for this purpose. While I do expect that part of the economic disruption we’re observing will persist over the long-term, just as the global financial crisis shifted the trajectory of real GDP to a persistently lower level, I don’t view second-quarter GDP as a representative or sufficient statistic for very long-term cash flows.
Clearly, using second-quarter figures would place valuation measures well above the February peak. My view is that first quarter GDP and revenue figures provide a sufficiently representative basis for valuation.
Given the present combination of market conditions, the immediate outlook remains negative here, but we remain sensitive to changes in the uniformity of market internals that could encourage a more neutral near-term view.
Passive investing and the arithmetic of market share
Along with this idea as to what constituted the basis for common-stock selection emerged a companion theory that common stocks represented the most profitable and therefore the most desirable media for long-term investment. This gospel was based on a certain amount of research, showing that diversified lists of common stocks had regularly increased in value over stated intervals of time for many years past.
These statements sound innocent and plausible. Yet they concealed two theoretical weaknesses that could and did result in untold mischief. The first of these defects was that they abolished the fundamental distinctions between investment and speculation. The second was that they ignored the price of a stock in determining whether or not it was a desirable purchase.
The notion that the desirability of a common stock was entirely independent of its price seems incredibly absurd. Yet the new-era theory led directly to this thesis… An alluring corollary of this principle was that making money in the stock market was now the easiest thing in the world. It was only necessary to buy ‘good’ stocks, regardless of price, and then to let nature take her upward course. The results of such a doctrine could not fail to be tragic.
– Benjamin Graham & David L. Dodd, Security Analysis, 1934
One of the frequent arguments I’ve heard lately is that passive investing is somehow a new and relentless force that has the capacity to drive valuations persistently higher, as passive portfolios come to represent an ever-larger share of investment holdings.
It’s useful to think about the arithmetic involved here. I’ve found similar calculations useful in a variety of contexts over time – particularly in the analysis of market share and saturation. This may not be how others think about the problem, but it will give you a sense what changing market share implies.
Suppose we have two companies, A and B, and both have growing revenues. If company A increases its size relative to B over a 10-year period, by a factor of X, how fast does company A grow? Skim over the next few lines and come back if math gives you hives.
Well, we know that the size of each company at the end of 10 years is:
A(10) = A(0)*(1+g_a)^10
B(10) = B(0)*(1+g_b)^10
We also know A(10)/B(10) = X * A(0)/B(0), which you can use to prove to yourself that:
(1+g_a) = (1+g_b) * X^(1/10)
So, for example, if company grows by 5% annually, and company A doubles its size relative to B over a 10-year period, it turns out that company A has to grow by 12.5%
That’s the basic arithmetic for any kind of calculation that involves growth in the “relative share” of a given company, or investment strategy, or country.
Another example: if a given industry is growing by 8% annually, but I expect the market share of company A to triple over a decade, the implication is that I expect company A to grow by 20.5% annually.
Applying the same argument to the “market share” of passive investing, one arrives at the implication that rising prices and amplified investment returns can be driven simply by changes in the number of investors who pursue that strategy, regardless of valuations or other factors.
One can’t argue with arithmetic. Math is math. It’s the assumption about relentlessness that bothers me. It’s the underlying behavioral assumptions that are questionable, which rely on a permanent disregard for valuations and the long-term investment returns they embed. Across history, as Graham and Dodd observed about 1929, booms in the popularity of passive investing have generally been a sign of backward-looking performance chasing, the results of which have repeatedly been tragic.
Then again, I’ve made myself clear in recent years that I’ve abandoned the idea of “limits” to speculation. If arguments like this are correct, that’s fine. We have no particular inclination to fight market advances that feature broad internal uniformity. Indeed, the entire net 2007-2020 market gain occurred during periods when our measures of market internals were uniformly favorable.
I’ve seen similar arguments in relation to monetary policy. If investors all desire a fixed percentage of cash in their portfolio, either directly as currency or indirectly as bank reserves, and the outstanding issuance of bonds and stock shares is held constant, then any growth in base money must result in equivalent growth in stock and bond market capitalization. Again, you can’t really argue with the arithmetic. It’s the behavioral and investment assumptions that are questionable, particularly at the extremes.
There’s no doubt that the recent speculative bubble has been amplified by a backward-looking embrace of passive investing, along with the desire of investors to rid themselves of monetary hot potatoes (which someone, in equilibrium, has to hold at every moment in time until the base money is retired). But just as I believe – despite needless political obstacles – that changes in our own behavior can avoid a “second wave” as extreme as pure arithmetic suggests, I also believe that investors periodically consider the valuations and investment implications of the securities they hold.
Presently, our estimate of likely 12-year S&P 500 nominal total returns is negative, and is 2% below the near-zero yield on Treasury bonds. On one hand, we have to be sensitive to periods where investors get the speculative bit in their teeth, and psychologically rule out the risk of loss. On the other hand, we should remember that no market cycle in history has avoided a period of risk-aversion that brings reliable valuation measures to less than half of current levels. Indeed, nearly all of them restore or breach historical norms that presently stand at about one-third of current levels.
In short, we have to allow for what Graham & Dodd described as the “untold mischief” of passive investment strategies, which view the desirability of investments as independent of their price. We do need to recognize that zero-interest liquidity is treated as an “inferior” asset when investors are inclined to speculate. But we also need to remember that no episode of price-insensitive speculation has survived the complete market cycle without tears.
So while we don’t plan to “fight” speculative psychology by amplifying a bearish outlook when market internals indicate that investors have the bit in their teeth, we also don’t plan to abandon our safety nets at extreme valuations, and we will typically adopt a hard-negative market view in periods when extreme valuations and overextended conditions are joined by ragged and divergent market internals.
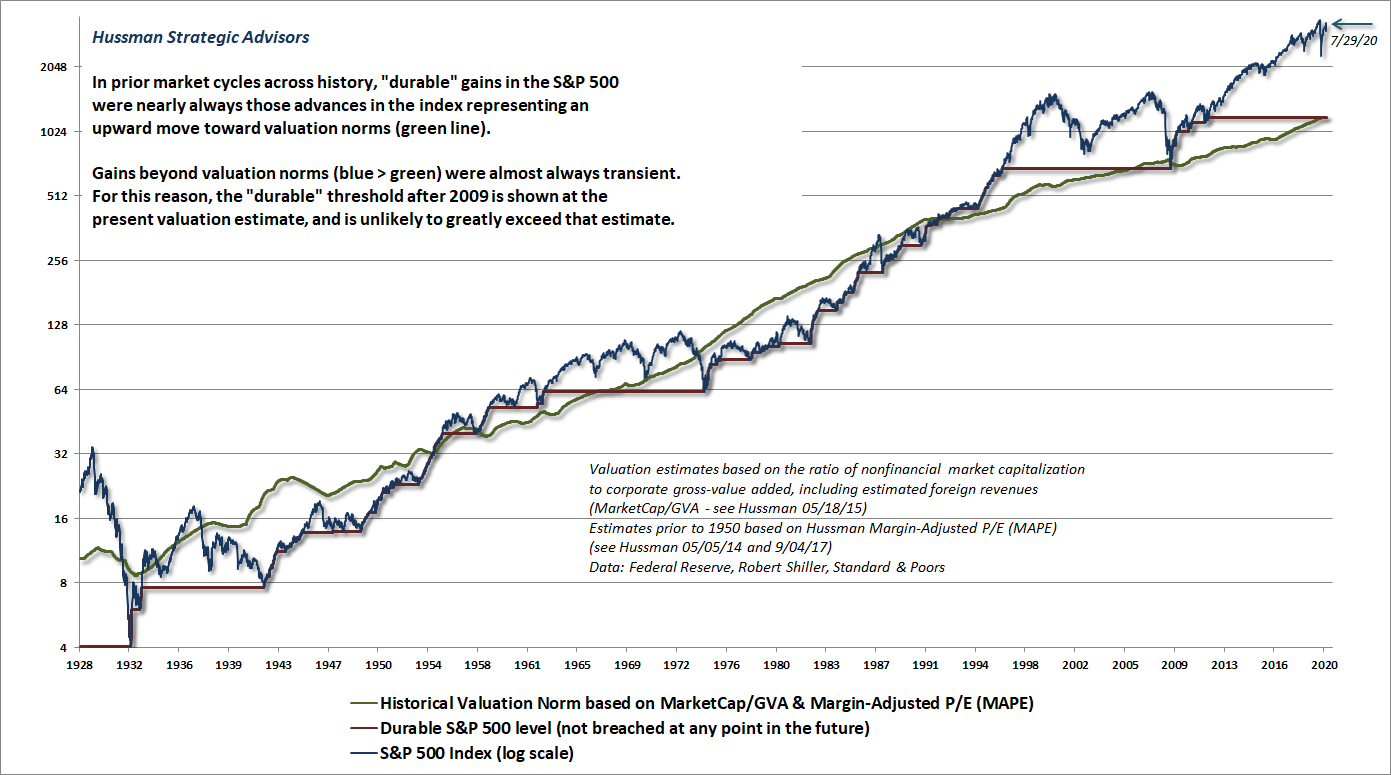
The chart below offers a long-term perspective on the distinction between durable and transient market returns. Departures from historical valuation norms can certainly persist for some time, which is why internals are important, but every market cycle has ultimately run into an episode of risk-aversion. When starting valuations are extreme, those market declines can wipe out more than a decade of returns.
It’s worth recognizing, now, that the cumulative total return of the S&P 500, including dividends, underperformed Treasury bills from August 1929 to August 1945, again from August 1959 to August 1982, and again from May 1995 to March 2009. That’s 53 years of an 80 year period. It should be clear that current conditions are ripe for this sort of episode.
We’ve learned very well in recent years that stupidity has no well-defined “limits.” But we should not go so far as to rely on this stupidity, by ruling out eventual episodes of value-conscious behavior. I expect that our attention to valuations, market internals, and other elements of our investment discipline will help us to navigate between the two.
As a final note, with respect to the very largest glamour stocks, my impression is that investors should consider the opposite implications of “market share” arithmetic. Presently, the largest 5 stocks in the S&P 500 comprise about 23% of the market capitalization of the index, easily eclipsing the 2000 peak, when the big 5 represented just over 16% of index capitalization. Here’s the thing. Investors now require these stocks to maintain their current market share, relative to the index as a whole.
Consider a bear market that brings valuations only to 2002 levels – the highest level of valuation observed at the end of any market cycle. If the S&P 500 was to decline by 50% overall, and the largest 5 stocks moved back to the 2000 extreme of 16% of the index (which they represented as recently as 2019), the implied loss for these stocks would be 0.5(.16/.23)-1 = -65%, while the implied loss for the rest of the S&P 500 would be 0.5(.84/.77)-1 = -45%. That’s not so much a projection as an implication of arithmetic, so we should at least consider this possibility given that the market cap of the largest 5 stocks has become unusually skewed.
Keep Me Informed
Please enter your email address to be notified of new content, including market commentary and special updates.
Thank you for your interest in the Hussman Funds.
100% Spam-free. No list sharing. No solicitations. Opt-out anytime with one click.
By submitting this form, you consent to receive news and commentary, at no cost, from Hussman Strategic Advisors, News & Commentary, Cincinnati OH, 45246. https://www.hussmanfunds.com. You can revoke your consent to receive emails at any time by clicking the unsubscribe link at the bottom of every email. Emails are serviced by Constant Contact.
The foregoing comments represent the general investment analysis and economic views of the Advisor, and are provided solely for the purpose of information, instruction and discourse.
Prospectuses for the Hussman Strategic Growth Fund, the Hussman Strategic Total Return Fund, the Hussman Strategic International Fund, and the Hussman Strategic Allocation Fund, as well as Fund reports and other information, are available by clicking “The Funds” menu button from any page of this website.
Estimates of prospective return and risk for equities, bonds, and other financial markets are forward-looking statements based the analysis and reasonable beliefs of Hussman Strategic Advisors. They are not a guarantee of future performance, and are not indicative of the prospective returns of any of the Hussman Funds. Actual returns may differ substantially from the estimates provided. Estimates of prospective long-term returns for the S&P 500 reflect our standard valuation methodology, focusing on the relationship between current market prices and earnings, dividends and other fundamentals, adjusted for variability over the economic cycle.