

Counting the Chickens Twice


John P. Hussman, Ph.D.
President, Hussman Investment Trust
May 2021
In the latter stage of the bull market culminating in 1929, the public acquired a completely different attitude to the investment merits of common stocks. Why did the investing public turn its attention from dividends, from asset values, and from average earnings, to transfer it almost exclusively to the earnings trend, i.e. to the changes in earnings expected in the future? The answer was, first, that the records of the past were proving an undependable guide to investment; and, second, that the rewards of offered by the future had become irresistibly alluring.
– Benjamin Graham & David L. Dodd, Security Analysis, 1934
There’s an old bit of advice that one shouldn’t count one’s chickens before they’re hatched. Much of the efforts of Wall Street are directed at ignoring that advice. That’s fine in the sense that prices can and often do move in advance of changes in economic activity and earnings.
Of course, Wall Street can also take its chicken-counting to extremes. Indeed, every speculative episode is based, in part, on extrapolating the addition and multiplication of chickens into the indefinite future. One of the most striking examples of excessive chicken-counting here is the way that Wall Street analysts and financial television anchors are equating the very reasonably expected post-pandemic “recovery” of private income and employment with an equally inevitable boom in real GDP, corporate earnings, and stock prices.
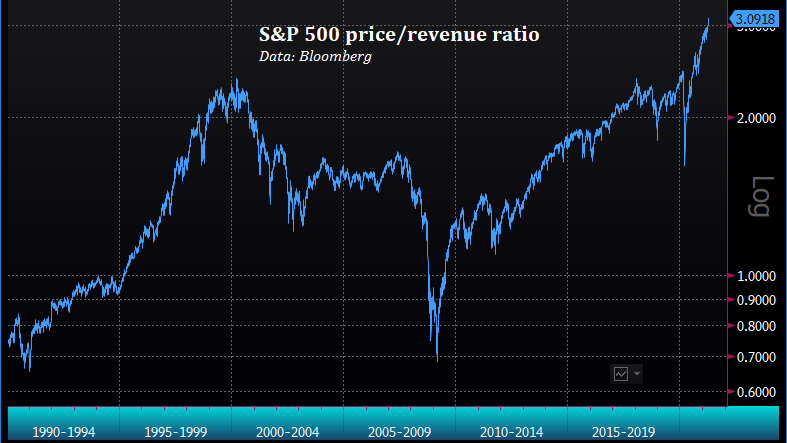
The problem with this is that nominal GDP is already at a record high, real GDP is within 1% of its pre-pandemic record, and S&P 500 earnings in the most recent three quarters already exceed S&P 500 earnings in the three quarters just before the pandemic. Meanwhile, the most reliable measures of S&P 500 valuation are easily beyond every prior historical extreme, including 1929 and 2000.
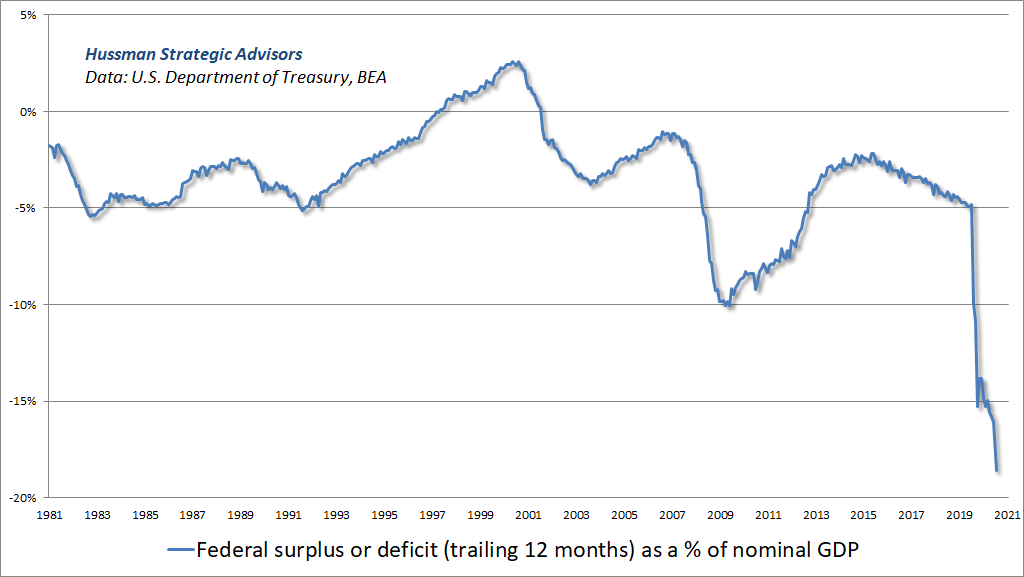
What’s going on is simple. Over the past 12 months, the U.S. federal government has run the deepest fiscal deficit since World War II. Investors seem to be vastly underestimating the extent to which a likely economic rebound will replace rather than augment the effect of trillions of dollars in pandemic relief programs, amounting to close to 20% of GDP, which preserved corporate revenues while subsidizing labor costs.
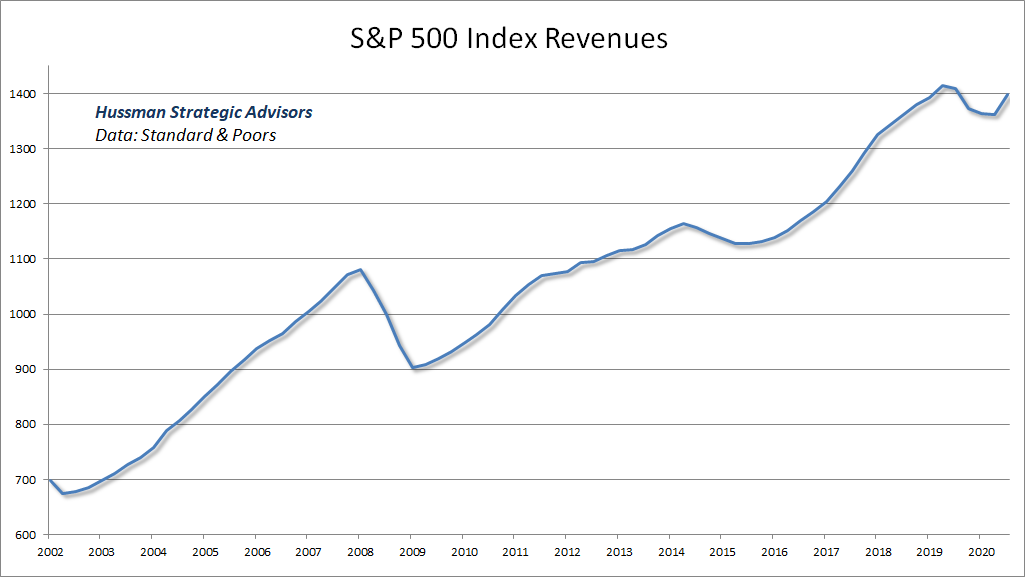
All of the fiscal support during the past year has held S&P 500 revenues within a few percent of record highs.
Investors have already driven the S&P 500 to the most extreme valuation multiples in history. But instead of basing their expectations for future returns on historically reliable valuation measures, they have, in the words of Graham & Dodd, transferred their attention almost exclusively to the trend. Indeed, there is an almost universal expectation that a recovery in the private economy will augment fundamentals with massive growth. This kind of double-chicken counting ignores the enormous amount of private income and spending that will be needed simply to substitute for trillion dollar deficits that have held fundamentals near their pre-pandemic highs. As Galbraith wrote of prior speculative episodes, “As long as they are in, they have a strong pecuniary commitment to the belief in the unique personal intelligence that tells them that there will be yet more.”
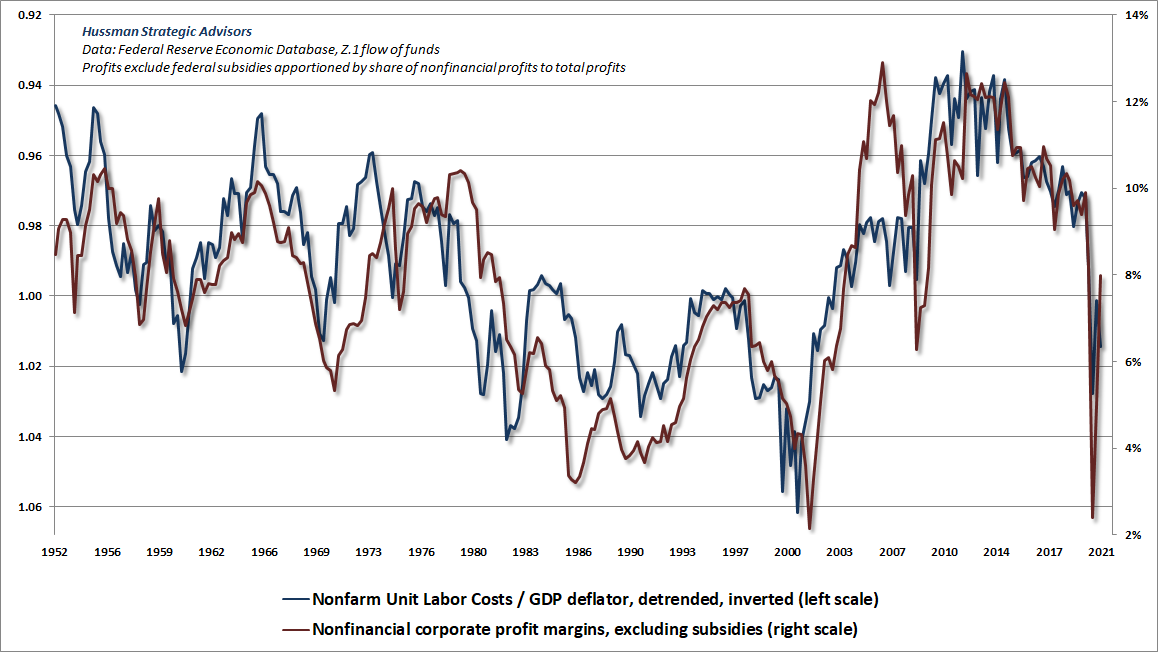
On the subject of labor costs, it’s worth noting that real unit labor costs have been gradually increasing for several years. This would be more evident if not for the massive subsidies that are currently embedded in U.S. corporate profits. The chart below shows real unit labor costs on an inverted left scale, along with nonfinancial profit margins, excluding the impact of subsidies. The simple way to understand this chart is that rising real unit labor costs mean that labor compensation (per unit of output) has outpaced price increases (per unit of output). In an economy where the compensation of employees (unit labor cost) still represents 62% of the price of nonfinancial output, that places downward pressure on profit margins.
Meanwhile, the record household saving, corporate profits, and trade deficits (foreign “savings”) that we currently observe are the predictable accounting consequences of federal deficits near 20% of GDP. But unless we maintain those deficits indefinitely, corporations, households, and foreign countries are going to have to pick up the slack, which means that aside from the lagged effect of these deficits, the massive post-pandemic “recovery” of the private sector is not likely to drive meaningful “growth” beyond what is already in hand.
The moment the government runs a ‘deficit,’ there is absolute certainty that at least one other sector – households, corporations, or foreign countries – will run a ‘surplus,’ in which the income of that sector will exceed its consumption of U.S. goods and services and net real investment (e.g. homes, buildings, capital equipment). Ideally, we can sustain as much domestic consumption and investment as possible. In any event, we’re going to be subsidizing a surplus for somebody. It would best be American families.
– John P. Hussman, Ph.D, May 2020
So yes, as the pandemic ends, the U.S. economy is likely to gradually be driven by a circular flow that emphasizes private income and spending rather than government subsidies. But it’s useful to recognize that that entire circular flow has been preserved by massive federal deficits over the past year. Most of the increase in private activity is likely to simply replace federal support, not augment it. The chickens are already here. Investors are counting them twice, and they’re paying record valuations for every one of them.
Air-pockets, panics, and crashes
It’s never a good thing when overvalued, double-counted chickens are being purchased with borrowed money. With margin debt at the highest level in history relative to GDP, with the most extreme valuations on record, with bullish sentiment at lopsided extremes, with the S&P 500 pushing its upper Bollinger bands at every resolution, with divergence and deterioration in our measures of market internals, and with the S&P 500 strikingly overextended relative to widely followed moving averages (e.g. 200-day), I believe that the market is at clear risk of a vertical “panic” or “air-pocket” much like we observed in 1987 and 1998. Neither of those panics was associated with a recession. They were just points where overextended investors attempted to reduce their leveraged positions into a market where the bids were insufficient to absorb the selling without large price discounts.
A 20-35% decline would easily fit into that sort of outcome. That wouldn’t bring valuations anywhere near their historical norms, but there’s really no need to make projections or rely on any given scenario. At present, we’ve got a combination of extreme valuations, unfavorable market internals, and upward yield pressures, which we’ve never viewed favorably, because it can create a “trap door” situation.
Valuations, trend uniformity, and yield pressures are now uniformly unfavorable, and the market faces extreme risk in this environment.
– John P. Hussman, Ph.D., October 3, 2000
The apparent stability of the market is living off of momentum here, so an initial break from recent highs – particularly in equities and low-grade credit – may amplify rather than lessen downside risk, because it would encourage a rush for the door. Our outlook will change as observable conditions do.
It’s worth remembering that air-pockets, panics, and crashes typically reflect a depressed and inadequate risk premium being driven higher. No other “catalyst” is needed but a brief bout of risk-aversion or profit-taking that nicks overleveraged investors enough to provoke a concerted and self-reinforcing attempt to exit.
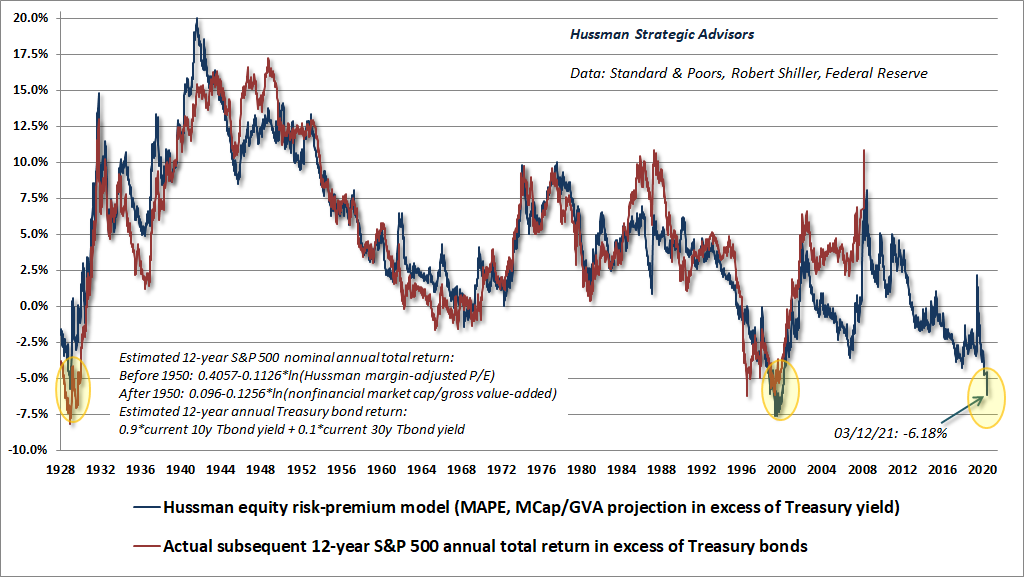
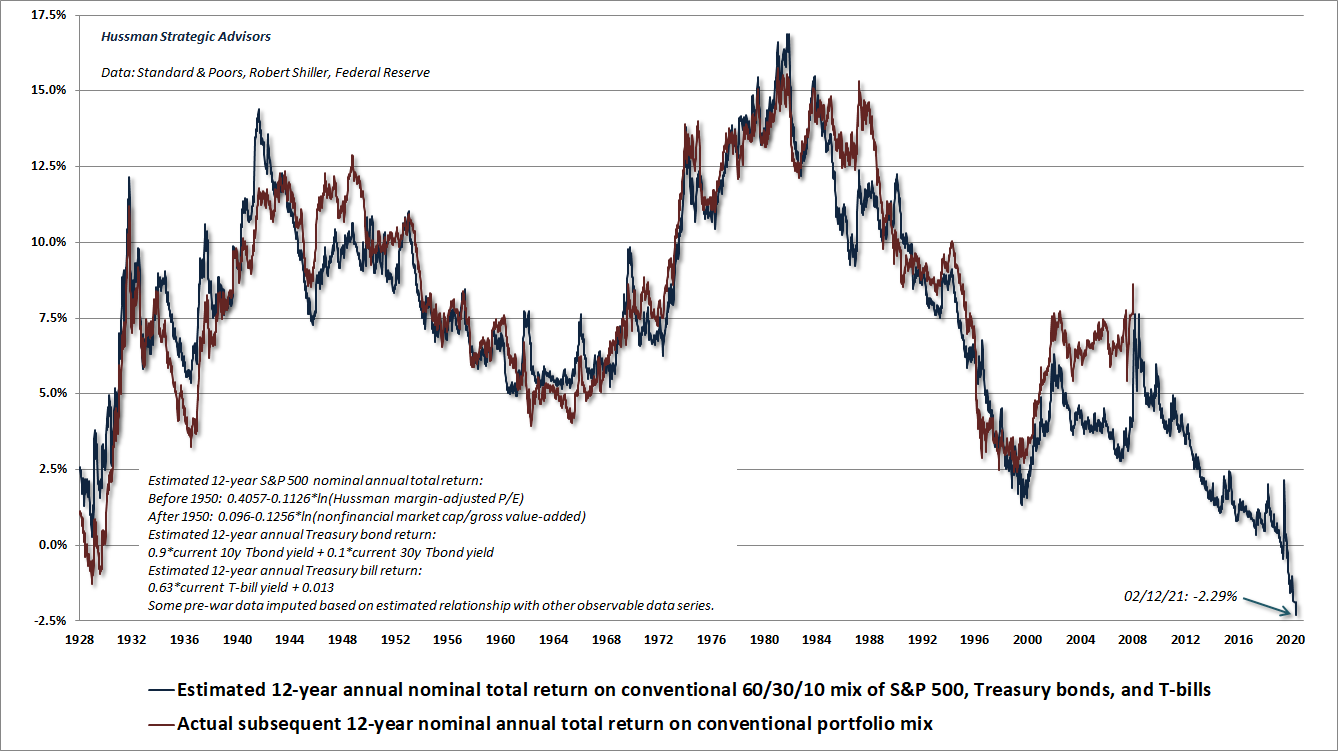
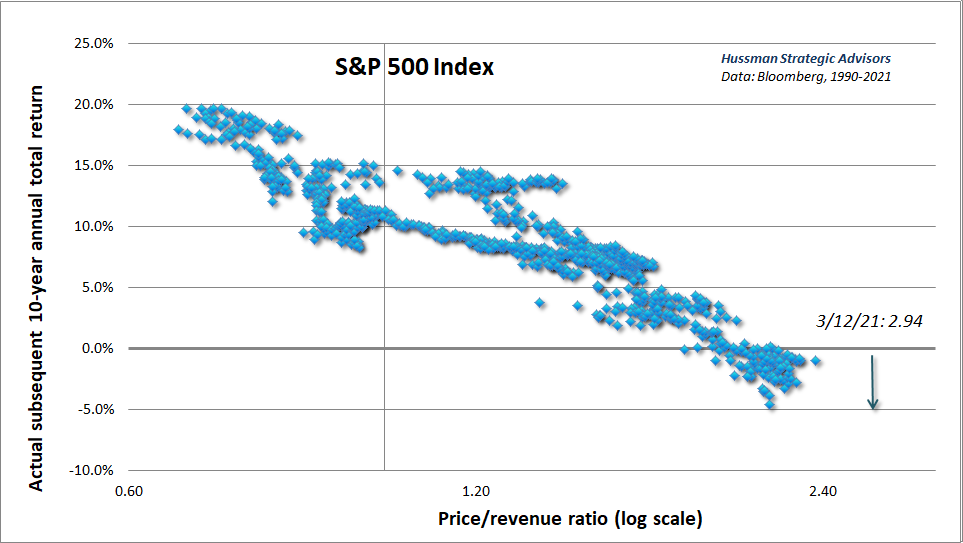
On the subject of risk-premiums, CCC-rated junk bond yields fell briefly to the lowest level in history last week, even while higher-grade yields are easily higher than they were several months ago. Our estimate of the “equity risk premium” – the expected return of the S&P 500 relative to Treasury bonds – is also at depressed levels previously seen only at the 1929 and 2000 market peaks. Feel free to compare this measure with any of the garbage “equity risk premium” measures churned out by Wall Street (which are typically never tested against actual subsequent returns). Despite the depressed level of Treasury bond yields, I do expect the total return of the S&P 500 to lag those returns in the coming 10-12 years.
The chart below is a useful reminder of the challenging arithmetic that investors face at current valuation extremes. Let’s assume that in the coming 5 years, S&P 500 revenues grow at the same 4% annual rate as in the two decades leading up to the pre-pandemic highs. Suppose that over that 5-year period, the S&P 500 price/revenue ratio retreats from its current multiple of 3.1 to a level no lower than the 2000 bubble extreme of 2.2. Given a dividend yield of just 1.4% on the S&P 500, the following average annual total return would result:
1.04*(2.2/3.1)^(1/5)-1+.014 = -1.5% annually.
That’s assuming that valuations don’t even break below their 2000 bubble peak. It’s certainly possible to make different assumptions, provided that they’re reasonable and informed by historical evidence. What’s not possible is to alter the basic arithmetic that links valuations, fundamentals, and subsequent investment returns.
Indeed, the same arithmetic implies that, provided that valuations enjoy a “permanently high plateau” at current extremes, investors could reasonably expect average annual total returns of about 5.4% in the future. That figure does, however, require valuations to remain at record highs indefinitely.
The habit of relating what is paid to what is offered is an invaluable trait in investment. The really dreadful losses of the past few years (and many similar occasions before) were realized in those common stock issues where the buyer forgot to ask ‘How much?’
– Benjamin Graham, The Intelligent Investor, 1973
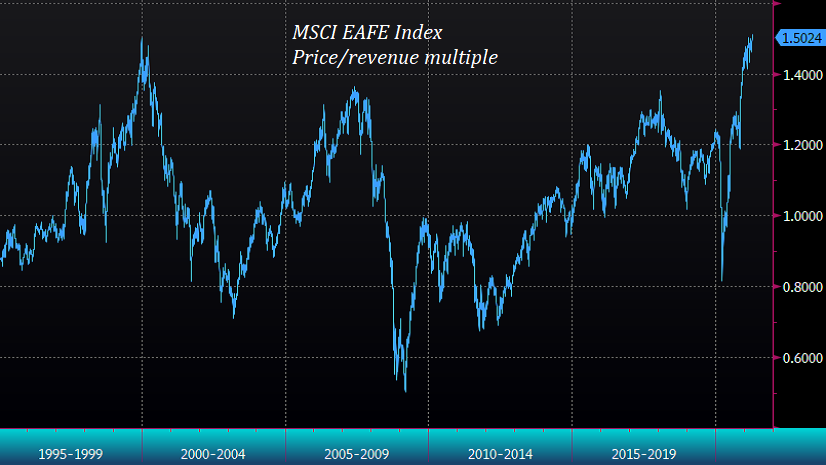
Unfortunately, one observes a similar valuation picture for international stocks. The chart below shows the price/revenue ratio for the MSCI EAFE Index.
Extrapolating past chickens
One of the features of a speculative bubble is the tendency of investors to set their expectations for future investment returns by extrapolating past trends, shifting their focus away from the relationship between prices and the actual cash flows that they can expect their securities to deliver over time. As a result, investors come to believe that investment returns are independent of valuations. Worse, they view past increases in price as signals of future price increases, and as evidence that valuations don’t matter. In my view, there is no way this can end but badly.
When investors examine backward-looking returns, it’s important to understand that there’s virtually no correlation between year-to-year changes in stock prices and year-to-year changes in earnings. That’s not how markets work, because stocks are not a claim on one year of earnings. Rather, stocks are a claim on a very, very long-term stream of cash flows, and the most reliable valuation measures are basically shorthand for a proper discounted cash flow analysis. In turn, that means that when prices grow significantly faster than smooth, representative fundamentals, reliable valuation multiples rise, and future expected returns decline.
So yes, backward-looking returns on passive investments look glorious here. But those backward-looking returns have been achieved by driving valuations on stocks and bonds to historic extremes, and those extremes, in turn, imply that future returns are likely to be rather dismal. The collapse in our estimate of prospective returns for a conventional portfolio mix (60% S&P 500, 30% Treasury bonds, 10% T-bills) is the mirror image of the advance in recent years to hypervalued levels across these asset classes.
Making money in the stock market was now the easiest thing in the world. It was only necessary to buy ‘good’ stocks, regardless of price, and then to let nature take her upward course. The results of such a doctrine could not fail to be tragic.”
– Graham & Dodd, 1934
As I noted in January 2020, and again in recent months, I don’t think it’s terribly useful to imagine there’s some passive investment that will help investors solve the problem created by an “everything bubble,” unless it’s a passive investment in an active discipline. Personally, I prefer to follow a value-conscious, historically-informed, full-cycle discipline that responds to evidence as it changes. Indeed, even amid the most extreme valuations in history, our late-2017 adaptations helped us to have reasonable flexibility in our market outlook amid last year’s volatility.
Nothing demands that investors ‘lock in’ the lowest investment prospects in history. The alternative that investors have is flexibility. The alternative investors have is the capacity to imagine a complete market cycle. The alternative investors have is discipline – the willingness to lean away from risk when it is richly valued and unsupported by uniformly favorable internals, and to lean toward risk when a material retreat in valuations is joined by an improvement in the uniformity of market internals. I have every expectation that we’ll observe such opportunities over the completion of this cycle.
– John P. Hussman, Ph.D., January 2020
The two forms of quantitative easing
This year will mark 40 years that I’ve been involved in the financial markets. I started publishing investment research right out of college, and started my own advisory when I was 22. Those who consider me a “permabear” may be surprised that I was described as a “lonely raging bull” in the early-1990’s, and that I was often leveraged long following the 1990 bear market. I also adopted a constructive outlook after the 2000-2002 collapse, and in late-2008 after the market plunged more than 40%, though that shift was truncated by my insistence on stress-testing our methods against Depression-era data (as I’ve detailed previously). I’ve generally been defensive in the late stages of bull markets. The reason I introduced our measure of market internals in 1988 was to capture a larger portion of those late-stage advances. Still, my defensiveness at market extremes has repeatedly been rewarded over the completion of the cycle. That’s why I often say risk-management is “generous.”
After decades of successfully navigating complete market cycles, my greatest investment mistake (particularly between 2012 and 2017) was to underestimate the extent to which the idea of quantitative easing would infect the minds of investors and abolish their discernment. In market cycles across a century of market history, there was always a “limit” to speculation – points where overvalued, overbought, overbullish syndromes were so extreme that an air-pocket, or panic, or crash would regularly follow. Quantitative easing made those “limits” utterly unreliable, and in late-2017, I finally threw up my hands and prioritized our measures of market internals above those syndromes.
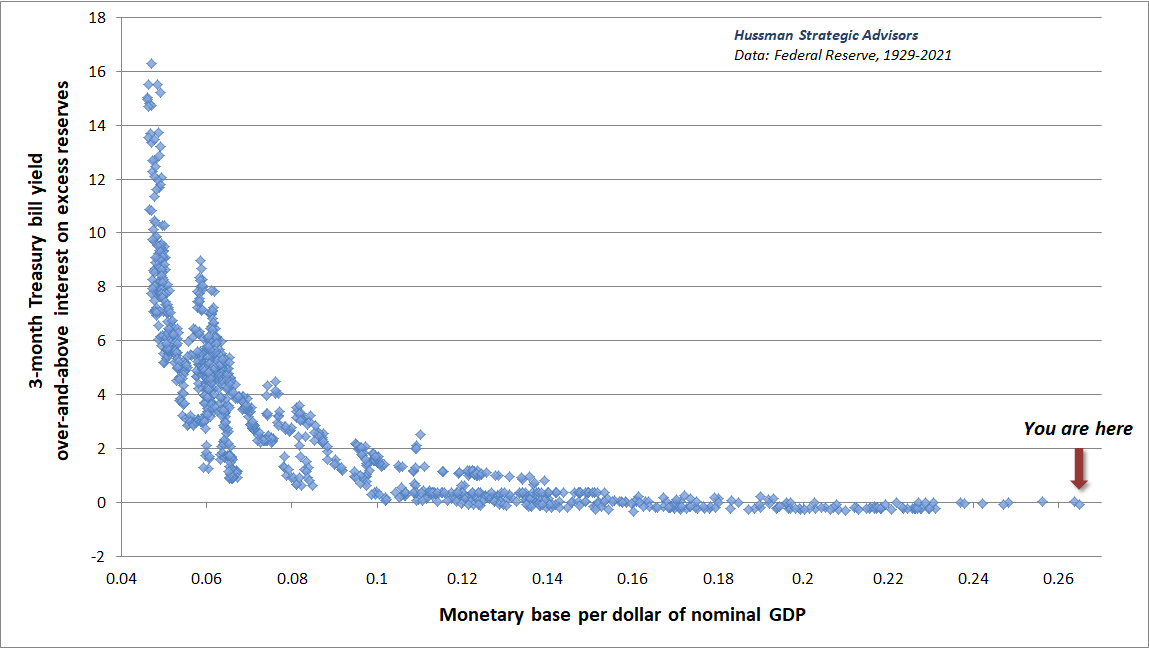
As a policy, quantitative easing is very straightforward: the Federal Reserve buys interest-bearing Treasury securities, and pays for them with zero interest base money (currency and bank reserves) that someone has to hold at every moment in time until that base money is retired.
That’s it. That’s the entire mechanism by which QE has any hope of “supporting” the stock market. Investors become so uncomfortable holding a zero-interest asset that they feel compelled to get rid of it by purchasing some other asset that they imagine will provide them with a better return. The first thing they typically buy is Treasury bills. But create enough of the stuff, and investors will chase other assets too. Unfortunately, the moment the holder of base money buys some other asset, the person who sold it ends up with the zero-interest hot potato. The chart below reflects data since 1929, showing the relationship between the quantity of base money (relative to nominal GDP) and the level of short-term interest rates.
Quantitative easing does nothing more than replace interest-bearing government liabilities with zero-interest government liabilities. That certainly doesn’t seem to be enough to reliably hold $60 trillion of stock market capitalization at the most extreme valuations in history.
That’s exactly what I thought.
My epiphany came in late-2017. I had been so focused on the fact that there’s no reliable mechanism linking the Fed’s balance sheet to the stock market that I had missed one essential fact: investors don’t care. It became clear that there are actually two forms of “quantitative easing,” and the second type of quantitative easing is the powerful one. It’s what my Buddhist teacher Thich Nhat Hanh might describe as a “mental formation.” Using the italic notation of my friend Ben Hunt at Epsilon Theory (a must-read), it’s what we might call Quantitative Easing!
Quantitative Easing! is the product of pure mental perception, distinct from the need for any accurate link to reality. It isn’t constrained by historical evidence or any well-defined “limit.” It exists flawlessly and exclusively in the minds of investors, it is reinforced by constant repetition, and it has only one message: “The Fed holds the market up. Ignore everything else.” Period.
Quantitative Easing! is synonymous with The Fed! These phrases are complete and fully-articulated arguments. They don’t need data. They don’t need a “mechanism.” They don’t need history. The mere words are enough. Their power to support the markets is so obvious to investors that simply referring to them is treated as a mic drop. They rest entirely and victoriously on investor psychology alone. It’s that form of QE that has helped to drive the S&P 500 to valuations that exceed the 1929 and 2000 extremes.
Does anyone think investors care that the total amount of corporate bonds purchased by the Fed during the pandemic amounted to just $14 billion, in a $22 trillion economy, with $11 trillion of nonfinancial corporate debt and $60 trillion of equity securities? No, they do not. Do they care that Fed purchases of unbacked corporate securities were authorized only using CARES funding provided by the Treasury, and that such purchases are otherwise illegal under the Federal Reserve Act? No they do not. Why? Because it isn’t the mechanism of quantitative easing that investors care about. What they care about is Quantitative Easing!
And because Quantitative Easing! is purely a mental formation, the only thing that alters its effectiveness is investor psychology itself.
How do we measure investor psychology?
During the late-1990’s technology bubble, I noted that the main thing that distinguishes an overvalued market that continues to advance from an overvalued market that drops like a rock is the psychological inclination of investors toward speculation or risk-aversion. Since speculation tends to be indiscriminate, I found that the most reliable and observable measure of that psychology was the uniformity of market action across thousands of individual stocks, industries, sectors, and security-types, including debt securities of varying creditworthiness. At the time, I referred to this measure with the phrase “trend uniformity.” It’s what I currently describe with the phrase “market internals.” In prior market cycles, there were definable “limits” to speculation. Once the Fed drove interest rates to zero, responding to those “limits” became useless and detrimental.
The key to navigating Quantitative Easing! and Fed policy in general is to recognize that their effect on the stock market relies almost entirely on speculative investor psychology. See, as long as investors are inclined to speculate, they treat zero-interest money as an inferior asset, and they will chase any asset with a yield above zero (or a past record of positive returns). Valuation doesn’t matter because investors psychologically rule out the possibility of price declines in the first place.
But when investors become risk-averse, even briefly as in early-2018, late-2018, and early-2020, they do allow for the possibility of large negative price changes. At that point, a yield above zero isn’t enough. Moreover, if investors are inclined toward risk-aversion, safe liquidity is viewed as a desirable asset rather than an inferior one. As a result, creating more of the stuff may not support the market at all.
When we examine Fed policy through that lens, it becomes clear how “easy money crashes” like 2000-2002 and 2007-2009 can coexist with “easy money bubbles” as we’ve seen in recent years.
So yes, the Fed matters. Not because quantitative easing, as a policy, is a reliable mechanism that links the balance sheet of the Federal Reserve to the price of the S&P 500. Not because valuations are irrelevant. Not because low interest rates “justify” current valuation extremes. Not even close. Low interest rates can certainly encourage speculation and extreme valuations, but those elevated valuations are still associated with dismal prospective long-term returns.
Rather, the Fed matters because mental formations like The Fed! and Quantitative Easing! are sufficient to amplify behavior that supports the financial markets, provided that investors are inclined to speculate – which is best gauged by the uniformity of market internals.
The policy of quantitative easing “supports” the market only by making investors so uncomfortable holding zero-interest base money that they become willing to bid every other asset to valuations that imply zero or negative future returns. But both the policy of quantitative easing and mental formation of Quantitative Easing! rely on the support of speculative psychology, and run into trouble in periods when investors become risk-averse.
Quantitative Easing! is synonymous with The Fed! These phrases are complete and fully-articulated arguments. They don’t need data. They don’t need a ‘mechanism.’ They don’t need history. The mere words are enough. Their power to support the markets is so obvious to investors that simply referring to them is treated as a mic drop. They rest entirely and victoriously on investor psychology alone. It’s that form of QE that has helped to drive the S&P 500 to valuations that exceed the 1929 and 2000 extremes.
Because Quantitative Easing! is purely a mental formation, the only thing that alters its effectiveness is investor psychology itself. Mental formations like The Fed! and Quantitative Easing! are sufficient to amplify behavior that supports the financial markets, provided that investors are inclined to speculate – which is best gauged by the uniformity of market internals.
Each line in the chart below shows the cumulative total return of the S&P 500 when a given combination of monetary policy and market internals has prevailed. The four conditions are mutually exclusive. While the profiles can change a bit depending on how monetary easing and tightening are defined, the upshot here is that easy money only reliably supports the stock market when investors are inclined to speculate. It’s also worth noting that regardless of whether monetary policy has been easy or tight, the S&P 500 has underperformed Treasury bills, on average, when market internals have been unfavorable.
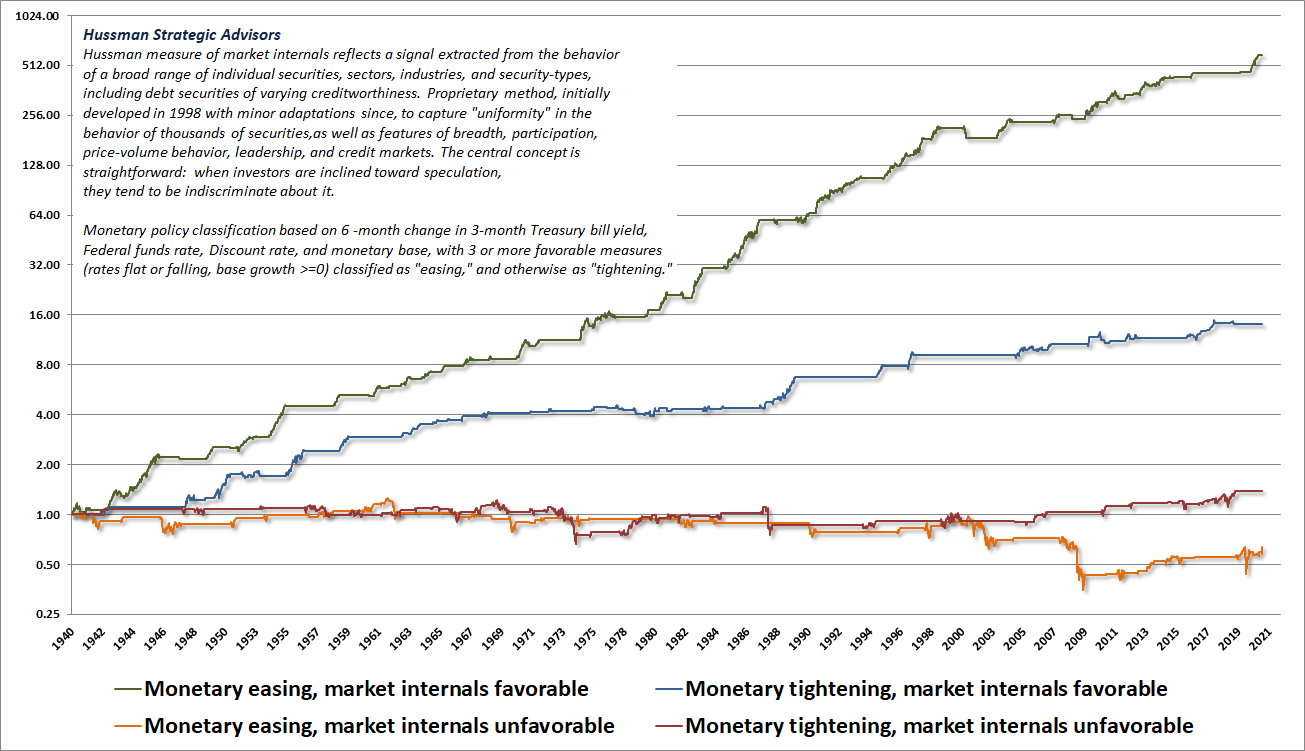
The key element of our late-2017 adaptation was to defer a bearish response to historically reliable overvalued, overbought, overbullish “limits” until we also observe deterioration and divergence in our measures of market internals. Once Quantitative Easing! disabled historically-reliable “limits” to speculation, no incremental adaptation was enough until we completely abandoned adopting a bearish outlook when internals are favorable. It’s fine to be neutral in the face of overextended conditions, but we’ve learned not to fight speculative psychology with bearish positions, regardless of how extreme or ill-informed we might think that speculation might be.
A very long and interesting trip to nowhere
So here we are, at the most extreme valuations in history, beyond the 1929 and 2000 market peaks, largely on the basis of an idea – the psychological confidence that Quantitative Easing! can sustain a permanently high plateau in the financial markets. Whenever uniformly favorable market internals indicate that investors are inclined to speculate, that’s not a condition one should fight. Some conditions may be overextended enough to warrant a neutral stance, but bearish investment stances should be reserved for periods when deteriorating and divergent market internals – which we’ve observed in recent weeks – suggest a subtle or overt shift toward risk-aversion.
Longer term, my view is that all of this will come crashing down. I expect that there will be a brutal end to this delusion intentionally encouraged by a deranged and dogmatic Federal Reserve. Still, it seems unlikely that a restoration of historically reasonable valuations will occur in one fell swoop. Rather, I expect that this overvalued structure will come apart in pieces – during periodic but inevitable episodes when investors become inclined toward risk-aversion. Considerations about valuation, credit risk, corporate leverage, margin debt, and liquidity – that moments before seemed entirely irrelevant – will suddenly matter with a vengeance.
The Fed will undoubtedly fight tooth and nail, but the condition of internals will determine the effect. We will see easy-money melt-ups and easy-money crashes. There will be attempted interventions and stick-saves at every turn, repeatedly punctuated by steep declines and furious recoveries. Why steep? Because at a dividend yield of just 1.4%, the “duration” of the S&P 500 is currently about 70. Even very small changes in long-term expected returns imply strikingly high price volatility.
Given that the market can go from extreme overvaluation to undervaluation even over a small number of years, the long-term prospects of the market could look vastly stronger even a couple of years from today. So keep in mind that these statements all reflect the starting point of current valuation extremes.
From this particular starting point, I expect that the S&P 500 will go nowhere for something approaching 20 years.
I realize that the last sentence was accompanied by a collective “pffft” of spit-takes, followed by the spray of coffee on computer screens everywhere. About 80% of those spit-takes were probably accompanied by incredulous laughter, and about 20% by the recognition, among those who understand market history, that I’m completely serious.
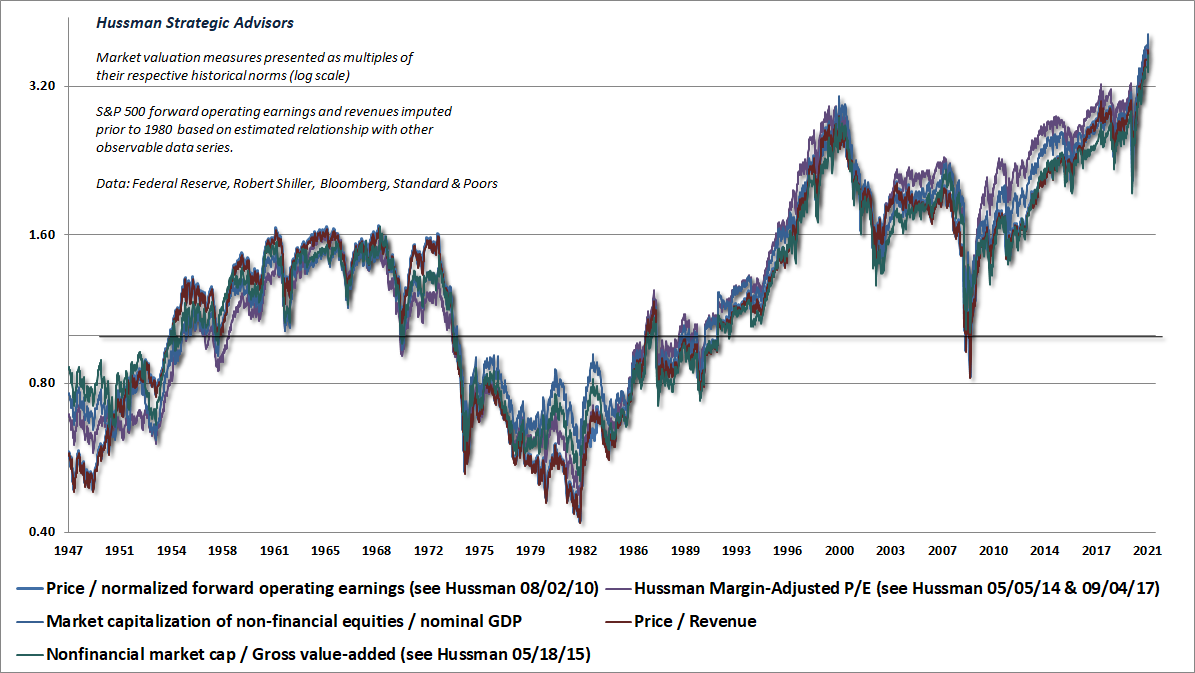
Presently, the valuation measures we find best-correlated with actual subsequent S&P 500 total returns across history stand at 3.7 times their run-of-the-mill norms. Let’s ignore that the market has also spent half of its time below those run-of-the-mill norms.
Given that valuations revisited their historical norms even 12 years ago, what would happen if valuations were simply to revisit their run-of-the-mill norms two decades from today? Do the math: (1/3.7)^(1/20) would imply a drag of roughly -6.3% annually on total returns that would have to be made up by nominal growth and dividend income. On that front, over the past 20 years, the growth rates of S&P 500 revenues and nominal GDP have averaged just 4% annually. The dividend yield on the S&P 500 is currently down to just 1.4%.
From this particular starting point, I expect that the S&P 500 will go nowhere for something approaching 20 years.
Recall that the S&P 500 lagged Treasury bills during the 18-year period from August 1929 to May 1947, and during the 21-year period from November 1961 to October 1982, and during the 13-year period from March 2000 to April 2013. That’s 52 years out of an 84-year span. It’s just what happens when valuations become extreme.
While it’s true that valuation levels have generally been above their historical norms during the bubble period since the late-1990’s, the essential thing to recognize is that the mapping between valuations and subsequent returns has not changed. Elevated valuations have still implied subsequent returns below their historical norms. Depressed valuations have still implied subsequent returns above their historical norms. The attempt to “de-trend” valuations, as if they should naturally increase over time, is identical to saying that market returns should progressively deteriorate over time.
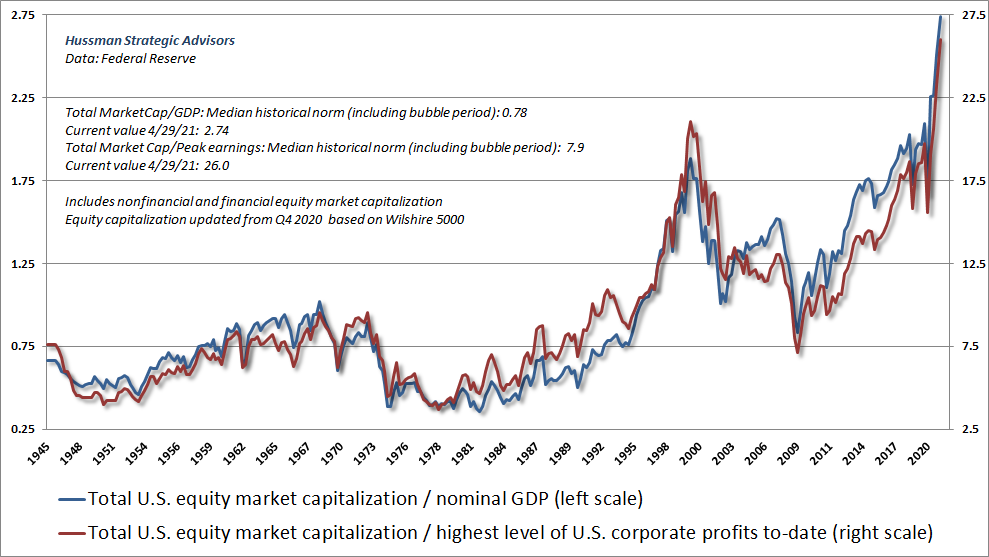
Note that current extremes aren’t just an artifact of using price/revenue ratios. If one compares total U.S. equity market capitalization to the highest level of U.S. corporate profits to-date, at every point in time, the same extreme is evident here.
Fortunately, even if the market goes nowhere over the coming 20 years, it will likely go nowhere in a very interesting way. Examine the period between April 1995 and March 2009. The total return of the S&P 500 did no better than Treasury bills, but the period also included two bubbles and two crashes. We’ll be just fine, as long as we draw the right lesson from recent years. The lesson isn’t that valuations are irrelevant. The lesson isn’t that prices always quickly get back to their highs. The lesson is that valuations matter, but so too does investor psychology – and we have tools to gauge and navigate both of them.
Regardless of the path that the markets take during this very long trip to nowhere, I expect that there will be enormous opportunities in the interim for a flexible, value-conscious, historically-informed, full-cycle investment discipline that responds to observable changes in valuations, market internals, and other factors as they shift.
On the relationship between Fed policy, fiscal deficits, and inflation
Amid current extremes, it may be particularly useful to examine how Fed policy, fiscal deficits, and inflation prospects are linked. Considering them together provides a “big picture” framework that can inform our expectations.
A frequent question about Fed policy is why all of this quantitative easing hasn’t produced inflation. The answer is that quantitative easing alone isn’t inherently inflationary. QE just changes the mix of government liabilities held by the public. The Fed buys interest-bearing Treasury securities and replaces them with zero-interest base money. The change just causes a readjustment in short-term interest rates, to a level where investors are willing to hold the existing quantities of both of them.
In equilibrium, every security that has been issued has to be held by someone, at every moment in time, until that security is retired. It’s fiscal policy that determines the overall quantity of government liabilities issued to the public, and that must be held by the public. Monetary policy just determines whether those liabilities are interest-bearing or not.
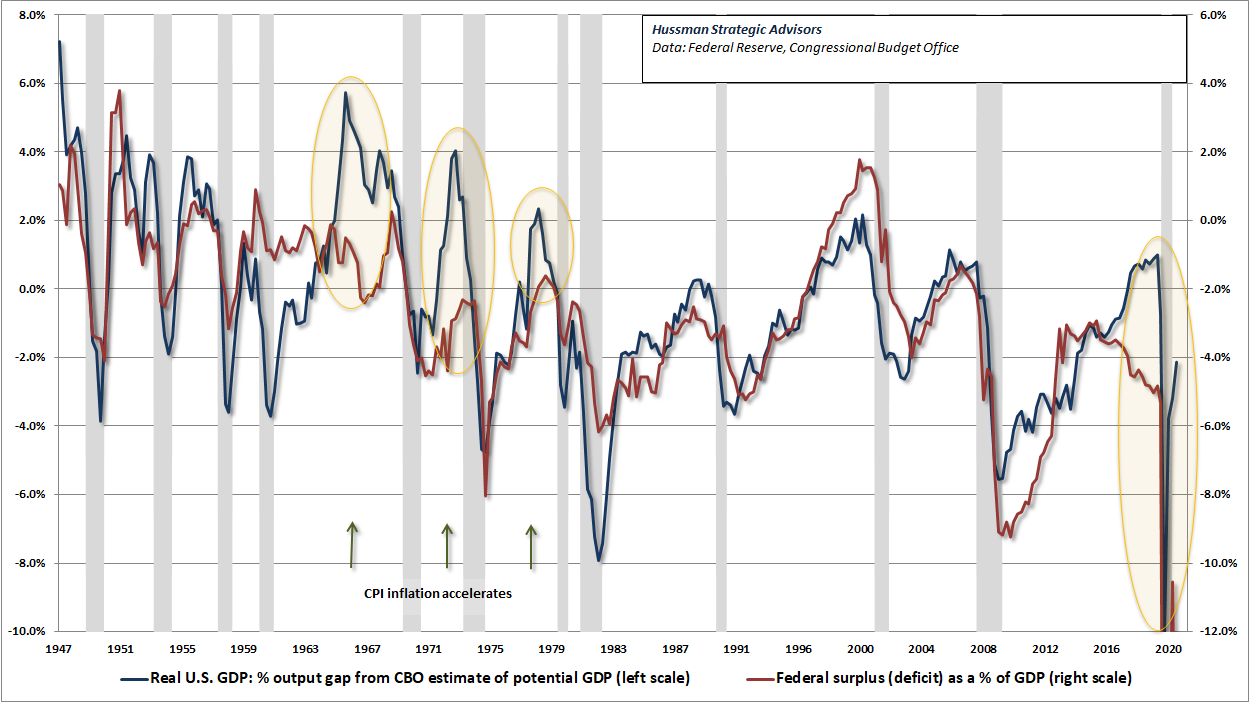
What triggers revulsion and inflation is a public loss of confidence that the total quantity of government liabilities will be restrained, relative to the real economy. That could become a problem if the private economy doesn’t recover quickly enough to substitute for the federal deficit of nearly 20% that has propped up economic activity over the past year. Moreover, the increasing tendency to resort to deficit spending was apparent even in 2019, at the peak of the last economic recovery. That year, the federal government ran a deficit amounting to 4.7% of GDP. Since World War II, a deficit of that size was seen only at recession lows, particularly during the global financial crisis – certainly not at the peak of a recovery. From that standpoint, the deficits of recent years have increasingly been what I describe as “cyclically excessive.”
As the chart below illustrates, one should certainly expect larger deficits in periods that the economy is depressed. But if the deficits persist even as GDP approaches or exceeds potential (a figure regularly estimated by the CBO), inflation pressure often follows. The reason is that inflation has an enormous psychological component, and tends to emerge, seemingly out of nowhere, at points where public confidence in long-term fiscal stability, and thus monetary stability, begins to erode.
Put another way, what triggers inflation is the belief that the central bank isn’t just changing the mix of government liabilities, but that it has instead become a tool for financing an increasing quantity of deficit-financed government spending. Here’s how Nobel economist Thomas Sargent (also my dissertation advisor at Stanford) has described this dynamic:
In each case that we have studied, once it became widely understood that the government would not rely on the central bank for its finances, the inflation terminated and the exchanges stabilized. We have further seen that it was not simply the increasing quantity of central bank notes that caused the hyperinflation. Rather, it was the growth of fiat currency which was unbacked, or backed only by government bills, which there never was a prospect to retire through taxation.”
– Thomas J. Sargent
With regard to deficit spending, my view is that not all deficits are the same, and that one’s evaluation of the spending can’t be separated from the question of what is being funded. I’m actually much more in favor of targeting sustainable infrastructure, education, and other objectives than I was with untargeted “stimulus checks” and other spending over the past year, which often had no particular link to whether the recipient had experienced any economic harm from the pandemic. In my own policy advice, I had argued for a more deliberate response targeted toward those who actually suffered “economic damage.” We got some of that, but frankly, it was a fight to get some legislators to agree to any oversight at all.
In recent months, we’ve seen early pressures on commodity prices, inflation breakevens, long-term yields, and other measures that suggest emerging concern about inflation pressure. Presently, the monetary base stands at 26% of nominal GDP, which is far more than necessary to hold short-term interest rates near zero. Even if we observe higher inflationary pressure, that alone seems unlikely to press short-term interest rates higher unless a) the Fed explicitly raises short-term rates by paying interest to banks on their excess reserves, or b) some combination of numerator and denominator reduces the ratio of the monetary base / nominal GDP to something closer to 9%. So if inflation emerges, we’re likely to see the yield curve steepen sharply, with real short-term interest rates becoming more negative, which tends to be favorable for commodities and precious metals. As usual, no forecasts are necessary. We’ll respond to the evidence as it emerges.
As for future policies, aside from targeting productive investment, it would be useful for policy makers – especially those at the Federal Reserve – to recognize that overvalued securities do not represent “wealth.” At best, driving security prices to hypervalued levels enables the holder to obtain a wealth transfer by selling the security to someone else who will be stuck holding the bag. The true value of any security isn’t embodied in the market price, but in the future stream of value-added production and resulting cash flows that will be delivered to the holder of that security over time. Jacking up valuations does nothing to alter economic productivity, nor those resulting cash flows. It simply sets the financial markets up for future crises, and existing holders up for depressed future investment returns.
When one nets out all the assets and liabilities in the economy, the only thing left – the true basis of a society’s net worth – is the stock of real investment that it has accumulated as a result of prior saving, and its unused endowment of resources. Everything else cancels out because every security represents an asset of the holder and a liability of the issuer. Conceptualizing ‘saved or unconsumed resources’ as broadly as possible, the wealth of a nation consists of its stock of real private investment (e.g. housing, capital goods factories), real public investment (e.g. infrastructure), intangible intellectual capital (e.g. education, inventions, organizational knowledge and systems), and its endowment of basic resources such as land, energy, and water. In an open economy, one would include the net claims on foreigners (negative, in the U.S. case). Understand that securities are not economic wealth. They are a claim of one party in the economy – by virtue of past saving – on the future output produced by others.”
– John P. Hussman, Ph.D., Stock-Flow Accounting and the Coming $10 Trillion Paper Loss
Public health note
Finally, after a year that has often resembled an excruciating, predictable, slow-motion train wreck, I’m relieved to share the very positive and hopeful situation regarding the COVID-19 pandemic in the United States. The chart below shows the Hussman Foundation projection of 7-day U.S. fatalities. In January, this trajectory was heavily dependent on sustained containment practices and a successful vaccination program. Fortunately, both of these have actually occurred, bringing down the rate of transmission even for novel variants with higher infectivity.
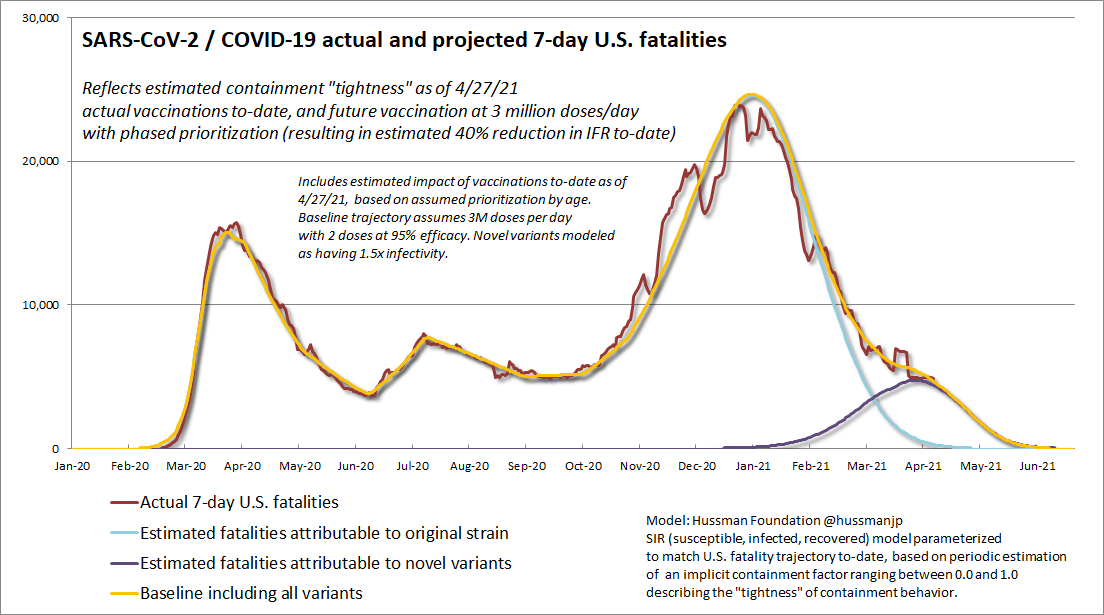
The way to think about this is that the initial “base” reproductive rate of the original variant of SARS-CoV-2 was close to 2.6 (new infections resulting from each new case, assuming a fully susceptible population and unrestricted person-to-person interactions). The more transmissible novel variants have a reproductive rate about 1.5x higher. It’s that brutally high transmissibility coupled with limited vaccine access that has decimated countries like Brazil and India, even in the face of containment practices like distancing, smaller groups, mask use, and reduced interactions in indoor public spaces.
In the U.S., we’ve held at an estimated containment “tightness” of about 0.5 since November, meaning that the combination of these containment practices has reduced the number of person-to-person contacts, and the likelihood that these contacts will be infective, by about 50%. At the same time, the combination of past infection and vaccination has reduced the susceptible share of the population to just over 40%.
The result of all of this is that Rt, the current reproductive rate of novel variants in the U.S., is now about 2.6×1.5×0.5×0.4 = 0.8. That figure, finally and happily below 1.0, has been enough to turn the trajectory of this pandemic lower, even for the more infective variants.
Given that vaccinations have prioritized high risk groups, we can reasonably project that the COVID-19 pandemic will be effectively over in the U.S. by early July – provided that vaccinations continue somewhere near the recent pace, and that containment practices don’t relax too strongly before mid-June. In any event, I do believe that the worst of this pandemic is behind us, at least in the United States. My hope is that we take this progress with enough gratitude to turn our attention toward helping the rest of the world.
Keep Me Informed
Please enter your email address to be notified of new content, including market commentary and special updates.
Thank you for your interest in the Hussman Funds.
100% Spam-free. No list sharing. No solicitations. Opt-out anytime with one click.
By submitting this form, you consent to receive news and commentary, at no cost, from Hussman Strategic Advisors, News & Commentary, Cincinnati OH, 45246. https://www.hussmanfunds.com. You can revoke your consent to receive emails at any time by clicking the unsubscribe link at the bottom of every email. Emails are serviced by Constant Contact.
The foregoing comments represent the general investment analysis and economic views of the Advisor, and are provided solely for the purpose of information, instruction and discourse.
Prospectuses for the Hussman Strategic Growth Fund, the Hussman Strategic Total Return Fund, the Hussman Strategic International Fund, and the Hussman Strategic Allocation Fund, as well as Fund reports and other information, are available by clicking “The Funds” menu button from any page of this website.
Estimates of prospective return and risk for equities, bonds, and other financial markets are forward-looking statements based the analysis and reasonable beliefs of Hussman Strategic Advisors. They are not a guarantee of future performance, and are not indicative of the prospective returns of any of the Hussman Funds. Actual returns may differ substantially from the estimates provided. Estimates of prospective long-term returns for the S&P 500 reflect our standard valuation methodology, focusing on the relationship between current market prices and earnings, dividends and other fundamentals, adjusted for variability over the economic cycle.