

Maladaptive Beliefs


John P. Hussman, Ph.D.
President, Hussman Investment Trust
September 2021
An investment operation is one which, upon thorough analysis promises safety of principal and an adequate return. Operations not meeting these requirements are speculative. The distinction between investment and speculation in common stocks has always been a useful one and its disappearance is a cause for concern. In most periods the investor must recognize the existence of a speculative factor in his common stock holdings. It is his task to keep this component within minor limits, and to be prepared financially and psychologically for adverse results that may be of short or long duration.
There is intelligent speculation as there is intelligent investing. But there are many ways in which speculation may be unintelligent. Of these the foremost are: (1) speculating when you think you are investing; (2) speculating seriously instead of as a pastime, when you lack proper knowledge and skill for it; and (3) risking more money in speculation than you can afford to lose.
– Benjamin Graham, The Intelligent Investor
Among the most persistent questions I hear is why we don’t just adapt to the reality that the Federal Reserve will never again “allow” the market to experience a serious decline. The problem with this view is that it rests on the premise that Federal Reserve policy supports the market in a clear-cut and mechanical way, when its effectiveness actually relies on the speculative psychology of investors.
We can certainly concede, and indeed must concede, that replacing a mountain of interest-bearing Treasury bonds with a mountain of zero-interest base money can both manipulate and disfigure investor psychology. It’s a simple fact that once a dollar of base money has been created, someone in the economy must hold it at every moment in time, in the form of base money, until that base money is retired. Provided investors are inclined to speculate (so that they rule out the potential for meaningful capital losses), the discomfort with zero-interest base money encourages each successive holder to chase riskier securities that they imagine will provide them with a positive and higher return.
Each time a buyer puts the base money “into” the stock market, a seller takes it right back “out” – just like a hot potato. The zero-return base money has simply changed hands. The thing that “holds the stock market up” isn’t zero-interest liquidity, at least not in any mechanical way. It’s a particularly warped form of speculative psychology that rules out the possibility of loss, regardless of how extreme valuations have become. We’ve never seen this much zero-interest base money before, but we certainly have seen the speculative psychology it relies on, and it has always ended in tears.
Lower rates and moral hazard will raise the price of assets. No one was a bigger friend of the stock market than Greenspan. He did race to the rescue when it finally lost air. The S&P 500 went down 50%, but it only hit long-term trend, and it didn’t stop the Nasdaq from dropping 82%. Bernanke completely didn’t see the housing bubble and the risk it posed. He said ‘The U.S. housing market has never declined.’ It had never declined because it had never had a bubble before. Hyman Minsky lives: you create a situation like that and it will eventually burst of its own weight. The housing market went back all the way to trend and below, which was a dreadful hit. It created so much chaos, and it carried the stock market down with it, again 50% on the S&P. These are not small declines, and yet they occurred in the face of passionate defenders and promoters of moral hazard. They all talk a wonderful game that they’ll be a friend of asset class pricing. And yet it didn’t stop two of the biggest wipeouts in American history.
The most impressive thing here is not that they do the same thing over and over again as if they have somehow no memory. It’s the faith the financial community has in them, despite the fact that they’ve been let down badly twice. These were not insignificant setbacks. The tech crash was brutal. The housing bust was merciless. And yet, it’s as if it never happened. Hey. Greenspan was our friend. Bernanke was our friend, and we got croaked, guys! What is the matter with you? The Federal Reserve simply does not understand the risks of asset price bubbles and asset price collapse. It is clear from the data they don’t get it. We apparently never see that. We’re willing to look through the crash.
– Jeremy Grantham (slightly abridged), The Top of the Cycle, August 19, 2021
It’s terribly dangerous to assume that the prevailing extreme of speculative psychology is permanent. In our work, the most reliable gauge of whether investors lean toward speculation or risk aversion is the uniformity of market internals across thousands of stocks, industries, sectors, and security types, including debt securities of varying creditworthiness. When investors are inclined to speculate, they tend to be indiscriminate about it. Across a century of market cycles, including the peak-to-peak market cycle from 2007 to the recent market highs, the entire gain of the S&P 500 in excess of Treasury bills has occurred in periods when our primary gauge of market internals has been favorable, while the deepest market losses, including those in the recent market cycle, have occurred when they were not.
Amid the most extreme valuations in history, we’ve observed gradual deterioration in our measures of internals in recent months, with breakdowns among individual stocks in the broad market accelerating in recent weeks. For that reason, our present investment outlook can be classified as clearly defensive. Yet that outlook will also ease immediately if our measures of market internals were to improve. We would expect to adopt at least a moderately constructive outlook if the improvement in market internals follows a material retreat in valuations – even one that takes valuations nowhere near historical norms.
A quick note – my friend Grant Williams is one of the broadest thinkers in the financial markets. After years of publishing Things That Make You Go Hmmm…, he has launched a new channel – www.grant-williams.com – that includes his insightful newsletter, podcasts with interesting and sought-after guests, and beautifully produced long-form video interviews. I was honored to join Grant for Episode 1 of the video launch – our conversation spans over two hours, and was great fun. Grant takes this work seriously, and puts his heart and soul into it. I’ve got no question that the value his subscribers draw from all of this content each month will easily be worth the subscription.
Maladaptive beliefs
To be clear, there’s no question that persistently deranged and activist Federal Reserve policy has required investors to adapt. But the form of that adaptation is crucial. Passively and uncritically assuming that Fed policy has created a “permanently high plateau” for the market ignores the purely psychological way that Fed policy encourages speculation; the measures that can be used to gauge that psychology; and the vulnerability to market loss that can and does emerge when investor psychology shifts – even briefly – toward risk aversion.
The thing that ‘holds the stock market up’ isn’t zero-interest liquidity, at least not in any mechanical way. It’s a particularly warped form of speculative psychology that rules out the possibility of loss, regardless of how extreme valuations have become.
The main adaptation that deranged Federal Reserve policy required of our own discipline in this cycle was to abandon our pre-emptive bearish response to historically-reliable “limits” to speculation, and to instead prioritize the condition of market internals (which have been part of our discipline since 1988). Essentially, we became content to gauge the presence or absence of speculation or risk-aversion, without assuming that there remains any well-defined limit to either.
A more recent – though minor – adaptation has been to adopt a slightly more “permissive” threshold in our gauge of market internals when interest rates are near zero and certain measures of risk-aversion are well-behaved. This does nothing to change our current investment outlook, but given that we use market internals to gauge speculative psychology, a more permissive threshold captures the idea that tossing deranged Fed policy into the mix boosts the implications of a given improvement in market internals. The main effect is to promote a more constructive shift following material market losses.
Importantly, Fed easing does not reliably benefit the stock market if measures of risk-aversion are increasing. In that environment, investors treat safe, low-interest liquidity as a desirable asset – not as an inferior one. So as we saw during the 2000-2002 and 2007-2009 collapses, creating more of the stuff doesn’t reliably provoke speculation.
Again, the question isn’t whether one should adapt to unprecedented Fed policies, but instead, the form those adaptations should take. It is unimaginable that investors have swallowed the premise of “Fed support” whole. It is a profound mistake for investors to “adapt” so unconditionally. Investors seem convinced that the Fed has removed downside risk from the market. Instead, we are fully convinced that these historic valuation extremes have removed decades of investment returns from the future, and strongly suspect that the Fed has amplified future downside risk as well.
Still, our research efforts in recent years have focused on adaptations that can allow us to better tolerate and even thrive in a world where valuations might never again retreat to their historical norms. We don’t actually expect that sort of world, but have allowed for it. These adaptations basically amount to criteria for accepting moderate amounts of market exposure – coupled with position limits or safety nets that constrain risk – even in conditions where valuations imply poor long-term returns. These criteria fall into what Graham would describe as “intelligent speculation” – kept within minor limits.
We’ve already benefited from some of this research, particularly since early 2020, and I expect the impact will become far more evident over time, especially at points where a material retreat in valuations – though possibly nowhere near historical norms – is joined by certain improvements in our gauges of market action. As usual, we’ll allow the data to determine those shifts.
The question isn’t whether one should adapt to unprecedented Fed policies, but instead, the form those adaptations should take. It is unimaginable that investors have swallowed the premise of ‘Fed support’ whole. Investors seem convinced that the Fed has removed downside risk from the market. Instead, we are fully convinced that these historic valuation extremes have removed decades of investment returns from the future, and strongly suspect that the Fed has amplified future downside risk as well.
In short, it’s one thing to allow for the possibility that valuations will never again revert to their historical norms. It’s entirely another thing to place oneself in a position that relies on that outcome, in the mistaken belief that one has simply “adapted” to a new world. In my view, many investors have unnecessarily chosen the second path. At best, I believe they’ve placed themselves in a position that is likely to be rewarded by a very long, interesting trip to nowhere over the coming 10-20 years. At worst, they may discover the hard way that a retreat merely to historically run-of-the-mill valuations really does imply a two-thirds loss in the S&P 500. As usual, however, no forecasts are required. It is enough to align our investment stance with prevailing market conditions as they change over time.
As for blindly abandoning attention to valuations and market internals, in the maladaptive belief that Fed liquidity somehow places a “floor” under the market, I’ll leave those concessions to those with absurdly short memories.
When the music stops, in terms of liquidity, things will get complicated. But as long as the music is still playing, you’ve got to get up and dance.
– Chuck Prince, CEO, Citigroup, July 2007
Citigroup had already peaked 7 months earlier. From July 2007 to March 2009, the stock lost 98% of its value. The Fed eased aggressively the whole way down. The critical mistake, in my view, was to assume that “liquidity” somehow mechanically supports the financial markets, and to overlook how much that so-called “support” relies on speculative psychology.
[facepalm]Back to Chuck Prince a couple of decades ago, the music is still playing, and it gets very expensive if you stop dancing early.
– CNBC panelist
I like the old reference to the Citigroup CEO from a few decades ago – pulling one out of the hat there!
– CNBC anchor, September 3, 2021
Valuation update
In prior market cycles, including the 2000 and 2007 peaks, attending to the combination of valuations and market internals has been the most reliable way we’ve found to navigate both speculative bubbles and risk-averse collapses. In the recent cycle, our main difficulty was to rely on historically-reliable “limits” to speculation. Our main adaptation was simply to become content with attending to the combination of valuations and market internals – just without assuming that speculative or risk-averse investor psychology still has limits. I do believe that we can tolerate and even thrive in a world where valuations might never again retreat to their historical norms.
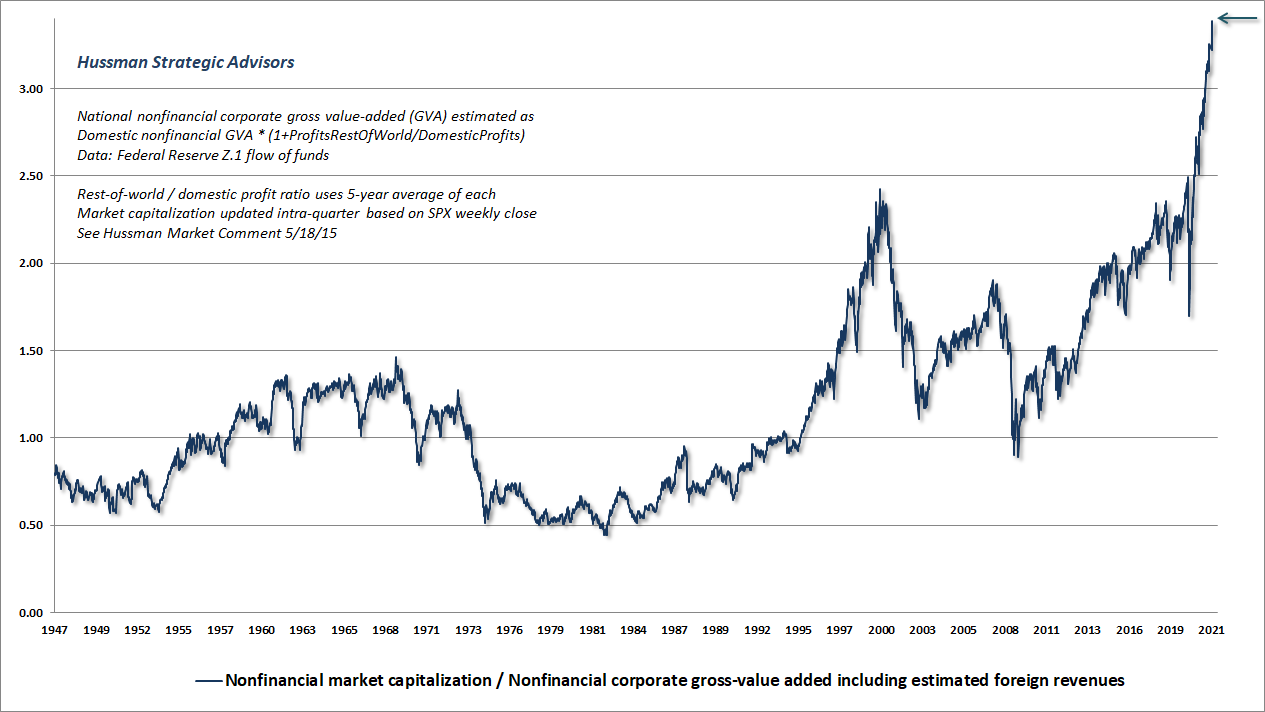
Still, because we don’t rely on that sort of permanently high plateau, it’s critical to understand just how extreme valuations have become. The chart below shows the valuation measure that we find best correlated with actual subsequent S&P 500 total returns over a century of market cycles: the ratio of nonfinancial market capitalization to corporate gross-value added, including estimated foreign revenues.
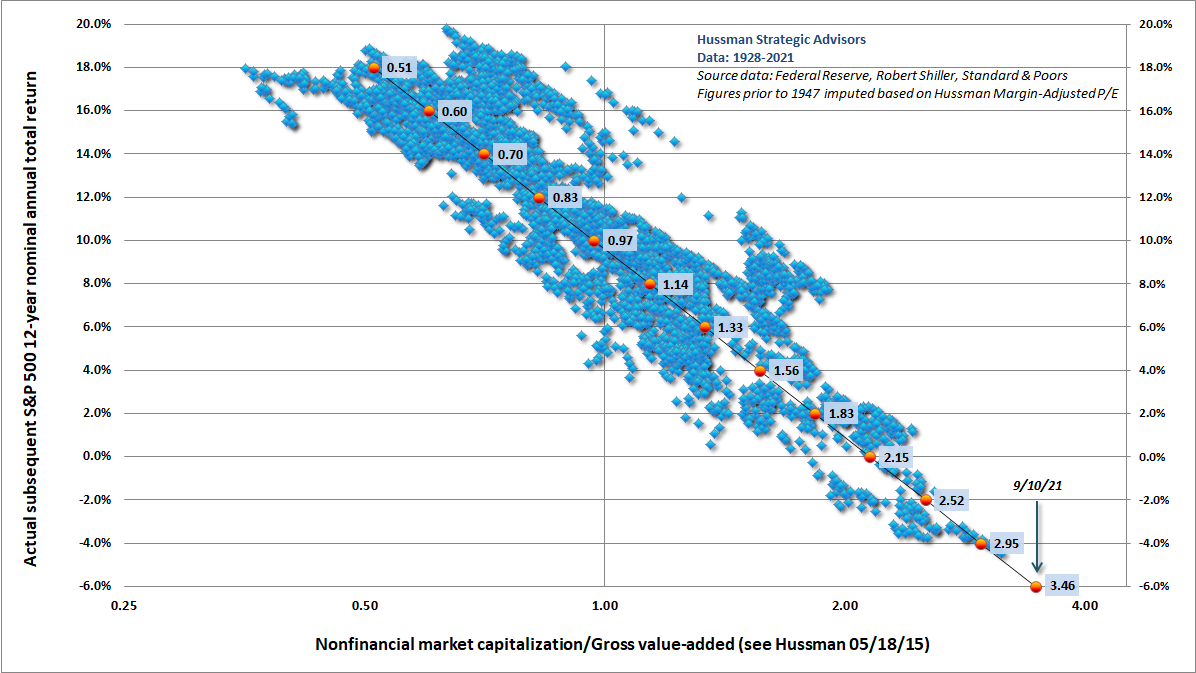
The plot below shows the log of MarketCap/GVA versus actual subsequent 12-year S&P 500 total returns across history. We don’t yet know the actual subsequent 12-year return, but given the current extreme, investors would require a rather large positive “error” simply for that total return to be zero.
An investment security is nothing more than a claim to some expected stream of future cash flows. Elevated valuations do two things: they reduce the long-term return that one can expect from a given stream of future cash flows, and they increase investment duration – the sensitivity of prices to small changes in expected return. Depressed valuations create a margin of safety in the form of higher expected return and lower duration. Extremely elevated valuations do exactly the opposite.
When the public woke up to the historical merits of common stocks as long-term investments, they soon ceased to have any such merit, because the public’s enthusiasm created price levels which deprived them of their built-in margin of safety, and thus drove them out of the investment class. Then, of course, the pendulum swing to the other extreme, and we soon saw one of the most respected authorities declaring (in 1931) that no common stock could ever be an investment. Precisely because the old-time investor did not concentrate on future capital appreciation he was virtually guaranteeing to himself that he would have it. And, conversely, today’s investor is so concerned with anticipating the future that he is already paying handsomely for it in advance. Thus what he has projected with so much study and care may actually happen and still not bring him any profit. If it should fail to materialize to the degree expected he may in fact be faced with a serious temporary and perhaps even permanent loss.
– Benjamin Graham, The New Speculation in Common Stocks
How does inflation play into all of this? Well, if inflation rises, particularly if the Fed loses control amid the highest ratio of Federal debt/GDP since World War II, it will likely be hostile – not favorable – for even nominal market returns. That’s because rising inflation has typically crushed market valuations. The benefit of inflation in boosting nominal growth typically supports stock prices only after valuation multiples collapse. Alternatively, given that the structural growth rate of real GDP (which I define as real GDP growth excluding the impact of fluctuations in the unemployment rate) has gradually declined in recent decades to just 1.6%, low future inflation would imply low nominal growth, in which case low interest rates don’t actually “justify” a valuation premium at all. Nearly every non-Goldilocks assumption implies disappointment.
Hypervalued bubbles create their own needles, which become increasingly difficult to thread without an unfortunate outcome. As I noted at the 2000 peak,
In recent months, we have made the rather bizarre assertion that the Nasdaq is likely to lose somewhere between 65% to 83% of its value from its recent highs to its ultimate bottom. Every security price effectively boils down to assumptions about 1) expected future growth rates, and 2) the expected long-term return. Those expectations are embedded in the valuation multiple of the stock. A high valuation multiple may imply either unusually high growth expectations, or the willingness to accept very low long-term rates of return. But an excruciatingly high valuation multiple almost by necessity implies both. In a bubble, those two factors become completely detached from reality, and expectations about future returns become increasingly reinforced not by fundamentals but by price action alone. At some point, the difference between the price and plausible future cash flows becomes too great. A bubble can only persist as long as investors don’t focus too closely on that reality.
– John P. Hussman, Ph.D., April 7, 2000
Good news and not-so-good news
Having devoted much of period since early-2020 to pandemic-related research and policy efforts as part of the work of the Hussman Foundation, many of these market comments have included a public health note. As I detail in the one at the end of this comment, I believe we’ve reached the peak of the Delta wave, which has remained the most infectious SARS-CoV-2 variant of concern. Caution will still be important for several more weeks, but I expect a clear retreat in the pandemic trajectory here, and this would be remarkably good news.
The not-so-good news is that from an economic standpoint, investors seem to have little appreciation of the extent to which trillions of dollars in Federal pandemic relief funds have supported the economy, and the contribution that these deficits have made to household savings, corporate profits, and the financing of record trade deficits in recent quarters. Even the deficit contemplated in existing budget legislation comes nowhere near replacing this impact. So a recovery in the private economy will have to pick up the slack just to hold steady. On that point, U.S. nonfarm employment is still 5 million jobs short of what it was before the pandemic, and both extended unemployment benefits and eviction protections have just come off.
The chart below shows how equilibrium has worked during the pandemic, and across history. Every deficit of government has a mirror-image surplus in other sectors, and shows up as an excess of income over consumption and net investment among a) households, b) corporations, and c) foreign countries.
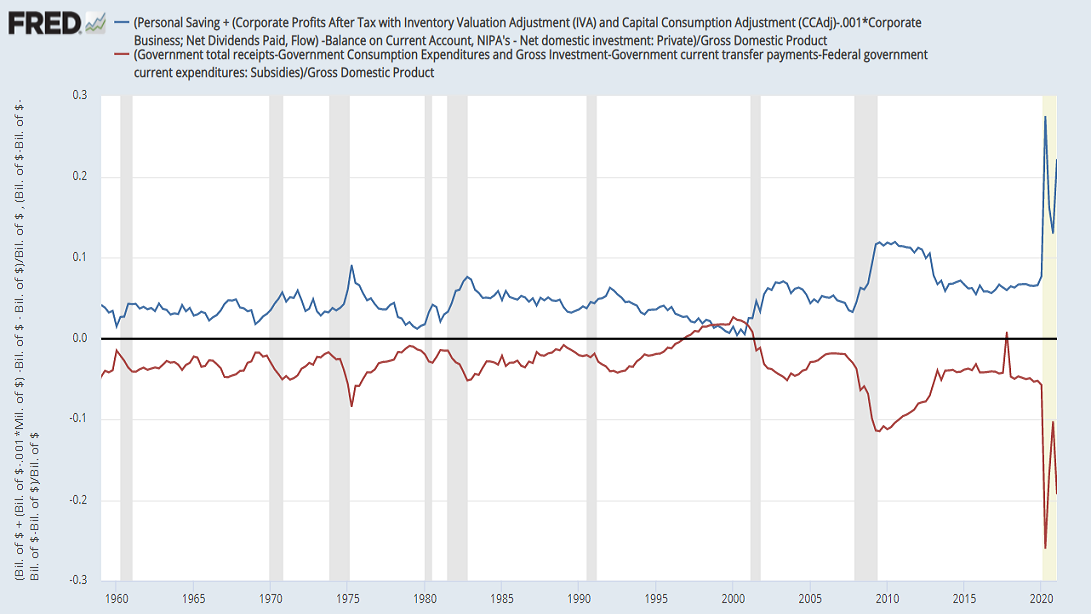
In short, private economic activity should improve markedly as this pandemic subsides, but that activity will replace, not augment, the impact of trillions in deficit spending that is going away. It’s not at all clear that gross economic activity will increase. As the size of the Federal deficit declines from its extraordinarily high level, we may see much greater pressure on household savings and corporate profits than Wall Street seems to assume.
Private economic activity should improve markedly as this pandemic subsides, but that activity will replace, not augment, the impact of trillions in deficit spending that is going away.
Another thing to keep in mind is that the moment the government runs a deficit, the Treasury issues a liability in the form of Treasury debt. If the Federal Reserve buys that Treasury debt, the liability instead shows up as base money (bank reserves or currency). In equilibrium, the new savings of households, corporations, and foreign countries must be held in the form of the new liabilities that the government has issued. They can’t become anything else – they will stay in the form they were issued until they are retired.
So understand that the stuff people call “cash on the sidelines” is there precisely because the Treasury and the Federal Reserve put it there, and it must be held by someone, in its original form, at every moment in time. It’s not “going” anywhere or into anything. It’s already there. All it can do is change hands.
Investors have come to rely on the “hot potato” effect of zero-interest money to provoke speculation. But they forget periods like 2000-2002 and 2007-2009, when safe liquidity became a desirable asset rather than an inferior one. It’s not zero-interest money itself, but only the psychological revulsion to zero-interest money, that has “supported” valuations. When investors become risk-averse, that bet can come off rather quickly.
As usual, no forecasts are actually necessary here. We’ll respond to shifts in valuations, market internals, and other measures as they emerge. Still, it’s useful to consider the possibility that even enormously good news for public health may not translate into particularly favorable outcomes for the overall economy.
Public health note
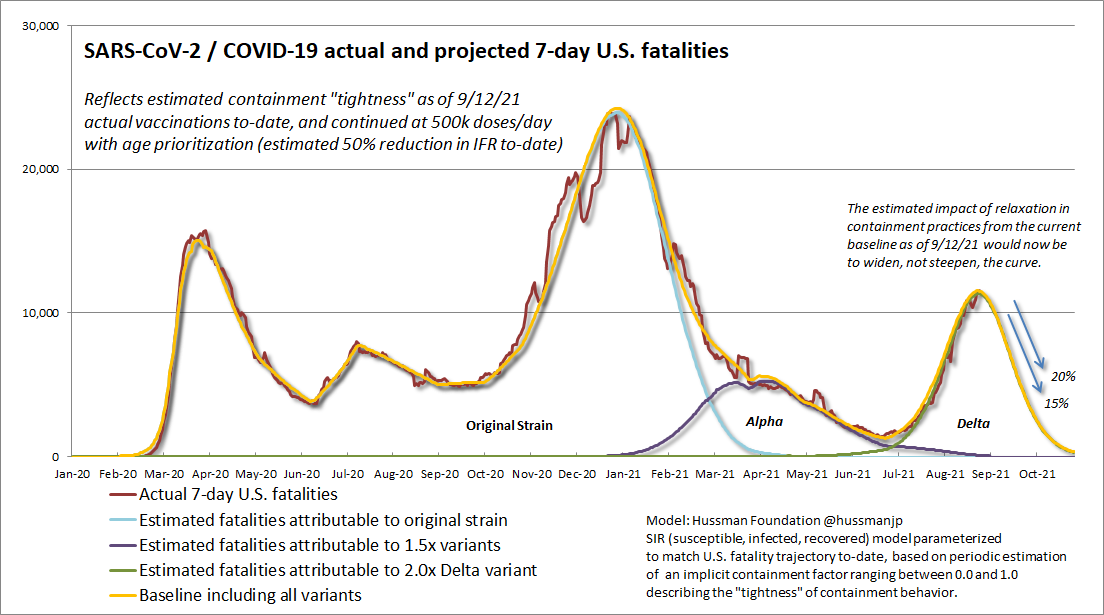
While the circulating level of SARS-CoV-2 is still quite high, and caution will be important for at least several more weeks, I’m pleased to share our latest projections (Hussman Foundation) for the COVID-19 pandemic. The chart below updates our projection of U.S. 7-day fatalities. As I noted in July, the high infectivity of the Delta variant has made this part of the pandemic very sensitive to small changes in behavior. The recent Delta wave could have been largely avoided, and was steeper than it needed to be, because of a combination of relaxed containment practices and vaccine hesitancy. Even so, I believe that we’ve now passed the peak. We have to stay alert for other potential variants of concern, but as I’ve noted since February of last year, all of this is fairly straightforward – though sometimes brutal – arithmetic.
Why do we expect the curve to turn down here? Pick any positive number and square it. Now raise it to the third power, the fourth, and so on. If you picked a number greater than one, you got increasingly larger results. If you picked a number smaller than one, you got progressively smaller results. That’s exactly how a pandemic spreads or retreats. Each generation of infection is like raising a number to successive powers. In a pandemic, the critical figure is “R” – the number of additional infections that can be expected as a result of each new case.
In a nutshell, we estimate that the “reproductive rate” Rt has just dropped below 1.0.
At the beginning of a pandemic, when the entire population is susceptible and no containment measures are in place, each new case produces an average of R0 additional infections. This is called the “base reproductive rate.” R0 is determined by two factors: the probability that contact with a susceptible person results in an infection, and the number of people that an average case comes in contact with during the infective period. In other words, it’s partly driven by the infectivity of the virus, and it’s partly driven by the extent of normal social interactions.
At each point “t,” two factors modify the original reproductive rate R0 to a different rate Rt. One is gradual reduction in the share “s” of the population that is susceptible – either as a result of vaccination or prior infection, where s is between {0 and 1}. The other factor is that people can practice a range of containment behaviors “c” such as mask use, social distancing, smaller groups, increased airflow, and isolation of cases – which collectively reduce the probability and the number of infective contacts. In our model, that estimated containment parameter “c” is also between {0 and 1}, where 0 is complete isolation, and 1 is normal interaction. At each point in time “t”, modifying R0 by s and c gives us:
Rt = R0*s*c
For example, if only 50% of the population is susceptible, and containment practices reduce infective contact to 80% of what would otherwise occur, Rt will drop to just 40% of R0. Once you get Rt below 1.0, the spread of infection stops being exponential. Unfortunately, if you only got there through containment, any relaxation in containment practices will expand transmission again, so you really do need to bring that susceptible share “s” down for the effect to be durable.
The original Wuhan-1 variant had an R0 of about 2.4. By late-January of this year, we estimated that about 75% of the population remained susceptible, but we also estimated a containment tightness parameter “c” of about 0.5. As a result, we had:
Rt = 2.4*0.75*0.5 = 0.9, and the spread of the Wuhan-1 variant essentially collapsed.
Unfortunately, by then, the Alpha variant (B.1.1.7) was already circulating, and it was about 50% more infective than the initial variant. While 0.75 susceptibility and 0.5 containment was sufficient to put Wuhan-1 out of circulation, Alpha’s spread – though still only a tiny number of cases – was defined by:
Rt = 3.6*0.75*0.5 = 1.35
It took until mid-April to get Alpha under control. By then, increased vaccination and past infection had reduced our estimate of the susceptible population to just 45%, even though relaxed containment practices had bumped c up to about 0.6:
Rt = 3.6*0.45*0.6 = 0.97. Goodbye Alpha.
Which brings us to Delta. This part of the pandemic should have been unnecessary. Delta has breathtakingly high R0 of about 5.0, and in the U.S., a combination of relaxed containment practices and vaccine hesitancy allowed it to get a lethal foothold. Because vulnerable people in higher age groups are better protected, the “case fatality rate” of Delta infections has thankfully been remarkably lower than for other variants.
Delta does have an important mutation that weakens binding of certain antibodies, but fortunately, those “breakthrough” cases are typically in the asymptomatic, mild, or moderate range, and are seldom severe and rarely fatal. Vaccine effectiveness against severe disease remains about 85-90%. See this piece by Jeffrey Morris, the Director of Biostatistics at the UPenn School of Medicine, for a nice analysis of how to properly interpret case data and vaccine effectiveness, and how using raw case numbers (rather than cases-per-thousand) and failing to stratify by age can lead to incorrect conclusions.
Last week, our estimate of the susceptible U.S. population dropped to about 24%, reflecting a combination of vaccination and prior infection. A large proportion of the remaining susceptible population is in less vulnerable groups. Meanwhile, the data imply containment tightness at about 0.8. As a result, the spread of Delta last week was finally defined by:
Rt = 5.0*0.24*0.8 = 0.96
That’s why Delta has peaked, in my view. From here, even a small reduction in the susceptible population, either as a result of infection or preferably vaccination, will drive Delta out of epidemic circulation, even without significant containment measures. We’ll still have a certain level of endemic spread, and cases (even if not fatalities) may have an extra pop as school starts, so it’s important to be careful a while longer.
While a greater vaccination rate would lower the risk of variants and make severe cases among young Americans even less frequent, it wouldn’t markedly change the trajectory at this point. We’ve already reached the herd immunity threshold the hard way, through about 60,000 more U.S. fatalities than necessary since July alone. An additional 30,000 will likely follow, most by late-October, but we’d have to exceed 3 million vaccine doses a day to avoid even half of them. For my part, I’m unabashedly in favor of vaccination, and as I’ve detailed before, it’s encouraging that the vaccine designs authorized in the U.S. all encode a prefusion spike. The final section of my most recent paper (Frontiers in Medicine) includes a discussion of these designs.
What about additional variants? Well, in order to fire the curve up again, it’s not enough simply to have a different variant. The new variant would have to dominate the features that define Delta. In particular, the new variant would need some combination of a) a higher reproductive rate R0 and b) a greater degree of antibody escape, in order to increase the susceptible share of the population. At present, there aren’t any variants of concern with that combination of features.
Much of the world remains unvaccinated, which is where our attention should turn. The easiest way to induce mutations in a virus is to serially passage it from host to host. There are certainly mutations to various parts of the virus (binding domain, replication machinery, cleavage site, neutralization epitopes) that one wouldn’t want to see together in a single variant, so we’re not entirely out of the woods. Certain variants of interest like Lambda have undesirable features, but they don’t appear sufficient to dominate Delta. We can’t rule out a future betacoronavirus pandemic, just as we can’t rule out a future influenza pandemic. It would be nice, before the next one, for the public to learn their math and science from somewhere other than social media.
In any event, based on the present set of conditions in the U.S., my expectation is that the SARS-CoV-2 pandemic will rapidly subside in the weeks ahead.
Keep Me Informed
Please enter your email address to be notified of new content, including market commentary and special updates.
Thank you for your interest in the Hussman Funds.
100% Spam-free. No list sharing. No solicitations. Opt-out anytime with one click.
By submitting this form, you consent to receive news and commentary, at no cost, from Hussman Strategic Advisors, News & Commentary, Cincinnati OH, 45246. https://www.hussmanfunds.com. You can revoke your consent to receive emails at any time by clicking the unsubscribe link at the bottom of every email. Emails are serviced by Constant Contact.
The foregoing comments represent the general investment analysis and economic views of the Advisor, and are provided solely for the purpose of information, instruction and discourse.
Prospectuses for the Hussman Strategic Growth Fund, the Hussman Strategic Total Return Fund, the Hussman Strategic International Fund, and the Hussman Strategic Allocation Fund, as well as Fund reports and other information, are available by clicking “The Funds” menu button from any page of this website.
Estimates of prospective return and risk for equities, bonds, and other financial markets are forward-looking statements based the analysis and reasonable beliefs of Hussman Strategic Advisors. They are not a guarantee of future performance, and are not indicative of the prospective returns of any of the Hussman Funds. Actual returns may differ substantially from the estimates provided. Estimates of prospective long-term returns for the S&P 500 reflect our standard valuation methodology, focusing on the relationship between current market prices and earnings, dividends and other fundamentals, adjusted for variability over the economic cycle.