

The Wealth Is In The Denominator


John P. Hussman, Ph.D.
President, Hussman Investment Trust
October 2021
This is the longest period of practically uninterrupted rise in security prices in our history. The rise was more rapid than has ever been seen, and its speculative attraction influenced a larger part of the public than ever before. The psychological illusion upon which it was based, though not essentially new, has been stronger and more widespread than has ever been the case in this country in the past.
This illusion is summed up in the phrase ‘the new era’. The phrase itself is not new. Every period of speculation rediscovers it. During every preceding period of stock speculation and subsequent collapse business conditions have been discussed in the same unrealistic fashion as in recent years. There has been the same widespread idea that in some miraculous way, endlessly elaborated but never actually defined, the fundamental conditions and requirements of progress and prosperity have been changed, that old economic principles have been abrogated, that the country has entered upon a period of unprecedentedly easy and rapid expansion, that all economic problems have been solved, that industry has suddenly become more efficient than it ever was before, that prosperity has become universal, that production and trade have been growing at an exceptionally high and permanently accelerating rate, that business profits are destined to grow faster and without limit, and that the expansion of credit can have no end.
– The Business Week, November 2, 1929
Among the illusions encouraged by every speculative bubble is the idea that wealth is embodied in the prices of securities – that higher prices inherently represent greater “wealth.” The fact is that every security is, at base, a claim to some future stream of cash flows that will be delivered into the hands of investors over time. The wealth is in those cash flows. Yes, any individual can obtain the market price of a security by selling it to someone else, but the buyer, and ultimately the whole string of people who own the security until it is retired – ultimately has a claim on only one thing: the cash flows that the security will deliver over time. That’s where the wealth is. Every other transaction is simply a transfer of wealth between a buyer and a seller. At extreme valuations, that transfer typically favors the seller. At depressed valuations, that transfer typically favors the buyer.
When the prices of securities become extreme relative to their underlying fundamentals – the revenues, GDP or other economic engines that generate deliverable cash flows – there’s only one way to bring the ratio of price to fundamentals back into line, and that is for prices to grow at a slower rate than fundamentals do.
In general, that implies a long period of dull or negative investment returns.
What about rapid growth in fundamentals? Well, over the past two decades, S&P 500 revenues and U.S. nominal GDP have grown at just 4% annually. Unless profit margins expand indefinitely from already-record highs, that’s the baseline for nominal growth. There are two ways to bump that up: higher real growth, or higher inflation. Given that real structural U.S. GDP growth (the sum of demographic labor force growth and trend productivity) has gradually declined over the past three decades to only about 1.6% annually, real GDP growth is unlikely to meaningfully contribute to the realignment. It’s certainly possible for inflation to drive nominal fundamentals higher (in which case investors could still expect negative real returns), but as we’ll discuss below, inflation-driven growth tends to benefit nominal stock market returns only after valuations have been crushed. At present, the CPI would have to roughly triple before the “benefit” of inflation would offset the drag of extreme valuations.
For the S&P 500, we expect a long period of negative returns, both real and nominal, but with more than enough volatility to provide regular opportunities for a value-conscious, full-cycle investment discipline. What makes this cycle “different” from previous cycles is not that valuations don’t matter (they do, and will), but that Fed-induced speculation has not been constrained by historically-reliable “limits” that were useful in previous cycles. So we’ve adapted, to tolerate and even thrive in a world where even Fed-induced speculation without “limits” can still be gauged by the level of valuations and the condition of market internals.
The current perceptions of investors about their own ‘wealth’ are out of line – to a historic extent – with the economic fundamentals that are available to support the claims.
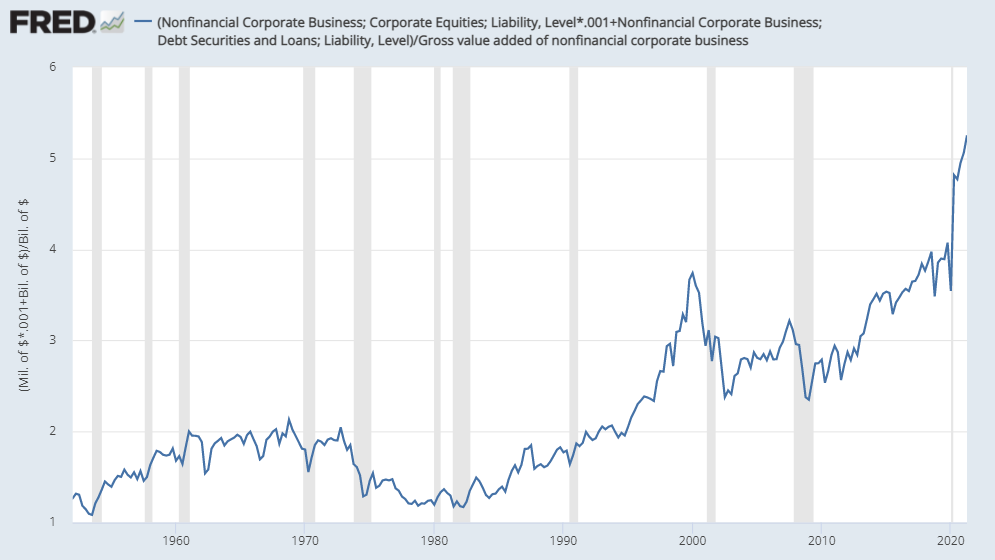
What investors view as “wealth” is actually just the current price of their future wealth. Except for individual investors who sell into the extreme valuations that are periodically offered by Mr. Market, those prices are just blotches of ink on paper and flashing pixels on a screen. For long-term investors, the wealth is in the cash flows, and those cash flows are in the denominator. When you divide the market capitalization of the liabilities (the market value of stocks or debt) by the value-added production that generates the cash flows (GDP or corporate gross value-added), you get a useful picture of the extent to which investors are likely to enjoy outstanding long-term returns or dismal ones. Indeed, as I’ve often detailed, valuation measures based on these comparisons are also the ones best correlated with actual subsequent market returns.
At present, that picture has never been more extreme. The chart below shows the sum of equity market capitalization and debt for U.S. nonfinancial firms, divided by the gross value-added (essentially revenues) of those firms.
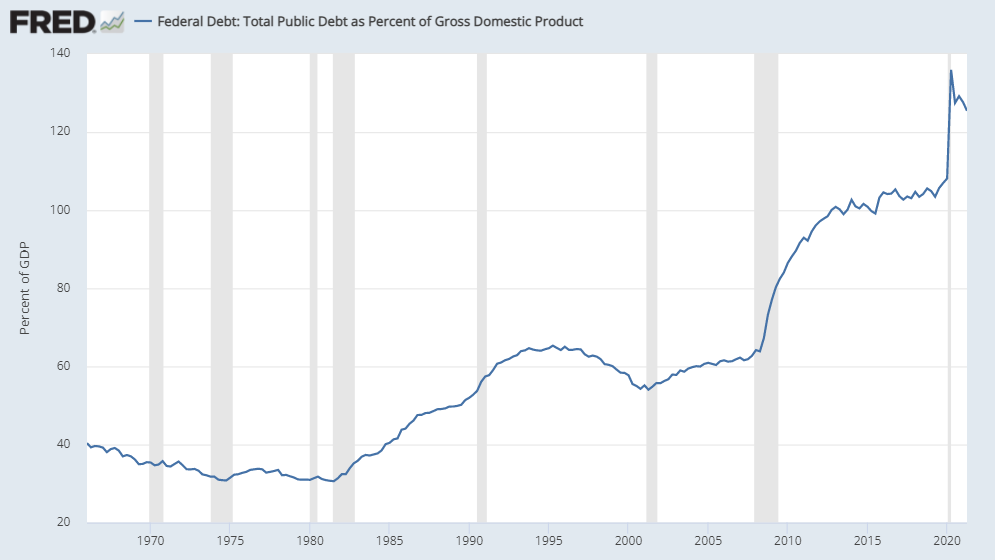
The chart below shows the ratio of the U.S. public debt to U.S. nominal GDP.
The current situation is problematic because the value of the claims is wildly out of line with the sources of the cash flows. The current perceptions of investors about their own “wealth” are out of line – to a historic extent – with the economic fundamentals that are available to support the claims.
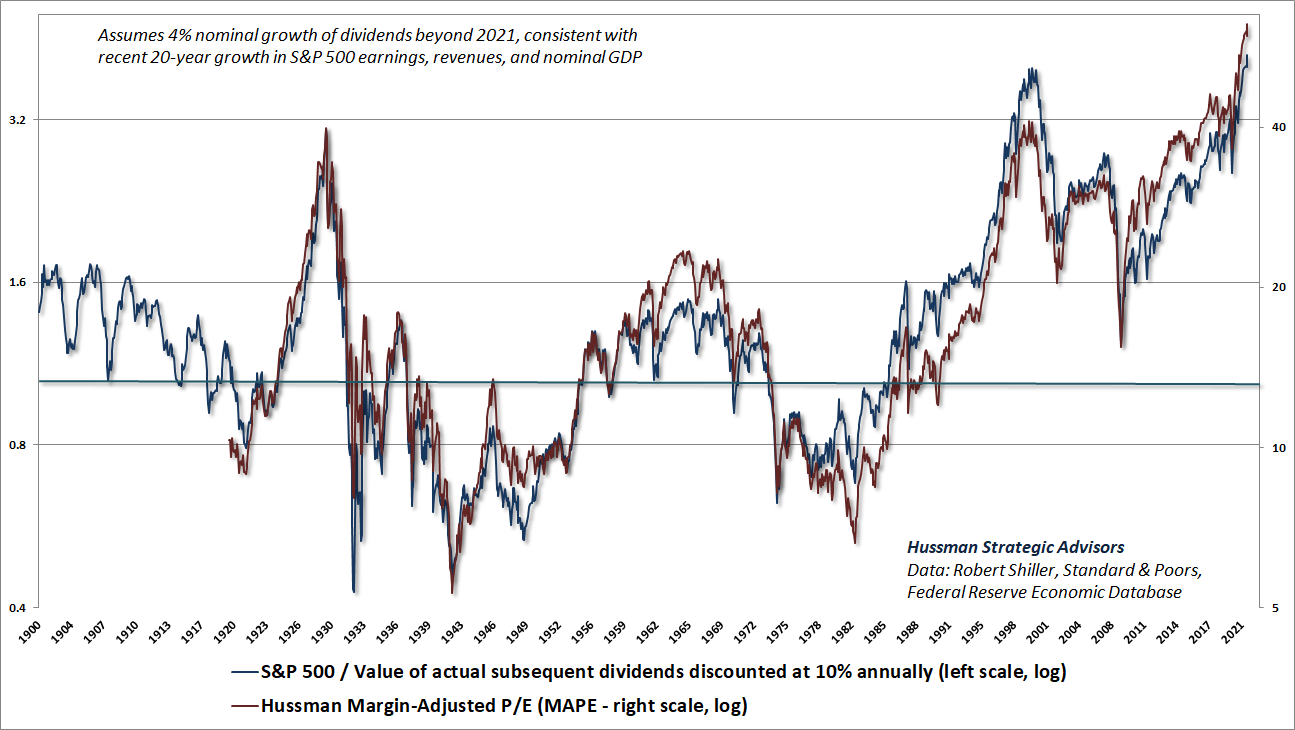
If one is actually an investor and not merely a speculator, it is essential to ask “How much am I paying, relative to the stream of cash flows I can expect to get?” Again, a security is nothing more than a claim on a very long-term stream of cash flows that investors can expect to receive over time. The higher the price an investor pays for those cash flows, the lower the long-term return they can expect. This is just arithmetic. Indeed, we can look across more than a century of market history and examine where the S&P 500 stood at every point in time, relative to value of the actual long-term stream of cash flows that the S&P 500 has delivered to investors (including the per-share impact of stock buybacks). The chart below shows that calculation, where the reference “norm” is the value of actual subsequent dividends, discounted at 10% annually.
Not surprisingly, this calculation is essentially proportional to our Margin-Adjusted P/E (MAPE). As I often note, a good valuation measure is nothing more than shorthand for a proper discounted cash flow analysis. Notice that – by construction – the heavy horizontal line at 1.0 is our estimate of where valuations would have to retreat in order for the S&P 500 to be priced at levels consistent with long-term expected total returns of 10% annually. Current valuations are at record levels nowhere near those historical norms.
What investors view as “wealth” is actually just the current price of their future wealth. Except for individual investors who sell into the extreme valuations that are periodically offered by Mr. Market, those prices are just blotches of ink on paper and flashing pixels on a screen. For long-term investors, the wealth is in the cash flows, and those cash flows are in the denominator.
The chart below of nonfinancial market capitalization to corporate gross value-added (MarketCap/GVA) provides a similar perspective regarding current valuation extremes. Note that the chart is presented on log scale.
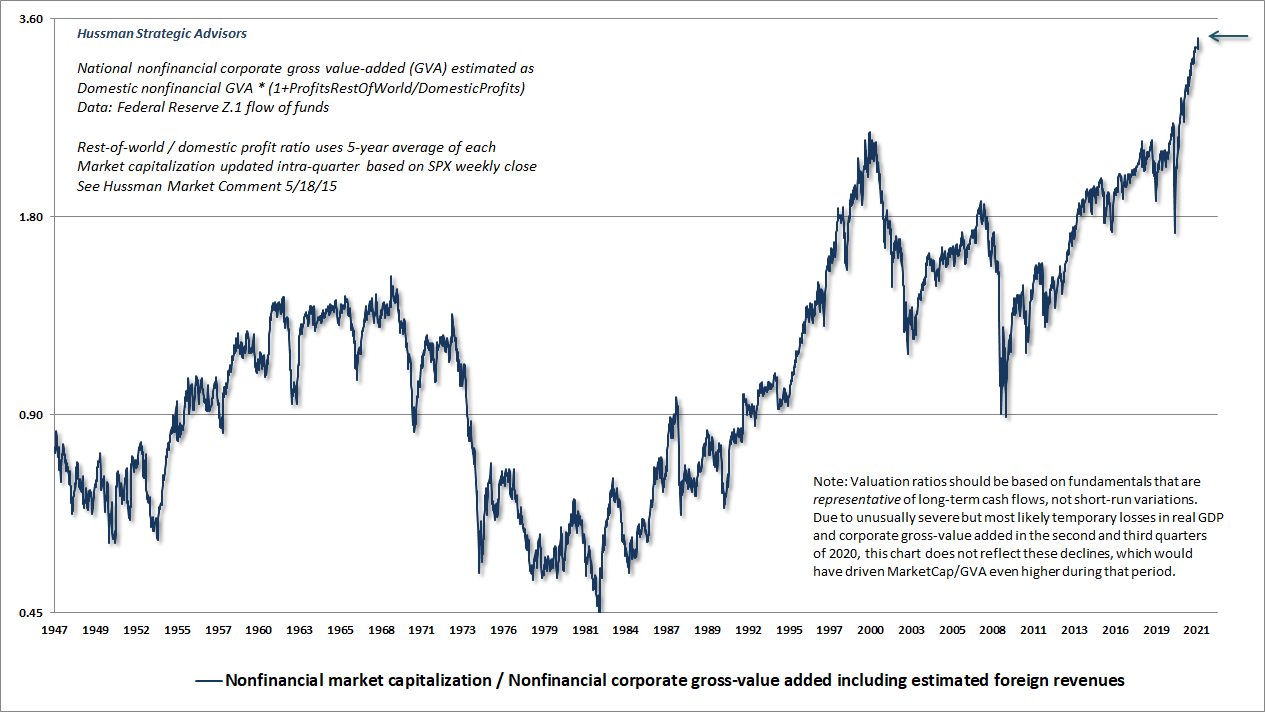
Across history, extremely elevated valuations have been associated with poor subsequent market returns, on average. Depressed valuations have been associated with strong subsequent market returns, on average. Run-of-the-mill valuations have been associated with run-of-the-mill subsequent market returns averaging about 10% annually. Current valuation levels, on our most reliable measures, stand about 3.4 times run-of-the-mill historical norms.
Geek’s Note: Because discounted cash flows involve exponentiation, you can show mathematically that log valuations have a roughly linear relationship with actual subsequent returns. We use a 12-year horizon because that’s where the autocorrelation of valuations (the correlation of valuations with previous valuations) typically hits zero, so mean-reversion of valuations tends to be most reliable at that point. Indeed, large “errors” between actual trailing 12-year returns and those projected by past valuations typically indicate that stocks are near the peak of a bubble (recent returns > projected) or secular valuation low (recent returns < projected).
Reconciling prices with cash flows
Today, if you take the U.S. equity market, the combination of the debt and the equity and say, ‘Well, how long would it take to pay off all the asset owners for their draw on future income?’ You’d have to work the family business for 25 years before you get a paycheck, right? And that is one of the four peaks in history. You had that peak in 1999/2000. You have that peak in 1929. You have that peak in 1965. You have that peak in 1905 in terms of the years of future income that are dedicated to paying back the wealth. That’s where you have the huge wealth divide problems and one way or the other, the cash flows, the willingness for people in the future to work to pay off old wealth holders is bounded in a democracy. And now, you’ve got to look at everybody that were losers in that whole game, and how do they benefit in society – or you risk the loss of society. So that’s this huge cycle, and when you look at the options, given where we’ve now pushed asset prices to, how do you reconcile asset prices with cash flows?
Of course, in 1929 and 1999-2000, we know how it gets reconciled. Crashes that aren’t deflationary themselves – that’s one possibility. I think that’s the lower of the two possibilities on how this gets reconciled. I think the more plausible is you bring incomes up through rising nominal GDP, through government redistribution, and that offsets the disinflationary pressures, and you push to an inflationary environment that allows incomes to catch up. That’s how 1965 and 1905, how incomes came in line with asset prices. With negative real returns and assets high, but not necessarily down in nominal terms, and high wage growth and nominal GDP growth that brings cash flows in line with asset prices. So that’s my best guess of what policymakers will stumble their way towards, and are stumbling their way towards. It’s not like there’s a grand plan to create inflation in order to reconcile incomes with the asset prices, but one way or the other, you get to choose every day.
– Greg Jensen, Co-CIO, Bridgewater Associates
The End Game with Grant Williams, 7/29/21
Greg Jensen, the Co-CIO of Bridgewater Associates, correctly observes that the four most prominent peaks in market valuations, prior to the recent bubble, were 1905, 1929, 1965, and 2000. All of them were followed by extended periods of negative real returns. Two of them – 1929 and 2000 – featured market “crashes” where nominal stock prices plunged by 50% or more from the peak almost immediately.
Jensen observes that the 1905 and 1965 valuation extremes were instead brought into line with cash flows by extended periods of inflation, but without a crash in nominal stock prices. Yet even this point depends very much on how one defines a “crash.” The fact is that the Dow Industrials plunged by 49% from January 1906 to November 1907. The market then ground sideways for years. By December 1914, the Dow Jones Industrial Average was still down by nearly half from its 1905 levels, and was still one-third lower as late as 1921. Likewise, although the initial market decline from the 1965 peak was a relatively modest 21%, the S&P 500 ground sideways until 1982, including an interim loss of nearly 50% during the 1972-74 bear market.
In the end, the total return of the U.S. stock market lagged both Treasury bills and CPI inflation for 13 years following the 1905 market peak, 16 years following the 1929 peak, 18 years following the 1965 peak (actually more 20 years if one measures from Feb 1962 to Aug 1982), and 13 years following the 2000 peak. These very long, interesting trips to nowhere comprise at least 60 years within just over a century of data, and can be identified by one defining feature: extreme starting valuations.
Simply put, investors should be fully prepared for a very long period in which stocks essentially go nowhere in an interesting way. Nothing in our discipline relies on that possibility, even though it reflects merely run-of-the-mill assumptions supported by more than a century of market cycles. In contrast, passive investors are resting their future on the historically unfounded hope that this possibility can be ruled out.
From a historical perspective, it’s interesting that while the valuations preceding the 1987 crash were nowhere near those of 1929 or 2000, the total return of the S&P 500 outperformed Treasury bills by less than 1% annually during the nearly 22 year period from August 1987 to March 2009, despite two intervening speculative bubbles. As for the 2000 peak, after more than a decade of negative total returns, investors needed the most extreme speculative bubble and largest Federal Reserve stick-save in history just to get the 20-year total return of the S&P 500 2.5% over the depressed level of T-bill returns. Given current extremes, investors must now rely on a “permanently high plateau” in market valuations order to outperform T-bills. Indeed passive investors now fully rely on the assumption that market valuations will never, ever reach – much less fall below – historical norms again.
At valuations that presently stand at 3.4 times historical norms, the arithmetic here is daunting. Assuming the same 4% growth rate in S&P 500 revenues and nominal GDP that we’ve observed in the past two decades, a return to run-of-the-mill valuation norms would leave the S&P 500 index unchanged even [ln(3.4)/ln(1.04)=] 31 years from now, although the modest dividend yield of the S&P 500 would add something in the area of 2% annually. At a nominal growth rate of 10% annually, a return to historical valuation norms would still leave the S&P 500 index unchanged nearly 13 years from today.
On the growth front, it’s worth observing that high nominal growth over a 10-year period is invariably associated with high interest rates – along with normal or depressed stock valuations – at the end of that period. Investors are not likely to get high nominal growth without also getting a massive downward adjustment in valuations.
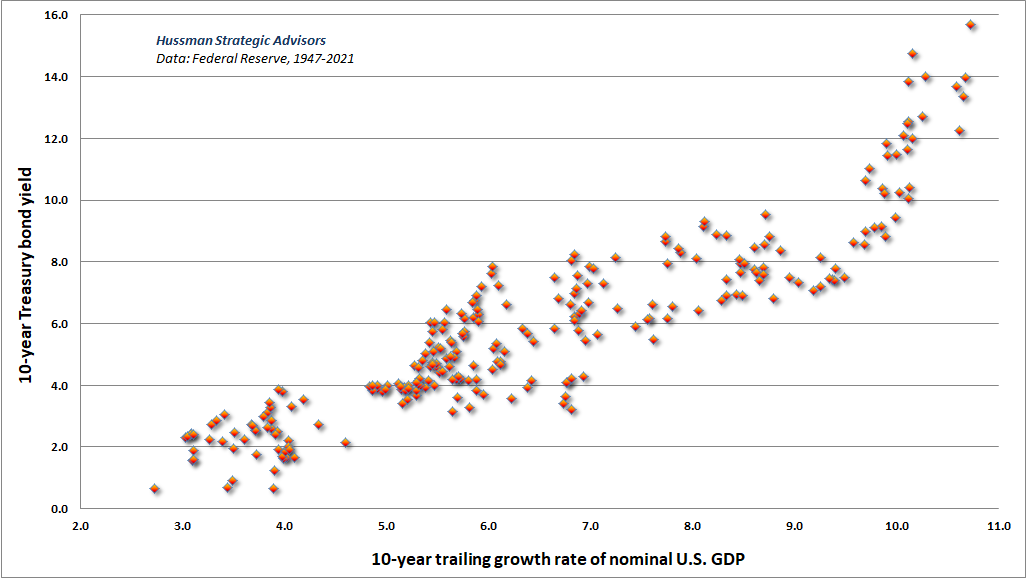
Indeed, if we examine the times in U.S. history that growth in nominal GDP, S&P 500 revenues, or cyclically-adjusted earnings averaged over 10% annually for a decade or more, or that 10-year CPI inflation averaged even 4% annually, S&P 500 valuations at the end of those 10-year periods were always at or below historical norms – on average more than 30% below those norms.
It is both popular and tempting to believe that current valuation extremes could be bailed out by sufficiently high inflation and nominal growth, without significant market losses. Unfortunately, the historical fact is that the “benefit” of inflation on nominal stock prices only emerges after valuations have been driven to historically average or below-average levels. The CPI would have to more than triple in order to accomplish that – an outcome that would require an average inflation rate of 8%-plus for a period of about 13 years, simply to offset today’s hypervaluation. Inflation certainly helped to resolve the 1905 and 1965 valuation peaks, but even those episodes involved intervening bear market losses of about 50% in the decade that followed those peaks – despite valuations that were nowhere near as extreme as they are today.
So 10, 20, or possibly even 30 years from today, investors may look back on years of low or negative total returns and say, well, nobody could have predicted X about the economy, or inflation, or debt, or whatever. What I’m trying to tell you is that it doesn’t matter. The moment you look at where starting valuations are, you already know that, in all probability, the prospects for acceptable stock market returns are screwed. You just don’t quite know what type of screw.
Simply put, investors should be fully prepared for a very long period in which stocks essentially go nowhere in an interesting way. Nothing in our discipline relies on that possibility, even though it reflects merely run-of-the-mill assumptions supported by more than a century of market cycles. In contrast, passive investors are resting their future on the historically unfounded hope that this possibility can be ruled out.
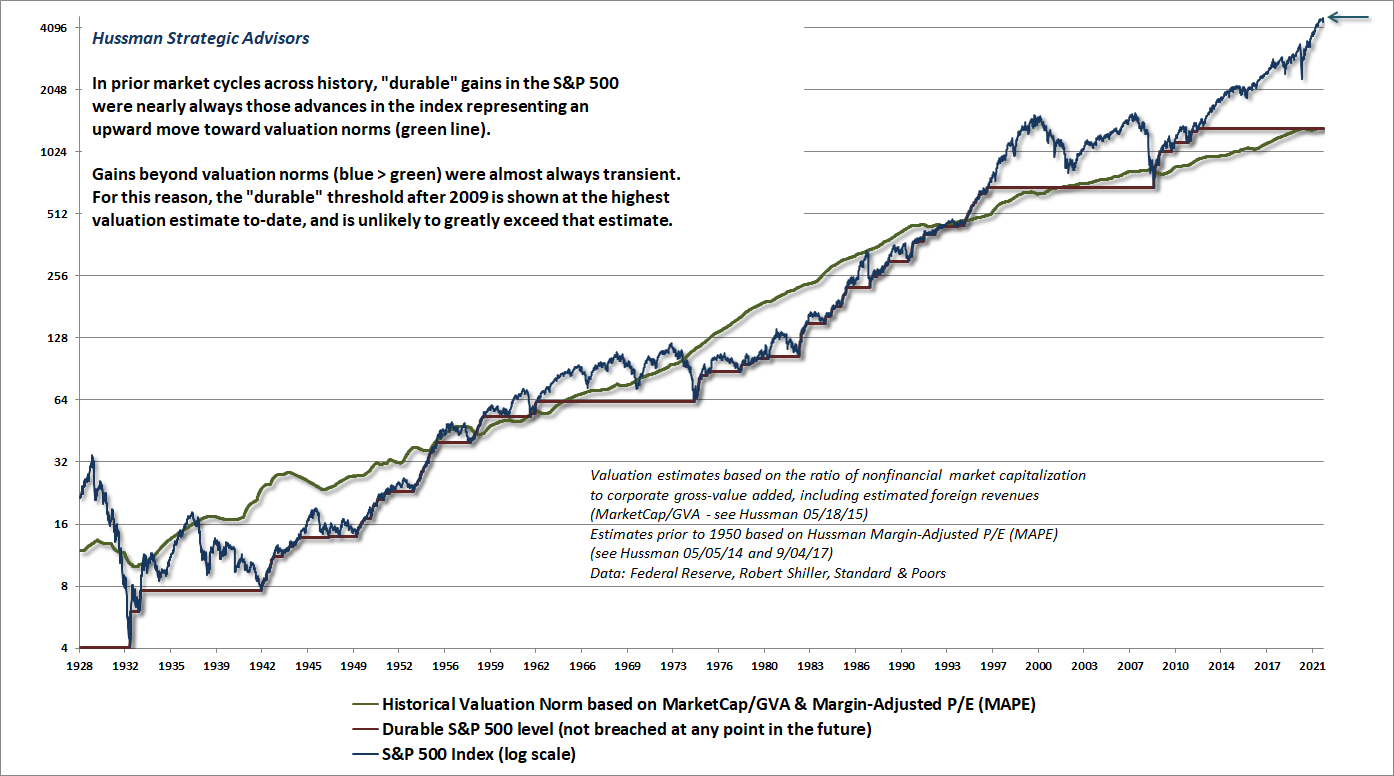
The chart below offers some useful perspective on why stocks periodically “go nowhere in an interesting way.” Over the long-term, prices and fundamentals are “integrated” in the sense that they maintain a relationship to one another that neither explodes off to infinity nor collapses to zero. The blue line is the S&P 500 Index. The green line shows historical valuation norms, based on MarketCap/GVA and MAPE, that have historically been associated with long-term subsequent S&P 500 total returns averaging about 10% annually. The red line shows the “durable” level of the S&P 500 that was not subsequently breached at any point in the future. Notice that market advances that take the S&P 500 toward the green valuation line from below tend to be durable. We don’t actually know what that the “durable” level is at present, but based on a century of market history, we also know that market advances that take the S&P 500 far above the green valuation line tend to be transient. For that reason, the red line is set at the highest level of valuation norms to date.
Unfortunately, that line is nearly 70% below current market levels. It’s worth repeating that nothing in our discipline relies on a market decline to historical valuation norms, but it’s clear that most investors rely on never, ever doing so again.
So 10, 20, or possibly even 30 years from today, investors may look back on years of low or negative total returns and say, well, nobody could have predicted X about the economy, or inflation, or debt, or whatever. What I’m trying to tell you is that it doesn’t matter. The moment you look at where starting valuations are, you already know that, in all probability, the prospects for acceptable stock market returns are screwed. You just don’t quite know what type of screw.
Be careful with “historical averages” that ignore valuations
As I’ve often noted, passive investing is always embraced at market extremes, because that’s exactly the point when backward-looking returns are the most glorious. As a bubble progresses, investors become convinced that reliable valuation measures of the past have become obsolete, and that each recovery to new heights has vindicated stocks as a profitable and reliable medium for investment. As Graham & Dodd wrote in Security Analysis (1934), looking back on the bubble that ended in 1929:
“These statements sound innocent and plausible. Yet they concealed two theoretical weaknesses that could and did result in untold mischief. The first of these defects was that they abolished the fundamental distinctions between investment and speculation. The second was that they ignored the price of a stock in determining whether or not it was a desirable purchase. It was only necessary to buy ‘good’ stocks, regardless of price, and then to let nature take her upward course. The results of such a doctrine could not fail to be tragic.”
If one chooses to entirely ignore the level of valuations, one might conclude that the “expected return” of the S&P 500 is always about 10% annually; that the total return of the S&P 500 can be expected to exceed the return on Treasury bills by nearly 7% annually over time; and that although a few holding periods may include significant market losses, the worst loss of the market over a multi-year holding period is, on average, only about 20%. Indeed, all of these figures are consistent with market history from 1928-2021. Given this data, along with a casual disregard for valuations, an analyst might be forgiven for concluding that the likelihood of stocks outperforming T-bills is always quite satisfactory, and might even publish an inadvertently misleading chart like this (a version of one I saw just last week):
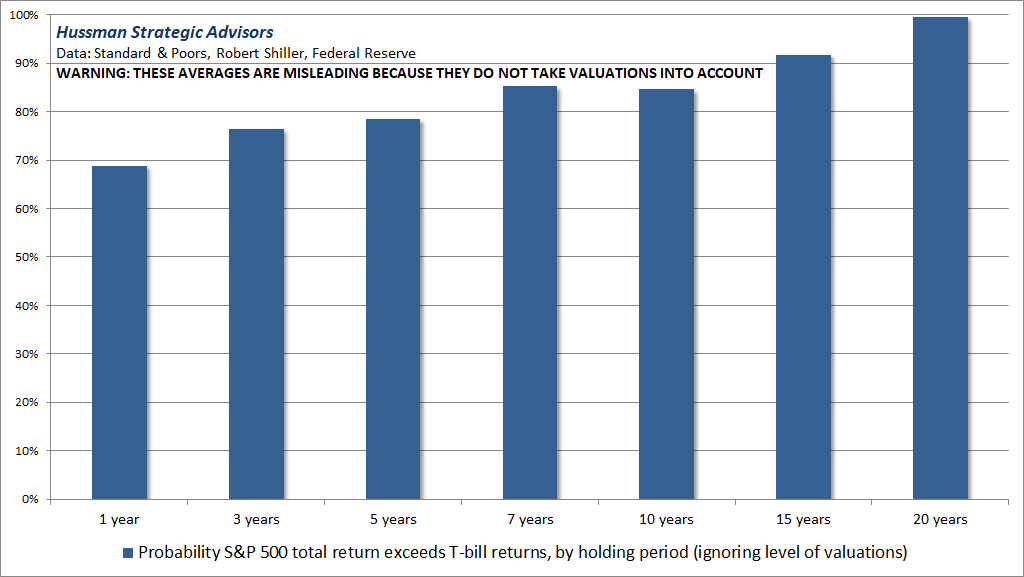
The problem here is that a) the expected return of the S&P 500; b) the probability that stock returns will exceed Treasury bill returns and; c) the likely depth of cyclical market losses, are all heavily dependent on the level of starting valuations. With the ratio of nonfinancial market capitalization to corporate gross value-added currently at a record level of 3.3 versus a historical norm just under 1.0, it may eventually matter that these market outcomes are not simply fixed numbers.
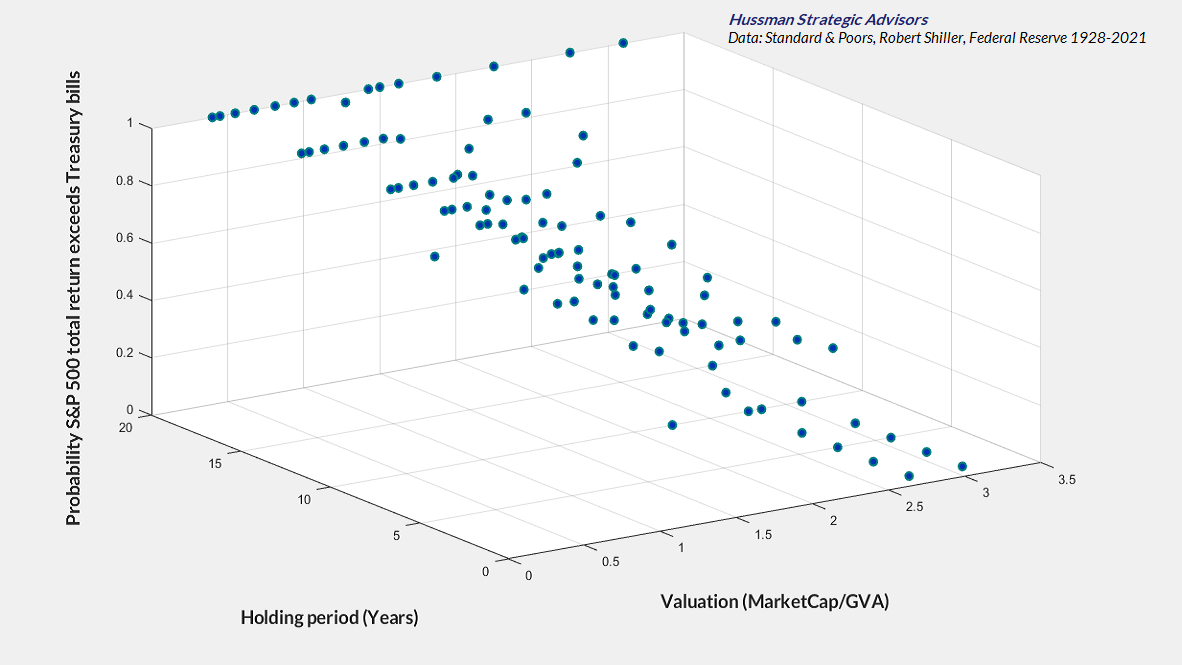
For example, in the 10% of history when market valuations have been anywhere beyond half of current levels, the S&P 500 has, on average, lagged Treasury bills over the subsequent 10-year period, with an average interim loss of over 50%. At rich valuations, the probability that the S&P 500 will outperform T-bills over a 1, 3, 5, 7 or 10 year holding period quickly drops below 50%, approaching zero as the level of valuations becomes extreme.
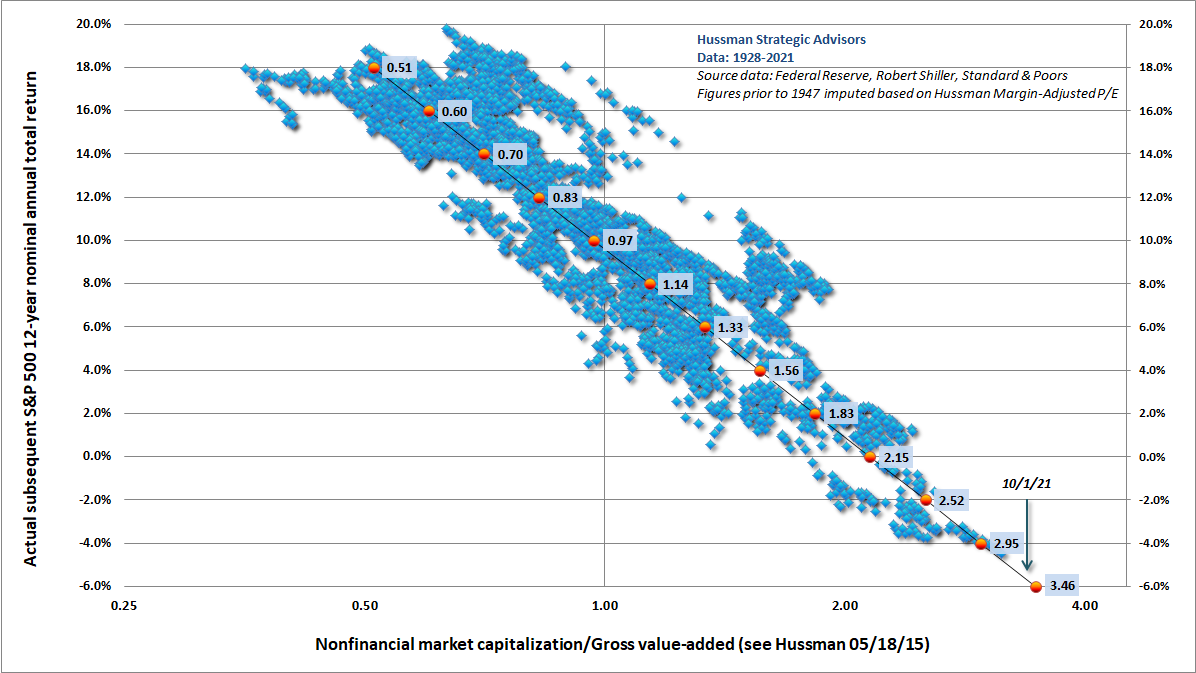
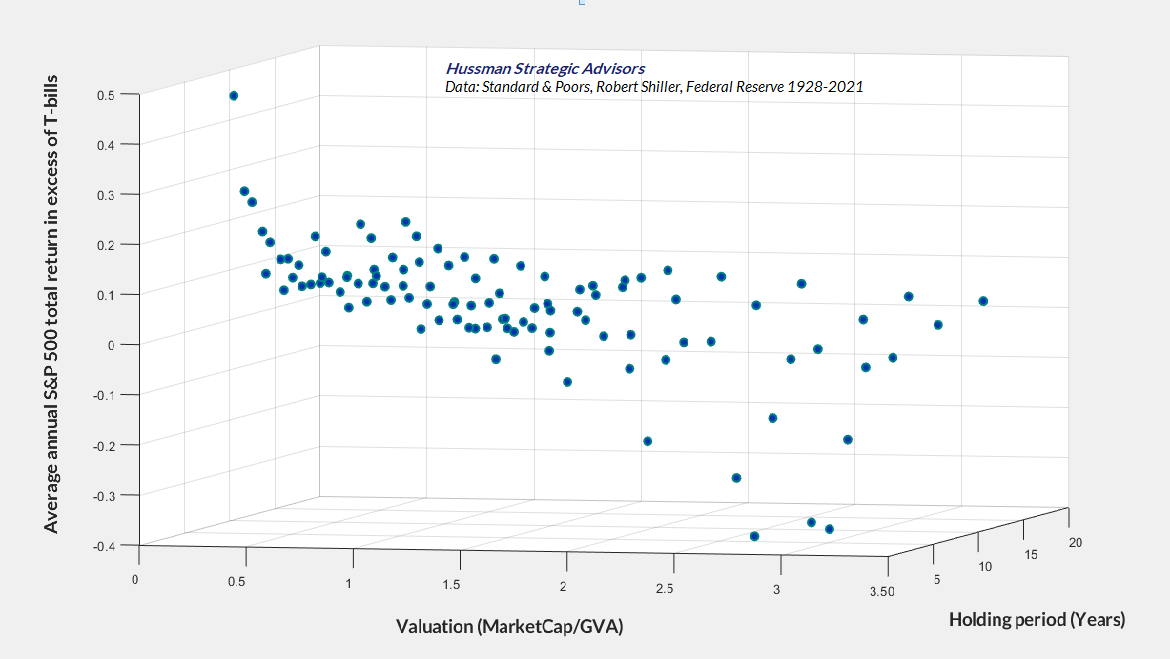
Put another way, the relationship between the investment horizon and subsequent market returns isn’t a line, but a 3-dimensional surface where the essential third coordinate is the level of valuations. The charts below show what that surface looks like. First chart shows the level of MarketCap/GVA, the investment horizon, and the actual subsequent S&P 500 annual total return in excess of T-bill returns, in data from 1928 to 2021. Notice the steep dip in returns as valuations increase. Once starting valuations have become extreme, subsequent S&P 500 total returns have lagged Treasury bill returns at every horizon short of 20 years.
The relationship between starting valuations and subsequent full-cycle market losses is just as striking. When starting valuations are depressed, one can certainly observe further losses, and even a steep loss can occur in rare instances. But on average, depressed valuations are associated with rather shallow subsequent losses, while extreme valuations invite profound market losses over the subsequent investment horizon.
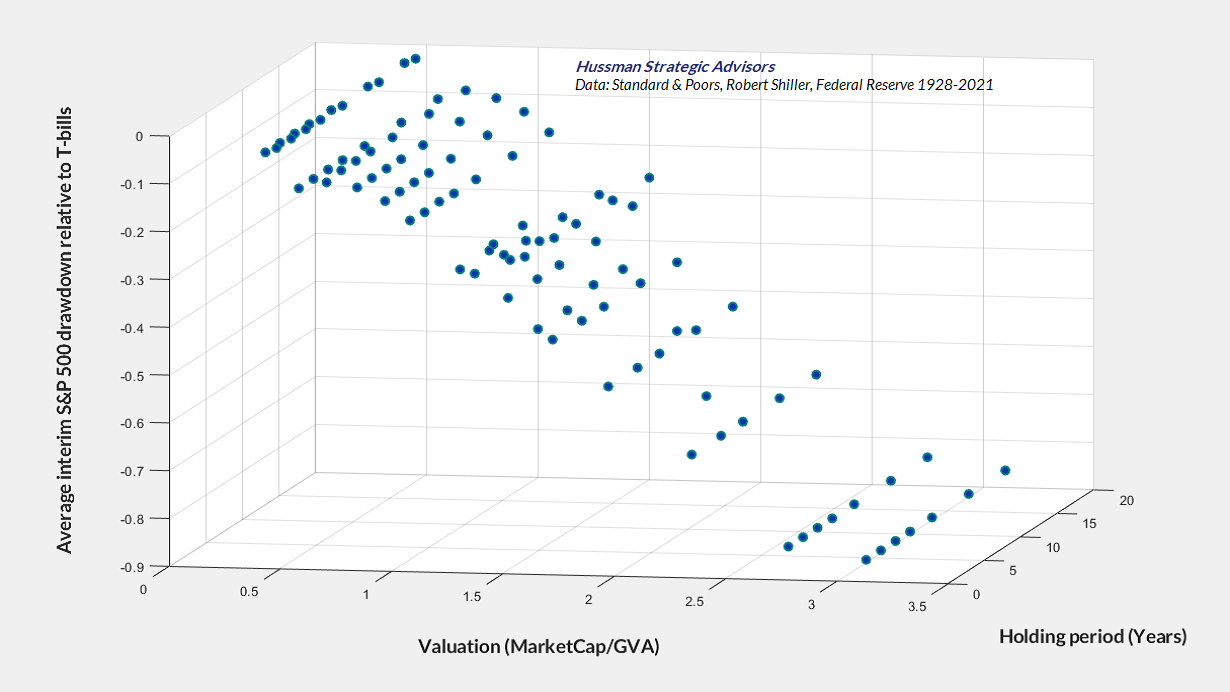
The upshot of this is that the likelihood of stocks outperforming Treasury bills is strongly affected by the level of starting valuations. With valuations at the most extreme level in history, investors should seriously consider the possibility that the total return of the S&P 500 could very well lag the return on lowly Treasury bills for something on the order of 20 years.
When the narrative breaks
Unlike decades of complete market cycles that we navigated quite nicely – thanks – the speculative episode of recent years has encouraged the belief that no level of valuation is too extreme, and that market cycles no longer exist. As I’ve regularly noted, even our own research efforts in recent years have focused on adaptations that can allow us to better tolerate and even thrive in a world where valuations might never again retreat to their historical norms. We certainly don’t expect that sort of world, but we have allowed for it. These adaptations basically amount to criteria for accepting moderate amounts of market exposure – coupled with position limits or safety nets that constrain risk – even in conditions where valuations imply poor long-term returns. These considerations fall into what Benjamin Graham would describe as “intelligent speculation” – kept within minor limits.
Quantitative easing “works” by replacing interest-bearing Treasury securities with zero interest base money (bank reserves and currency) which someone in the economy must hold as zero interest base money until it is retired. Provided that investors are inclined to speculate, so that they rule out the possibility of capital losses on risky investment, this zero-interest base money encourages yield-starved investors to chase riskier securities. Of course, the moment a buyer puts that base money “into” stocks, the seller takes that base money right back “out.” So zero-interest base money acts as a hot-potato that amplifies yield-seeking behavior.
Ultimately, valuations unfortunately become so extreme that negative future returns are essentially baked into the cake. At that point, the “mechanism” that supports the speculation is just speculative psychology itself. That’s not enough to trigger an immediate market decline, but if (and when) enough investors become sufficiently risk-averse to consider the possibility of negative returns, Fed easing no longer “supports” the market because safe, zero-interest liquidity becomes a desirable asset rather than an “inferior” one. That’s how stocks lost half their value in 2000-2002 and again in 2007-2009, despite persistent and aggressive Fed easing, all the way down.
In recent years, the Fed has pushed its luck – along with valuations – to unprecedented extremes. The main adaptation that deranged Federal Reserve policy required of our own discipline in this cycle was to abandon our pre-emptive bearish response to historically-reliable “limits” to speculation, and to instead prioritize the condition of market internals. A more recent – though minor – adaptation has been to adopt a slightly more “permissive” threshold in our gauge of market internals when interest rates are near zero and certain measures of risk-aversion are well-behaved. Essentially, we’ve become content to gauge the presence or absence of speculation or risk-aversion, without assuming that there remains any well-defined limit to either.
The question isn’t whether one should adapt to unprecedented Fed policies, but instead, the form those adaptations should take. It is unimaginable that investors have swallowed the premise of ‘Fed support’ whole. It is a profound mistake for investors to ‘adapt’ so unconditionally. Instead, we are fully convinced that these historic valuation extremes have removed decades of investment returns from the future, and strongly suspect that the Fed has amplified future downside risk as well.
– John P. Hussman, Ph.D., Maladaptive Beliefs, September 2021
Emphatically, I believe that the appropriate way to adapt to deranged Fed policy is to maintain – not abandon – our attention to valuations and market internals. Our main adaptations have instead been to reduce our reliance on historically-reliable limits, and to prioritize other elements of our discipline in a way that: a) recognizes the profound psychological discomfort that investors have with holding zero-interest money provided that they are inclined to speculate – which we infer from the condition of market internals, and that; b) imposes appropriate position limits and safety nets so that we do not rely on Fed-induced speculation – as I believe the majority of investors are doing currently.
At present, we observe a combination of extreme valuations and deteriorating, divergent market internals that have been unfavorable for stocks – not only historically, but even during the past decade of extraordinary Federal Reserve activism. I can’t emphasize enough that investors do not view zero-interest liquidity as an “inferior” asset when they are inclined toward risk-aversion. When investors become risk-averse, this liquidity becomes a desirable asset, so as we saw in 2000-2002 and 2007-2009, creating more of the stuff doesn’t support stock prices. Our best gauge of risk-aversion is divergence rather than uniformity across a broad range of market internals.
The moment we observe improvement in our measures of market internals, our bearish view will moderate to a neutral or constructive outlook – regardless of the level of valuations. What the level of valuations does in this context is to define the range of the constructive response. As I’ve frequently noted, the most favorable market condition we define occurs when a material retreat in valuations is joined by an improvement in our measures of market internals. I certainly expect that we’ll observe that sort of shift over the completion of this cycle, but we’ve also adapted in a way that will give us greater latitude even in a world where valuations never retreat to historically reasonable levels again. Time will tell, and we’ve become content to take one day at a time.
The main object that Fed policy affects is yield-seeking financial speculation, and even then only in periods when investors are inclined to speculate. That’s exactly how we got the mortgage bubble. Conversely, the tendency of valuations to collapse amid risk aversion and divergent market internals – regardless of Fed easing – is how we got the global financial crisis. The Fed has proven itself quite good at amplifying speculation and encouraging excessive issuance of low grade securities when investors are inclined to speculate, and then feigning heroism when the bubbles of its own making collapse amid periods of investor risk-aversion. While an improvement in our gauges of market internals would suggest fresh speculative pressures, the deterioration and divergence that we currently observe in market internals substantially increases the downside risk of record valuations.
Meanwhile, understand that when someone says that valuations are “reasonable relative to interest rates,” what they mean is that expected returns on stocks “deserve” to be dismal because the expected returns on bonds are also dismal. I have no problem with investors who say “I’m comfortable with a decade or more of negative real returns on stocks, because bonds are likely to have negative real returns as well.” I do think that there are better strategies, but at least their expectation would be consistent with history. In contrast, if investors imagine that current valuation extremes are “justified” by low interest rates, yet think that the word “justified” implies expected stock market returns anywhere near historical norms, a century of history suggests that they’re likely to be profoundly disappointed.
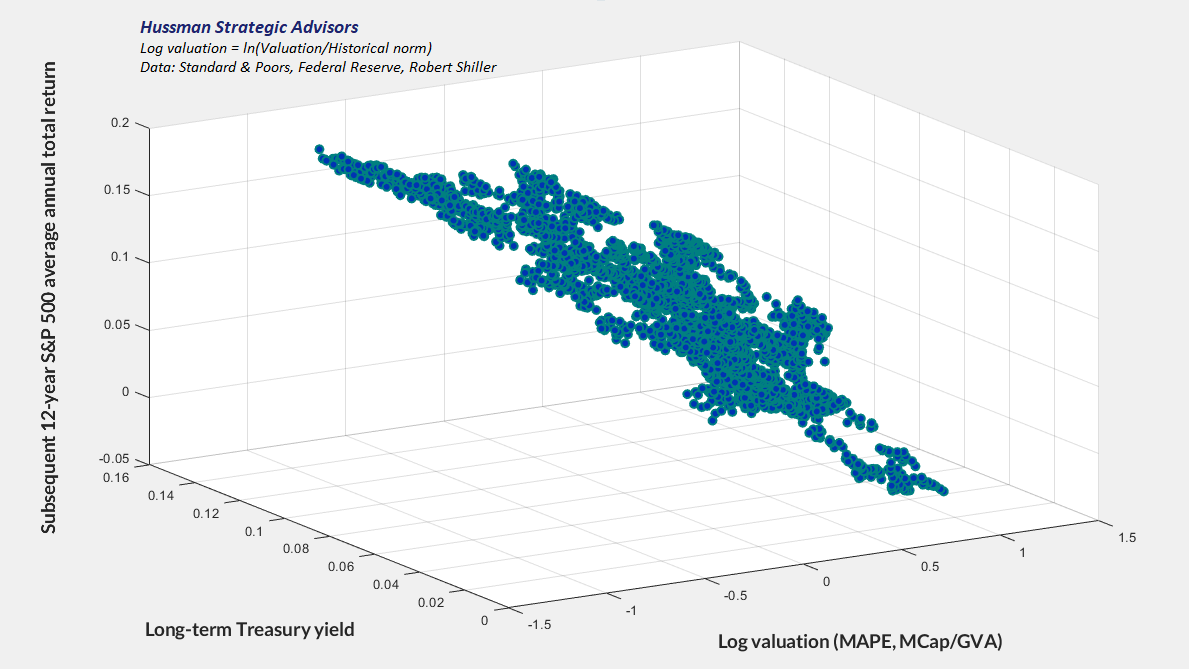
The chart below plots log valuations, interest rates, and subsequent S&P 500 total returns in 3D in data since 1928. The valuation axis shows the log of actual valuation / historical norm, so zero on the valuation axis represents historical norms, and 1.0 represents valuations about 2.7 times historical norms. We don’t know what the market return will be over the coming years, but valuation and interest rate components already place the current point to the right of all the previous observations in history. Probably needless to say, I don’t expect the low level of interest rates to mitigate the negative impact that these valuation extremes are likely to have on future market returns.
What the Fed emphatically does not control is some manageable “tradeoff” between inflation and unemployment. Instead, the Fed has become almost entirely reliant on a narrative that its actions ‘support’ the financial markets. When that narrative breaks – because it is in fact a narrative, not a mechanistic relationship – all hell will break loose, as it did in 2000-2002 and 2007-2009 despite persistent Fed easing. The outcome will be even worse if the Fed is itself constrained by inflation pressures.
As I’ve detailed previously, there’s no compelling evidence that the trajectory of GDP or employment in response to activist Federal Reserve interventions has been any different than one could have projected using non-monetary variables alone. If extraordinary monetary policy matters, information about monetary variables should improve our ability to explain subsequent movements in real GDP and employment. If it doesn’t, the forecasts will be largely the same with or without the monetary information. That’s exactly what we observe.
The fact is that neither information about the Federal Funds rate nor the size of the Fed’s balance sheet materially improves the ability to project subsequent changes in the real economy. Knowing the stance of Fed policy, however extreme it might be, contributes virtually nothing to those projections. Extraordinary Fed liquidity certainly has a role to play during banking crises, provided that bank reserves are actually constrained. In the midst of the pandemic, the most important aspect of the Fed’s policy was simply the assurance of that liquidity (its illegal foray into uncollateralized corporate securities – treating them as their own collateral – was both an abuse of public funds and a violation of section 4003(c)(3)(b) of the CARES Act). Aside from crisis response, to the extent that Fed policy has any material effect on the real economy, it’s embedded in the “systematic” component (Fed responses that can be fitted using current and past values of non-monetary variables – much like the Taylor Rule), not in the “activist” component.
Likewise, as I detailed in Alice’s Adventures in Equilibrium, the popular interpretation of the Phillips Curve as a “tradeoff between inflation and unemployment” is a profound misinterpretation of Phillips’ 1957 paper (which actually implies an inverse relationship between unemployment and real wage inflation, based on a century of wage data when Britain was generally on the gold standard). There is no meaningful correlation or effect size – positive or negative – between U.S. inflation and unemployment data, regardless of what leads or lags one might choose to apply.
The main object that Fed policy affects is yield-seeking financial speculation, and even then only in periods when investors are inclined to speculate. That’s exactly how we got the mortgage bubble. Conversely, the tendency of valuations to collapse amid risk aversion and divergent market internals – regardless of Fed easing – is how we got the global financial crisis. The Fed has proven itself quite good at amplifying speculation and encouraging excessive issuance of low grade securities when investors are inclined to speculate, and then feigning heroism when the bubbles of its own making collapse amid periods of investor risk-aversion. While an improvement in our gauges of market internals would suggest fresh speculative pressures, the current deterioration and divergence of market internals substantially increases the downside risk of record valuations.
Fed purchases of Treasury securities can certainly enable Congress to run enormous fiscal deficits. It’s also true that extraordinary issuance of government liabilities, particularly in the face of output constraints, can provoke revulsion toward both government bonds and currency, with a corresponding loss of value (which we observe in the form of rising interest rates and inflation). What the Fed emphatically does not control is some manageable “tradeoff” between inflation and unemployment. Instead, the Fed has become almost entirely reliant on a narrative that its actions “support” the financial markets. When that narrative breaks – because it is in fact a narrative, not a mechanistic relationship – all hell will break loose, as it did in 2000-2002 and 2007-2009 despite persistent Fed easing. The outcome will be even worse if the Fed is itself constrained by inflation pressures.
Regardless of whether current valuation extremes are resolved by a market collapse, or instead by a long period of negative real returns where stocks essentially go nowhere in an interesting way, I strongly believe that value-conscious, disciplined, hedged investment strategies can play an important role for investors. In my view, the most flexible way to navigate the road ahead is to own a broadly diversified stream of cash flows reflecting a value-conscious selection discipline, and to choose whether – and how much – to hedge the market risk of that portfolio by attending to prevailing valuations, market internals, and other factors as they change over time. That focus is central to every investment strategy we pursue.
Easier and easier money, bigger and bigger deficits – that’s the destiny, until – and this is the big risk. A deflationary slowdown is easy for policy makers. They’ll print more money and spend more money. What’s hard is when they’re constrained, and that constraint is obviously inflation and currency, and that’s where the gig will be up. That’s actually what, in our view, everybody has to start hedging in their portfolios – it’s not the next disinflationary or deflationary downturn. It’s essentially inflation and currency problems becoming constraints on the government and this world where we’ve been living in where policy makers can get whatever they want from the stock market and interest rates to one where they can’t.
You’d better be hedged. Equities are not attractive on an outright basis. They’re only ordered, like cash flows. Almost any cash flow that’s out there is not attractive on an outright basis, only attractive relative to interest rates… So basically getting those cash flows by packaging up – not the bubble stocks or whatever – but getting the cash flows of companies that are likely to move up and down with nominal GDP and hedging the risk that the central bank can’t maintain control of the economy.
– Greg Jensen, Co-CIO, Bridgewater Associates
The End Game with Grant Williams, 7/29/21
Keep Me Informed
Please enter your email address to be notified of new content, including market commentary and special updates.
Thank you for your interest in the Hussman Funds.
100% Spam-free. No list sharing. No solicitations. Opt-out anytime with one click.
By submitting this form, you consent to receive news and commentary, at no cost, from Hussman Strategic Advisors, News & Commentary, Cincinnati OH, 45246. https://www.hussmanfunds.com. You can revoke your consent to receive emails at any time by clicking the unsubscribe link at the bottom of every email. Emails are serviced by Constant Contact.
The foregoing comments represent the general investment analysis and economic views of the Advisor, and are provided solely for the purpose of information, instruction and discourse.
Prospectuses for the Hussman Strategic Growth Fund, the Hussman Strategic Total Return Fund, the Hussman Strategic International Fund, and the Hussman Strategic Allocation Fund, as well as Fund reports and other information, are available by clicking “The Funds” menu button from any page of this website.
Estimates of prospective return and risk for equities, bonds, and other financial markets are forward-looking statements based the analysis and reasonable beliefs of Hussman Strategic Advisors. They are not a guarantee of future performance, and are not indicative of the prospective returns of any of the Hussman Funds. Actual returns may differ substantially from the estimates provided. Estimates of prospective long-term returns for the S&P 500 reflect our standard valuation methodology, focusing on the relationship between current market prices and earnings, dividends and other fundamentals, adjusted for variability over the economic cycle.