

Weighing Machine, Voting Machine


John P. Hussman, Ph.D.
President, Hussman Investment Trust
November 2022
The influence of what we call analytical factors over the market price is both partial and indirect – partial because it frequently competes with purely speculative factors which influence the price in the opposite direction; and indirect, because it acts through the intermediary of people’s sentiments and decisions. In other words, the market is not a weighing machine, on which the value of each issue is recorded by an exact and impersonal mechanism, in accordance with its specific qualities. Rather we should say that the market is a voting machine, whereon countless individuals register choices which are the product partly of reason and partly of emotion. Hence the prices of common stocks are not carefully thought out computations, but the resultants of a welter of human reactions.
– Benjamin Graham and David Dodd, Security Analysis, 1934
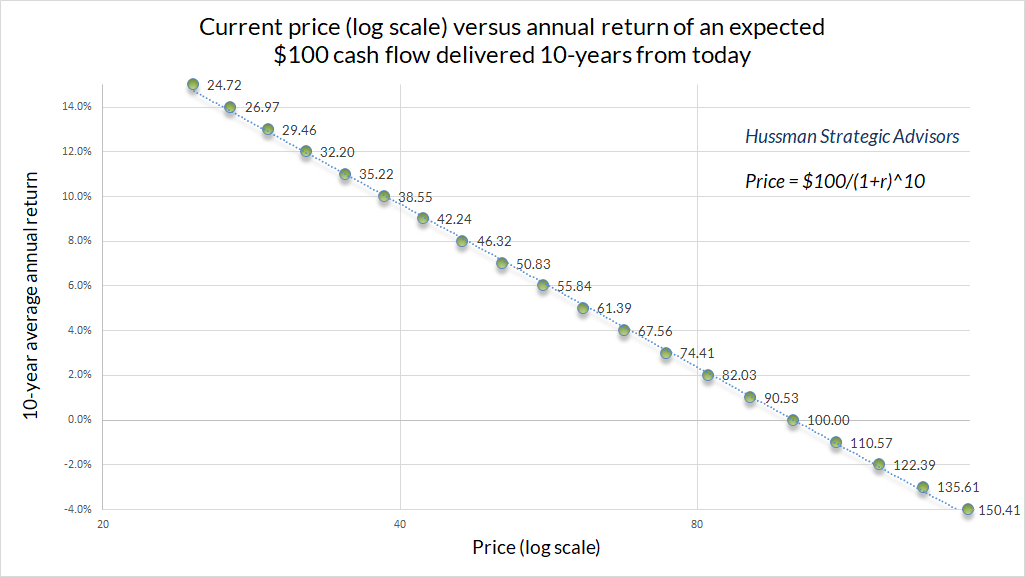
Two aspects of the financial markets operate simultaneously. Emphatically, they do not operate alternately, but simultaneously. One aspect is driven entirely by arithmetic. Every security is a claim to some long-term stream of cash flows that will be delivered to the holder, or series of holders, over time. The future cash flows and the current price are linked by a long-term rate of return. You can think of the long-term return as the slope between the current price and the future payments. Pure arithmetic. Given any set of future cash flows, the lower the price an investor pays, the higher the long-term return an investor can expect.
Nothing ensures that the price is reasonable, but reasonable or not, the moment you know both the cash flows and the current price, you also know the long-term return. Even if investors pay $150 today for an IOU that will deliver just $100 a decade from today, the arithmetic still holds – in this case, the investor can expect a 10-year return of ($100/$150)^(1/10)-1 = -4% annually. Investors may be insane to pay that price, but the math is just math.
The arithmetic that links current price, future cash flows, and long-term return is equally true for stocks as it is for bonds. The main difference is that the cash flows for stocks are typically longer-term, and some amount of estimation is required. Still, given an estimate of future cash flows, the math is the same.
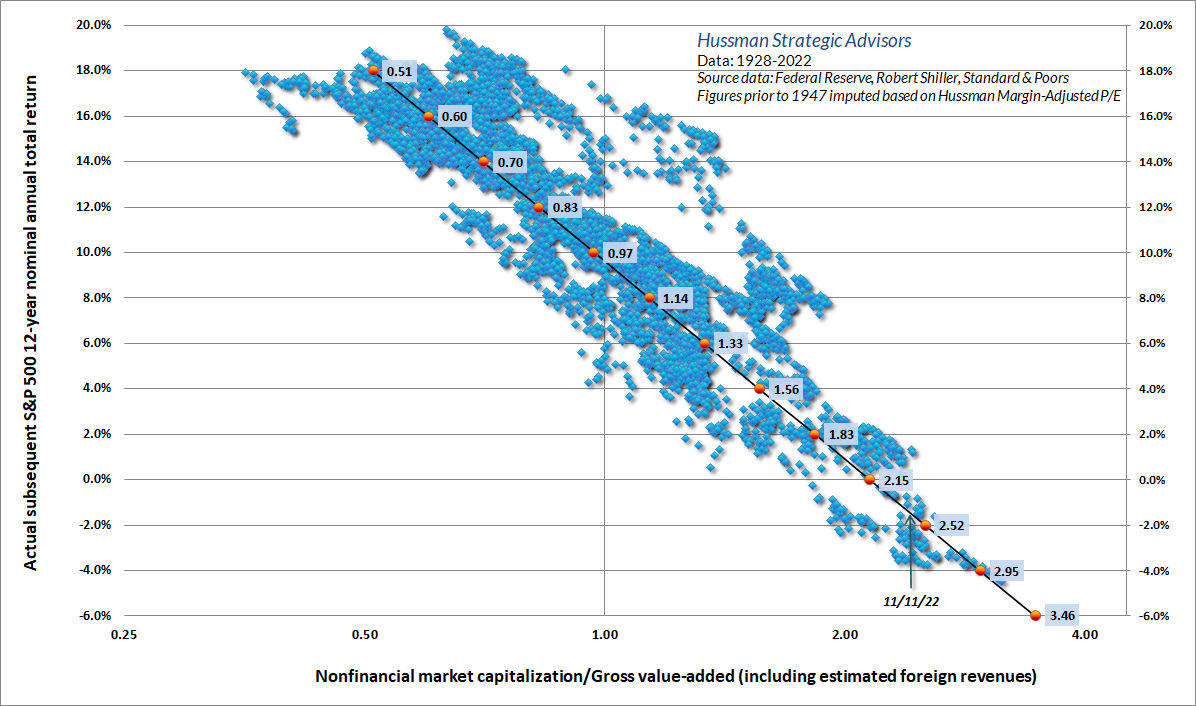
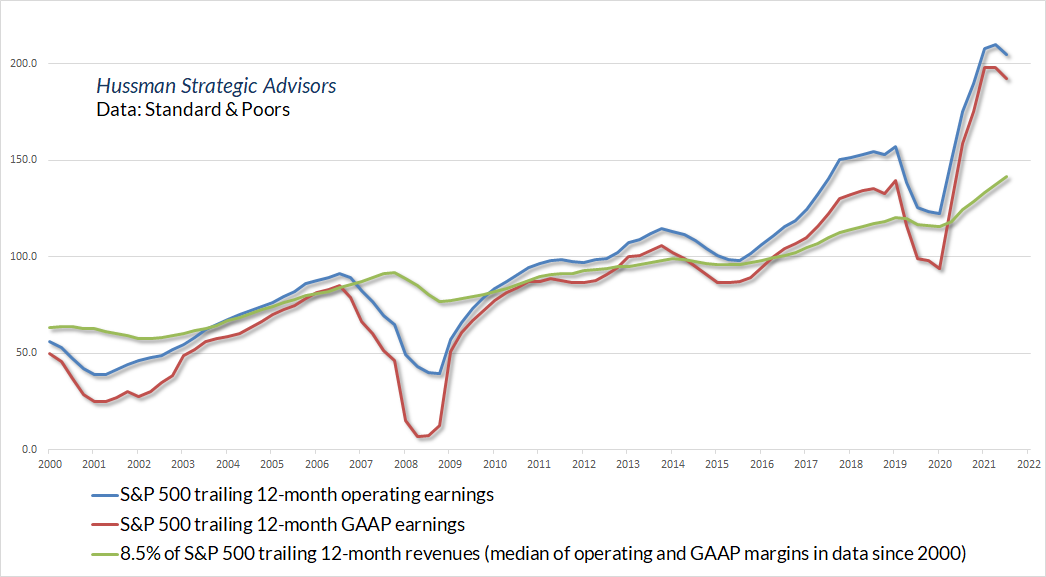
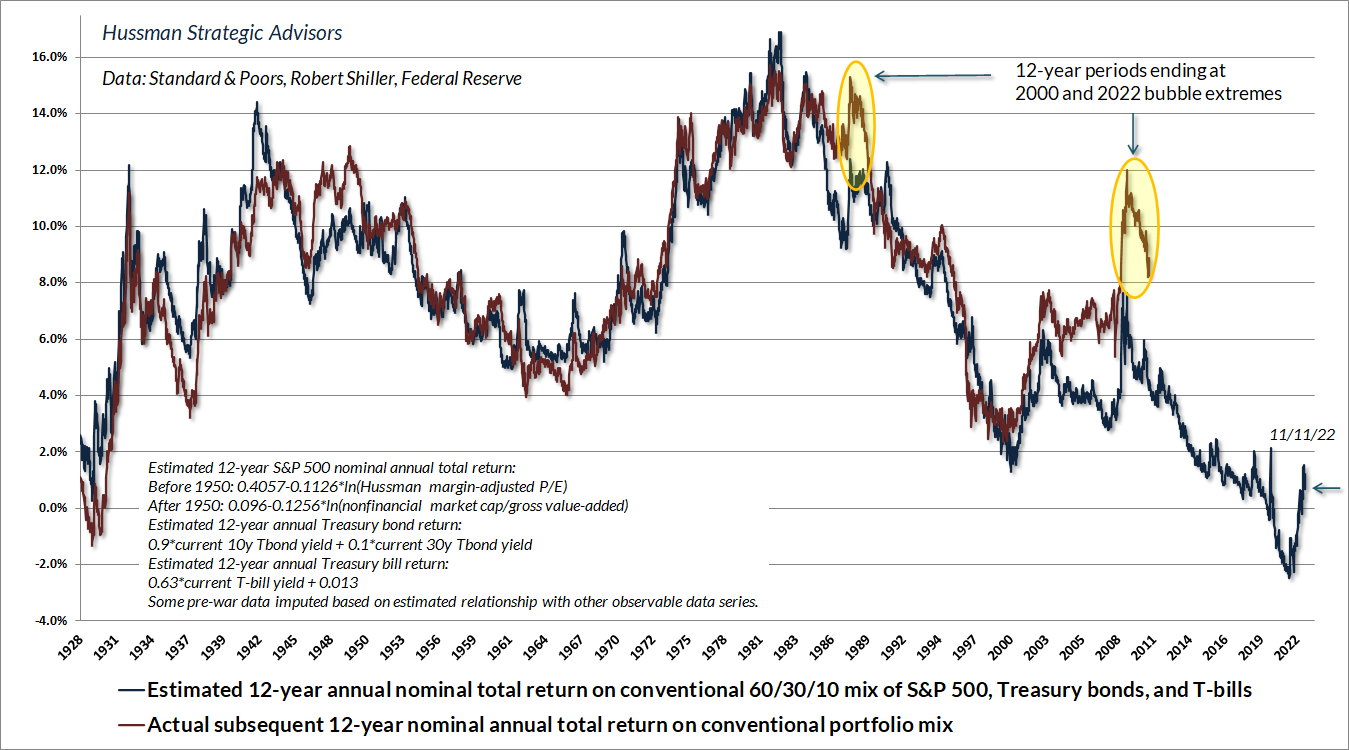
For individual stocks, we do a great deal of discounted cash-flow analysis. For the stock market as a whole, we can use “valuation multiples” as shorthand, but only if the fundamental is reasonably representative and proportional to long-term cash flows. Specifically, we find that earnings are poor denominators for market valuation multiples, while less cyclical measures like revenues and even GDP are much more reliable. The chart below shows our most reliable market valuation measure – nonfinancial market capitalization to gross-value added, including estimated foreign revenues – versus the actual 12-year average annual nominal total return of the S&P 500 index. Presently, we expect negative average annual nominal total returns for the S&P 500 over the coming 10-12 years, as we also projected in 2000.
The tricky part is that investors do not obey any formula that requires the valuations they pay, or the returns they accept, to be wise rather than stupid. We’ve seen far too much “stupid” in this bubble, particularly at the speculative edges, where the implosion is already clearly underway.
This brings us to the other aspect of the financial markets, which is investor psychology. The price of a security at any given time is the highest price the most eager buyer is willing to pay, and the lowest price the most eager seller is willing to accept. That’s it. Given any piece of news, if the buyers become more eager, and the sellers back away, the price goes up. If the sellers become more eager and the buyers back away, the price goes down. If either side becomes more eager and the other side doesn’t, the price doesn’t change, but a lot of volume is exchanged. The specific piece of news doesn’t matter. It doesn’t even matter if it’s true. The only thing that matters is what is in the head of the most eager buyer and the most eager seller. As Graham and Dodd observed nearly a century ago, the market “responds to factual data not directly, but only as they affect the decisions of buyers and sellers.”
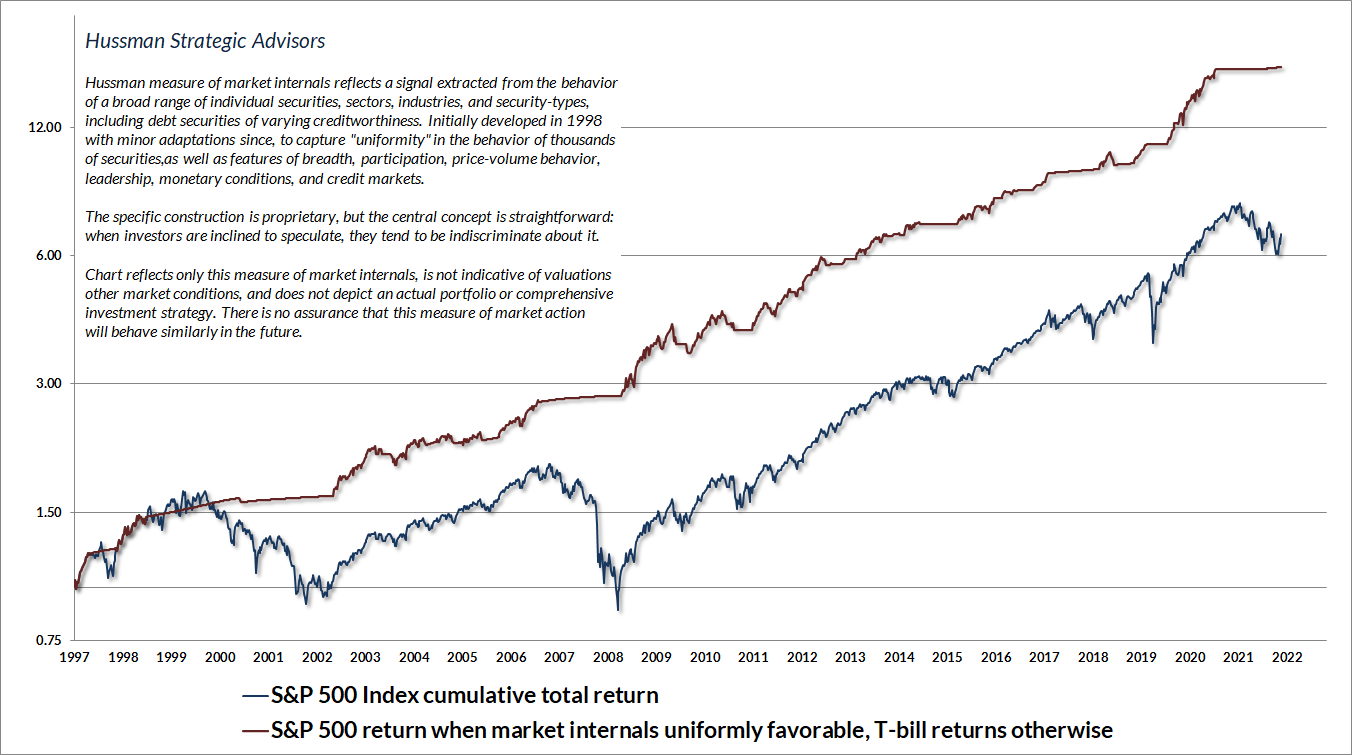
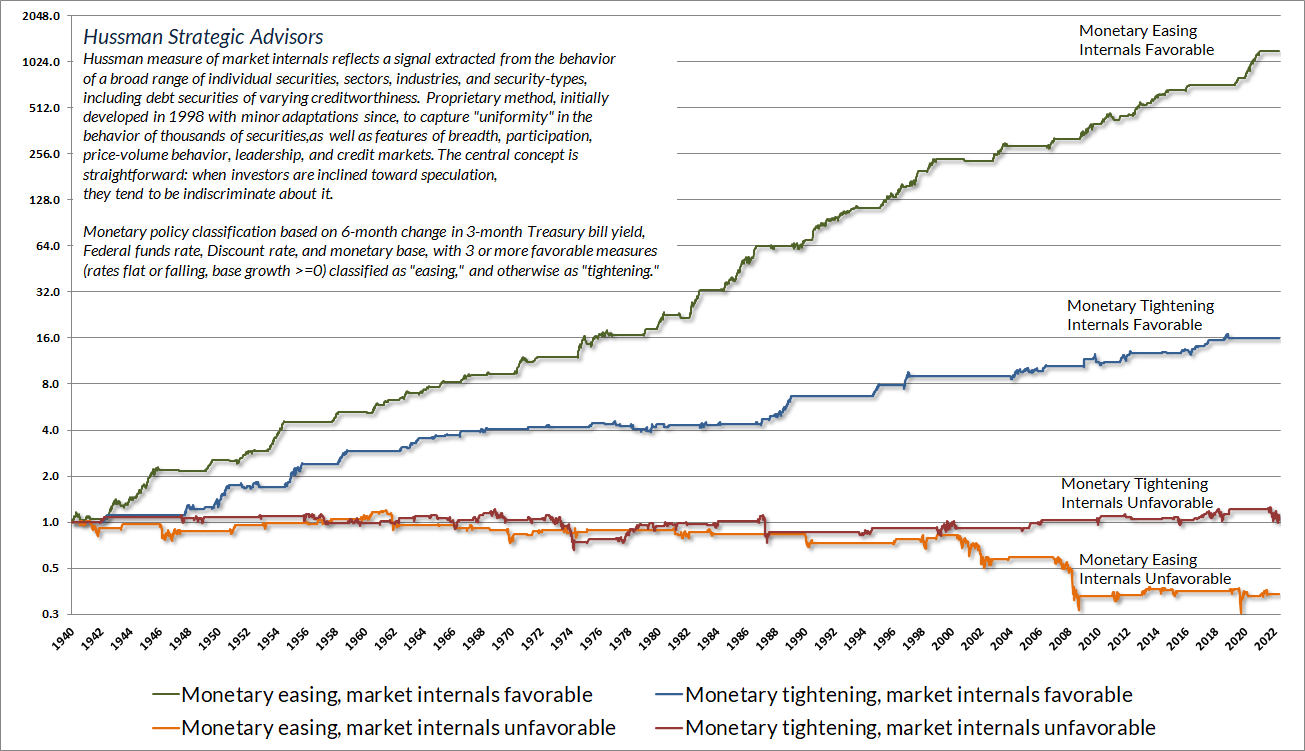
In our own discipline, we gauge investor psychology based on the uniformity or divergence of market internals across thousands of individual stocks, sectors, industries, and security-types, including debt securities of varying creditworthiness. When investors are inclined to speculate, they tend to be indiscriminate about it, so “uniformity” of market action offers an indication that they’ve got the speculative bit in their teeth. In contrast, risk-aversion encourages investors to become more selective, which we observe as ragged, divergent market action.
The chart below presents the cumulative total return of the S&P 500 in periods where our measures of market internals have been favorable, accruing Treasury bill interest otherwise. The chart is historical, does not represent any investment portfolio, does not reflect valuations or other features of our investment approach, and is not an assurance of future outcomes. On average, our gauge of market internals shifts about twice a year, though about 25% of shifts persist for fewer than 6 weeks, and about 25% persist for 40 weeks or longer.
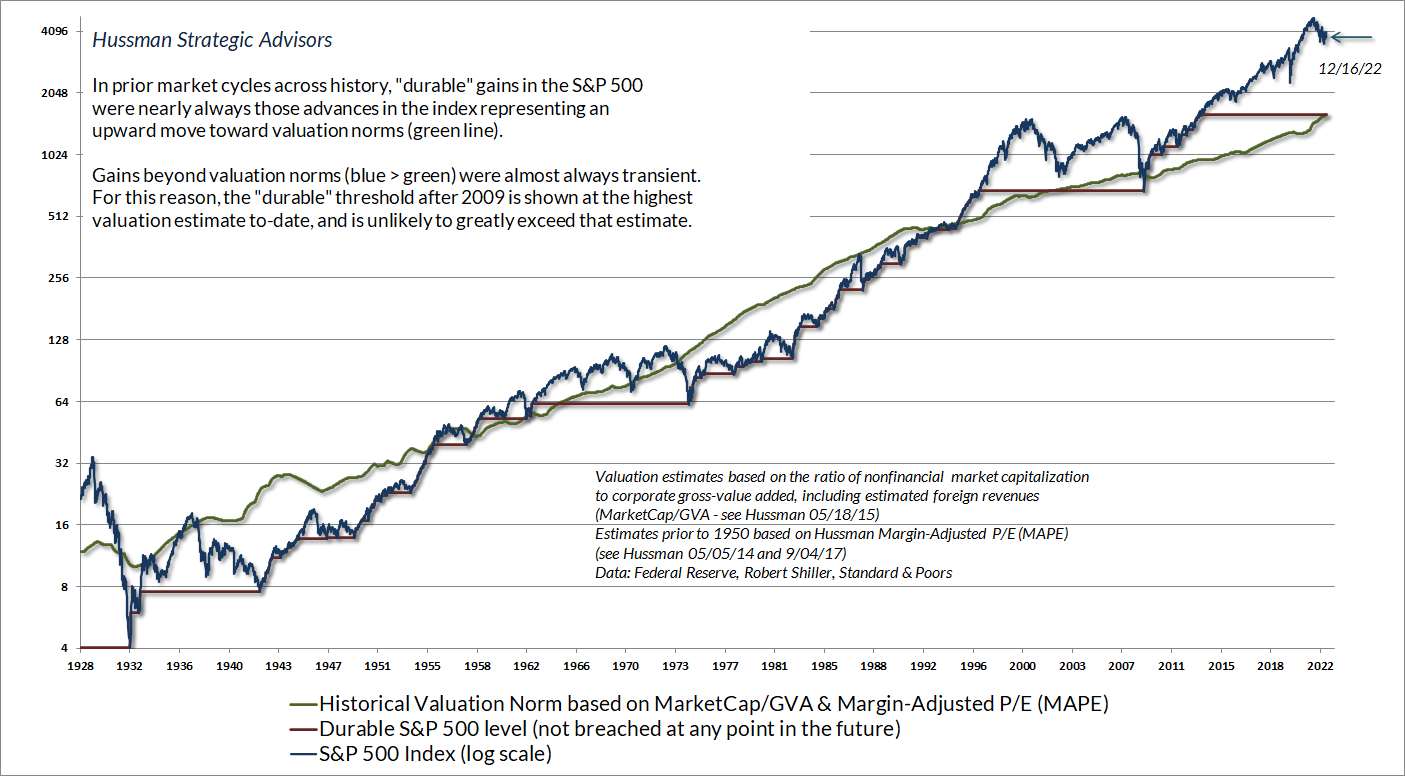
When market participants are inclined to speculate, the combination of eager buyers and reluctant sellers can drive the financial markets to valuations that make little sense from the standpoint of long-term returns. That’s particularly true when the speculation persists for a long period of time, as it did from 1921-1929, 1990-2000, and more than a decade since 2009 – reaching a striking crescendo at the beginning of this year. In these cases, the “benefits” of past speculation, and the “uselessness” of valuations become so obvious to investors that they become overconfident that the “new era” will continue forever. Then the Dow loses 89% of its value (1929-1932), the Nasdaq 100 loses 82% of its value (2000-2002) and we expect, the S&P 500 gets to a point (2022) where a loss of two-thirds would merely bring market valuations to their run-of-the-mill historical norms. Despite year-to-date market losses, a further decline of roughly 58% would still be required to reach ordinary valuation norms. That’s a loss of about 35%, from here, followed by yet another loss that wipes out 35% of what’s left. You know I’m not kidding.
Be careful not to interpret valuations as near-term market forecasts. That’s not how valuations work. Valuations only exert reliable effects on long-term, full-cycle outcomes, not near-term ones. The main thing that determines whether an overvalued market continues to advance, or drops like a rock instead, is whether investor psychology is inclined toward speculation or risk-aversion.
What about monetary policy? Recall that opening quote by Graham & Dodd. I can’t stress this point enough. Just like valuations, monetary policy “acts through the intermediary of people’s sentiments and decisions.” While monetary policy can certainly influence speculative psychology, investors will create a world of pain for themselves if they base their investment decisions directly on Fed policy.
See, easy money “works” by creating a pile of low-interest liquidity that investors can get rid of only by trading it to someone else. If you put it “into” stocks, the seller takes it right back out. It can’t turn into something else. It can only change hands. It will either sit in someone’s bank account, or move to someone else’s, until the Fed retires it. The key question that determines the effect of monetary policy on the stock market is this: how comfortable or uncomfortable is it to hold the pile of base money created by the Fed?
When investor psychology shifts toward speculation, low-interest liquidity is treated as an inferior asset. Low or zero interest rates are intolerable to speculative investors, so they chase stocks in an attempt to get rid of their monetary hot potatoes. At the beginning of 2022, the Fed was forcing investors to choke down 36% of GDP in zero-interest base money (most of which investors held indirectly as bank deposits, and money market funds doing “reverse repos” with the Fed). That pile of “inferior” assets, combined with speculative investor psychology, encouraged a bubble that exceeded 1929 and 2000 valuation extremes.
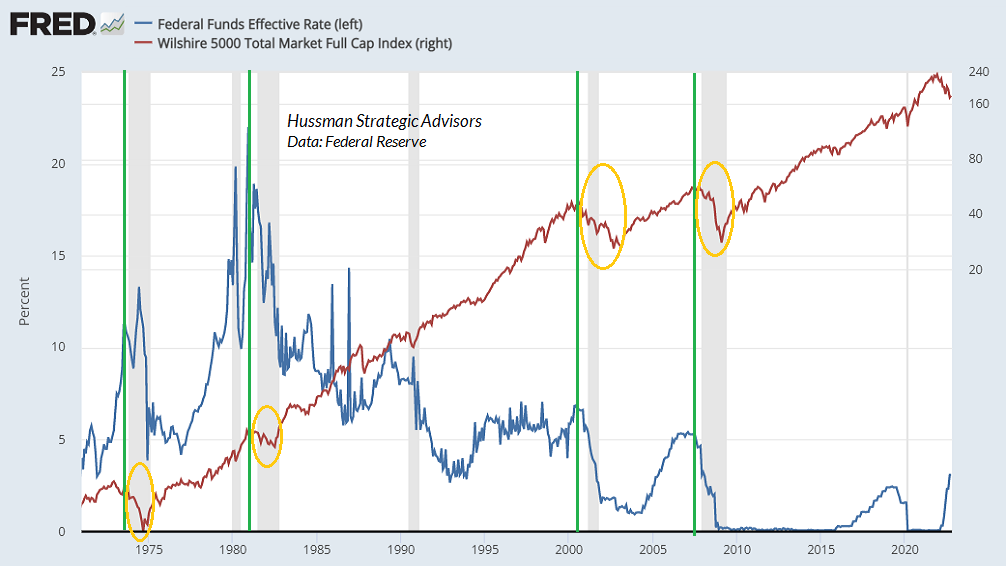
In contrast, when investor psychology shifts toward risk-aversion, safe, low-interest liquidity becomes a desirable asset rather than an inferior one, so creating more of the stuff does nothing to support the market. Investors should remember this from 2000-2002 and 2007-2009, when the market collapsed even as the Fed eased aggressively the whole way down.
The chart shows the cumulative total return of the S&P 500 across four mutually exclusive combinations of monetary policy and market internals. The lesson is clear: it’s not actually Fed easing, but speculative psychology, that you should care most about. Notice that risk-aversion (unfavorable internals), joined by monetary easing, is the worst of all worlds.
The hard lesson of zero interest rates – at least for us – was that as long as investors had the speculative bit in their teeth, no amount of speculation was too much, no matter how extreme from a historical perspective. I suspect that as this bubble unwinds, the hard lesson for others will be that as long as investors remain risk-averse, no amount of Fed easing will support the market – it certainly didn’t during the bulk of the 2000-2002 and 2007-2009 collapses. Indeed, even during the recent bubble, none of the net gains of the S&P 500 accrued in periods when market internals were unfavorable. The beautiful thing about a well-defined, historically-informed investment discipline is that there’s no need to forecast Fed actions or changes in investor psychology. It’s enough to shift our investment outlook as measurable, observable conditions shift.
Navigating the market cycle
With the market nearly 20% off its highs, it is rather easy to say that stocks are in a ‘bear market.’ However, this type of label is simply a snapshot, and says nothing about future prospects for the market. We expect that many investors, particularly short sellers, will realize several months from now that they sold at wholesale. We have a good buying opportunity here, and temporary downmoves only magnify the attractiveness of recommended portfolios. Investors wishing to wait until the Gulf crisis and budget problems are resolved will have to buy at significantly higher prices. Reestablish a 100%, fully invested position.
– John P. Hussman, Ph.D., Monthly market letter, volume 3, number 10, October 12, 1990
Historically, when trend uniformity has been positive, stocks have generally ignored overvaluation, no matter how extreme. When the market loses that uniformity, valuations often matter suddenly and with a vengeance. This is a lesson best learned before a crash rather than after one. Valuations, trend uniformity, and yield pressures are now uniformly unfavorable, and the market faces extreme risk in this environment.
– John P. Hussman, PhD., Hussman Investment Research & Insight, October 3, 2000
Last week, we noted in our weekly market comment that the stock market has recruited enough ‘trend uniformity’ to shift the Market Climate to a favorable condition. This is the first comprehensive shift in trend uniformity since it turned decisively unfavorable on September 1st, 2000. Since then, the S&P 500 has lost over 40% of its value. Generally speaking, the hallmark of uniformity is ‘lack of negative divergence.’ We don’t measure the extent or duration of an advance – rather, we measure the quality of market action in terms of its agreement across a wide range of indices, industries, and security types (both stocks and bonds).
– John P. Hussman, Ph.D., Hussman Investment Research & Insight, May 12, 2003
One of the best indications of the speculative willingness of investors is the ‘uniformity’ of positive market action across a broad range of internals. Probably the most important aspect of last week’s decline was the decisive negative shift in these measures. Since early October of last year, I have at least generally been able to say in these weekly comments that ‘market action is favorable on the basis of price trends and other market internals.’ Now, it also happens that once the market reaches overvalued, overbought, and overbullish conditions, stocks have historically lagged Treasury bills, on average, even when those internals have been positive (a fact which kept us hedged). Still, the favorable internals did tell us that investors were willing to speculate, however abruptly that willingness might end. Evidently, it just ended, and the reversal is broad-based.
– John P. Hussman, Ph.D., Weekly Market Comment, July 30, 2007
The best way to begin this comment is to reiterate that U.S. stocks are now undervalued. I realize how unusual that might sound, given my persistent assertions during the past decade that stocks were strenuously overvalued (with a brief exception in 2003). Still, it is important to understand that a price decline of 40% (and even more in some indices) completely changes the game. Last week, we also observed early indications of an improvement in the quality of market action, and an easing of the upward pressure on risk premiums. In 2000, we could confidently assert that stocks would probably deliver negative total returns over the following 10-year period. Today, we can comfortably expect 8-10% total returns even without assuming any material increase in price-to-normalized earnings multiples. Given a modest expansion in multiples, a passive investment in the S&P5 00 can be expected to achieve total returns well in excess of 10% annually.
– John P. Hussman, Ph.D., Weekly Market Comment, October 20, 2008
“Permabear” who shifts to a constructive investment outlook after every bear market. Go figure. No question I shot my own foot in this bubble, first by insisting on stress-testing our discipline against Depression-era data, and later by responding to overvalued, overbought, overbullish “limits” that had been reliable across history. But boy do they forget who you are. [sigh]
John, I don’t think anybody would believe me if I told them that back in the early 1990s I used to refer to you as one of my column’s “resident bulls…”
And then… we started getting charts like this! 😱🤣 https://t.co/sfQmHYkNxb
— Herb Greenberg (@herbgreenberg) December 6, 2021
Warren Buffett paraphrased Ben Graham in 1987, saying “In the short run, the market is a voting machine but in the long run, it is a weighing machine.” In my view, those two aspects of the financial markets operate simultaneously. Both are measurable, and both are indispensable. Valuations are the “weighing machine” and provide information about likely long-term investment returns and the potential extent of market losses over the completion of any market cycle. Market internals are the “voting machine” and provide information about speculative versus risk-averse investor psychology. Presently, both the weighing machine and the voting machine point in the same direction. That will change. Until it does, ignoring them is a mistake.
Valuations always matter, but the immediacy of their consequences depends on market internals. Once extreme valuations are joined by unfavorable internals, the trap door swings wide open. If anything, our attention to the combination of valuations and market internals has become more – not less – important in our investment discipline over the past three decades.
In the long-term, you can’t avoid the investment returns that are embedded into valuations. In the short-term, you can’t fight what’s in the heads of investors.
The only thing truly “different” about the recent speculative bubble is that zero interest rate policy disabled historically reliable “limits” to speculation. In previous market cycles across history, these limits could be gauged by extreme syndromes of “overvalued, overbought, overbullish” market action. My admitted error amid zero-interest rate policy was to respond bearishly to these syndromes, as one could have in other market cycles. As it happened, once interest rates hit zero, investors embraced the idea that “there is no alternative” (TINA) but to speculate, and it became detrimental to adopt a bearish outlook until market internals deteriorated explicitly.
In late-2017, we abandoned our bearish response to these overextended syndromes in periods when market internals were still favorable. Last year, we expanded our willingness to adopt a constructive outlook even amid hypervalued market conditions (with position limits and safety nets of course) when internals are favorable – something Benjamin Graham might describe as “intelligent speculation.” In recent years, these adaptations have restored the strategic flexibility that allowed us to admirably navigate complete market cycles for decades prior to quantitative easing. The impact of those adaptations is already evident despite still-extreme valuations and a nearly 30% advance in the S&P 500 since 2019.
Valuations are the “weighing machine” and provide information about likely long-term investment returns and the potential extent of market losses over the completion of any market cycle. Market internals are the “voting machine” and provide information about speculative versus risk-averse investor psychology. Presently, both the weighing machine and the voting machine point in the same direction. That will change. Until it does, ignoring them is a mistake.
Examine your risks, maintain discipline
The core of our value-conscious, historically-informed, risk-managed, full-cycle investment discipline is to align our market outlook with measurable, observable, prevailing market conditions, and to shift our outlook as those conditions shift. Valuations say a great deal about prospective 10-12 year returns and full-cycle risks, but the immediacy of those outcomes depends on the condition of market internals (speculative versus risk-averse investor psychology). Likewise, the impact of easy money depends on the condition of market internals. Fed easing can amplify speculation, but it doesn’t substitute for it.
In the long-term, you can’t avoid the investment returns that are embedded into valuations. In the short-term, you can’t fight what’s in the heads of investors. Fortunately, it’s enough gauge these conditions and respond to them as they change. From our perspective, near-term forecasts and scenarios are unnecessary, as much as investors and financial television might focus on such predictions.
With that in mind, it may be helpful to offer some idea of how we view various crosswinds in the financial markets here.
Undoubtedly the main focus of investors here is whether the Fed will “pivot,” and to what extent the slight downtick in year-over-year inflation suggests an “all clear” signal for the market. My answer is simple – buckle up. Even with a two-tenths of a percent surprise in October core CPI inflation (0.3% vs 0.5% expected), the 6.3% year-over-year rate is far above the Fed’s 2% target, while core personal consumption expenditures (PCE) inflation is at 5.1% and the U.S. unemployment rate is just 3.7%. As I noted last month, the Fed has never pivoted to easing with the Federal funds rate below core PCE inflation + 0.5 x (4% – unemployment), and only in 2019 did the Fed pivot anywhere close to that threshold. At present, that threshold stands at 5.1% + 0.5 x (4% – 3.7%) = 5.25%.
It’s certainly possible that the Fed will raise rates by only 0.50% in December (to about 4.5%) rather than 0.75%, if that’s what investors call a “pivot,” yet unless we observe a shift to uniformly favorable market internals, any larger surprise from the Fed would likely be negative for the market. It’s easy to forget that the 1973-74, 1981-82, 2000-02, and 2007-09 bear markets all unfolded after the initial Fed pivot. Even the ’73-74 pivot was short lived amid high inflation. Unless market internals are favorable, pivots amid recession risk typically say that “something just broke”
While I’ve detailed the impact of profit margins, taxes, interest rates and other considerations on our valuation measures (see for example the section titled “The new era” in The Structural Drivers of Investment Returns), the eagerness of investors to abandon historically-reliable valuation measures is perennial. The same was true, of course, at the 2000 and 2007 market peaks, so we’re used to it. The most useful answer here isn’t to continue discussing valuations, but to focus on their companion, which is our gauge of market internals.
When market internals suggest risk-aversion among investors, as they do here, the level of valuations may inform our level of defensiveness, but we’re not likely to be unhedged or leveraged in any case. Conversely, when market internals suggest a shift to speculative psychology, whenever that shift occurs, we’re not going to “fight” a market advance. The level of valuation will affect whether we impose position limits or safety nets, but in general, if internals are constructive, our investment outlook will be constructive.
So, while valuations are important, and they’re certainly helpful in setting our expectations about expected return and risk, nothing in our investment discipline requires our valuation measures to reach or even approach their historical norms – ever again. I do expect that they will, but we’ll be fine if they don’t. If you understand our investment discipline, and particularly the adaptations we’ve made in recent years, all of that should make perfect sense.
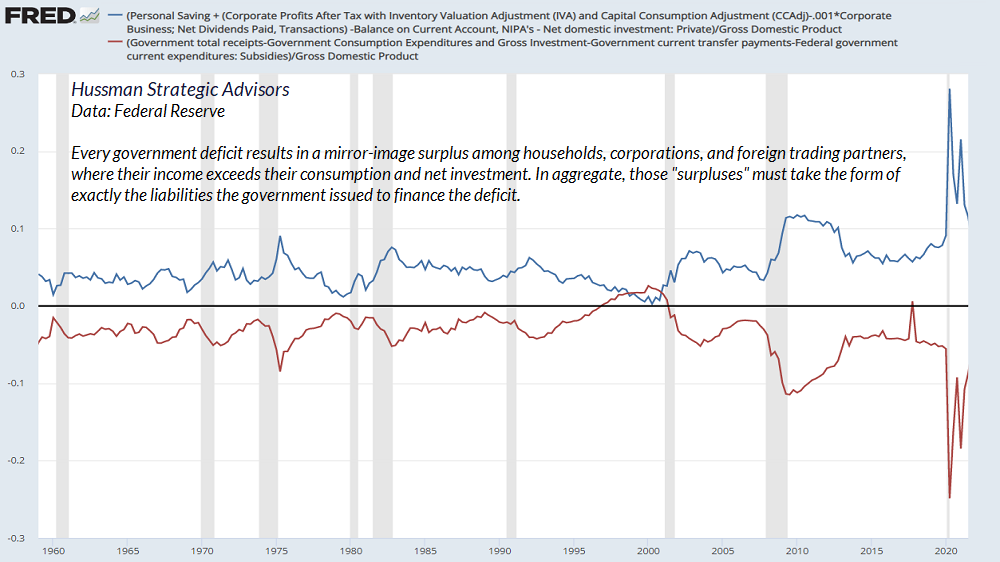
That said, investors should think twice about assuming profit margins will remain at record highs permanently. As I’ve detailed before, every deficit of government emerges as a surplus of some other sector – households, corporations, or foreign trading partners – where their income exceeds their consumption and net investment. Those surpluses, in aggregate, must take the form of exactly the liabilities that the government issued to finance the deficit. Since the Fed bought a boatload of government debt during the pandemic, the public is left holding base money, which someone will have to hold until it is retired. At least it’s earning 3.9% interest now, which makes its speculative impact dramatically smaller than it was when it was earning zero.
In recent years, pandemic deficits have boosted corporate profits directly (through PPP subsidies) and indirectly (through transfer payments to households that have gradually been spent down). Those deficits were accompanied by record corporate profits. Our expectation is that recent record profit margins will prove to be equally temporary. At the pre-pandemic high of February 19, 2020 the S&P 500 price/revenue ratio reached 2.43, eclipsing the previous record of 2.36 at the 2000 market peak. The belief that today’s 2.31 ratio is a “buying opportunity” – just 2% lower – relies on the amplifying impact of pandemic deficits on profits to be permanent.
Despite the market losses year-to-date, my view is that prospective 10-12 year returns for a passive investment allocation remain dismal. The recent rally in stock market has driven our estimates of 10-12 year S&P 500 nominal total returns back below zero, while enthusiasm over a small retreat in inflation has brought bond yields down as well. As I noted last month (see the section titled “Far from a Fed pivot” in Estimating Downside Market Risk), the 10-year Treasury bond yield has rarely stood below the weighted average of Treasury bill yields (0.50), core CPI inflation (0.25), and nominal GDP growth (0.25). Presently, that weighted average is above 5%. That may very well come down as inflation abates, or recession takes hold. Still, my impression is that a 3.7% yield on the 10-year bond requires speculation about those outcomes, particularly in a market where one can earn 4% – and likely more shortly – from 3-month Treasury bills.
It’s equally important to recognize that the stock market losses that we’ve observed year-to-date are merely a give-back of the frothiest segment of the recent market bubble. Our most reliable valuation measures still match the extremes we observed in 1929, 2000 and the 2020 pre-pandemic high. A retreat to run-of-the-mill valuation norms would require a further loss of 58% in the S&P 500 – from here. We don’t require that outcome, but we absolutely wouldn’t rule it out.
The hope for a material advance in stocks relies on valuations pushing beyond historical extremes. If our measures of market internals were to improve, and particularly if speculation was amplified by zero interest rates, there might be a basis for that hope. Presently however, market conditions feature valuations seen only at historic bubble peaks – not bear market troughs – along with unfavorable market internals and the likelihood of continued rate hikes, even if at a slower rate than 75 basis points a pop. From a historical perspective, that’s a violently unfavorable set of market conditions. Hope is not an investment strategy.
On Friday, September 1st, the S&P 500 rallied to a peak of 1520.77, capping a string of strong advances. Yet due to a deterioration of market action in a number of economically sensitive groups, our price trend model indicated that trend uniformity had shifted to an unfavorable condition, and we moved to defend our portfolios more fully against downside risk. On Friday September 15th, our yield trend model also shifted to a negative condition, indicating that the overall trend of interest rates and other yields was upward and potentially hostile. The combination of all three factors – unfavorable valuation, unfavorable trend uniformity, and unfavorable yield trends – is what we identify as a Crash Warning. This does not mean that a crash is certain, but it does place the market in a condition which has historically occurred less than 3% of the time, and from which every major market crash has emerged.
– John P. Hussman, Ph.D., Hussman Investment Research & Insight, October 3, 2000
The S&P 500 lagged Treasury bills from September 2000 through February 2013, losing half of its value on two separate occasions along the way. The S&P 500 lagged Treasury bonds through April 2020, requiring a further advance to the most extreme valuations in history to bring S&P 500 total returns beyond those of Treasury securities. By the completion of this cycle, I expect that the S&P 500 will have lagged Treasury bills for nearly 24 years from its 2000 peak.
Valuations and market internals matter. Valuations are extremely informative about likely long-term returns, and the potential extent of market losses over the completion of a given market cycle. The uniformity or divergence of market internals provides information about speculation and risk-aversion over shorter segments of the market cycle. A market collapse is nothing but a low risk-premium quickly driven higher – steep valuations meeting risk-aversion. A new bull market is nothing but a high risk-premium quickly driven lower – depressed valuations meeting fresh speculation. Understand these concepts, measure them properly, have the discipline to act on them over the complete market cycle, and everything else is finesse.
Keep Me Informed
Please enter your email address to be notified of new content, including market commentary and special updates.
Thank you for your interest in the Hussman Funds.
100% Spam-free. No list sharing. No solicitations. Opt-out anytime with one click.
By submitting this form, you consent to receive news and commentary, at no cost, from Hussman Strategic Advisors, News & Commentary, Cincinnati OH, 45246. https://www.hussmanfunds.com. You can revoke your consent to receive emails at any time by clicking the unsubscribe link at the bottom of every email. Emails are serviced by Constant Contact.
The foregoing comments represent the general investment analysis and economic views of the Advisor, and are provided solely for the purpose of information, instruction and discourse.
Prospectuses for the Hussman Strategic Growth Fund, the Hussman Strategic Total Return Fund, the Hussman Strategic International Fund, and the Hussman Strategic Allocation Fund, as well as Fund reports and other information, are available by clicking “The Funds” menu button from any page of this website.
Estimates of prospective return and risk for equities, bonds, and other financial markets are forward-looking statements based the analysis and reasonable beliefs of Hussman Strategic Advisors. They are not a guarantee of future performance, and are not indicative of the prospective returns of any of the Hussman Funds. Actual returns may differ substantially from the estimates provided. Estimates of prospective long-term returns for the S&P 500 reflect our standard valuation methodology, focusing on the relationship between current market prices and earnings, dividends and other fundamentals, adjusted for variability over the economic cycle. Further details relating to MarketCap/GVA (the ratio of nonfinancial market capitalization to gross-value added, including estimated foreign revenues) and our Margin-Adjusted P/E (MAPE) can be found in the Market Comment Archive under the Knowledge Center tab of this website. MarketCap/GVA: Hussman 05/18/15. MAPE: Hussman 05/05/14, Hussman 09/04/17.