

Why Market Valuations are Not Justified By Low Interest Rates


John P. Hussman, Ph.D.
President, Hussman Investment Trust
October 2017
Note: This is an extended commentary, detailing what I believe are critical considerations for investors here. You’re probably going to need a cup of coffee, a snack, a calculator, and possibly a nap along the way. There’s a lot here, and reading it more than once may be useful. To feature this discussion for a sufficient time, and to prevent it from being immediately obscured by new content, my next market comment will be posted on Monday, November 6, 2017 – JPH
Valuations make sense with interest rates where they are.
– Warren Buffett, October 3, 2017
It’s such a comforting, even satisfying assumption; the idea that “lower interest rates justify higher valuations.” The idea is one of the most basic principles of finance. Indeed, investors could consider it a law of investing. Except for the fact that it’s an incomplete sentence. Unfortunately, the convenience of investing-by-slogan, rather than carefully thinking about finance and examining evidence, is currently leading investors into what is likely to be one of the worst disasters in the history of the U.S. stock market.
Here are the propositions that are actually true:
• An investment security is nothing but a claim on some stream of expected future cash flows that will be delivered into the hands of investors over time.
• Provided that the stream of expected future cash flows is held constant, discounting those future cash flows at a lower rate (which is the same as accepting a lower future rate of return), will result in a higher “justified” price today, and this impact can be quantified.
Below, we’ll also establish and demonstrate some additional propositions:
• If interest rates are low because growth rates are also low, no valuation premium on stocks is “justified” by the low interest rates. Prospective returns are reduced without the need for any valuation premium at all.
• Provided that a valuation ratio is based on a “sufficient statistic” for long-term cash flows, the logarithm of that valuation ratio will, in turn, act as a sufficient statistic for long-term investment returns.
• Revenues and margin-adjusted earnings have historically been far more reliable “sufficient statistics” of future cash flows than year-to-year earnings, or even 10-year averages of earnings.
• Currently depressed interest rates are indeed associated with unusually weak current and prospective U.S. growth rates, implying that elevated stock market valuations are not, in fact, “justified” by interest rates at all.
• Margin-adjusted valuation ratios behave as sufficient statistics for likely future stock market returns, and adding information about interest rates improves neither the reliability of return projections, nor the current level of those projections.
By the end of this comment, all of these will be clear. The upshot of these propositions is this. At present, the most reliable measures of U.S. equity market valuation – the measures that are best-correlated with actual subsequent market returns in market cycles across history – are 2.75 times (175% above) their historical norms. Given that depressed interest rates are matched by commensurately low U.S. growth rates, little or none of this premium is actually “justified” by interest rates. Rather, the S&P 500 is likely to post negative total returns over the coming 10-12 year horizon, with a likely interim loss in excess of -60%.
Moreover, even if the growth rates of nominal GDP, S&P 500 revenues, and other fundamentals were to literally double to historically normal rates, yet Treasury bond yields could be held 2.5% below their historical median for another decade, the combination would only “justify” a valuation premium for the S&P 500 of about 2.5% x 10 years = 25% above its corresponding historical valuation norms. We’re already 175% above those norms. There’s no way to make the arithmetic work without assuming an implausible and sustained surge to historically normal economic growth rates, a near-permanent suppression of interest rates despite a full resumption of normal economic growth, and the permanent maintenance of near-record profit margins via permanently depressed real wage growth, despite an unemployment rate that now stands at just 4.2%.
There’s little doubt that the general level of long-term interest rates should be markedly lower than historical norms. But that’s because prospects for long-term growth are also markedly lower than historical norms. Again, the problem is that this combination deserves no valuation premium at all. Expected future stock market returns would be commensurately lower even in the absence of a valuation premium. That’s just how the arithmetic works.
Today’s obscene market valuations are largely the result of a) ignoring the growth side of this relationship, and b) activist central bank policies that have repeatedly driven short-term interest rates to levels that create a mentality of yield-scarcity among investors; where they stop quantifying the effect of rates and simply decide that “there is no alternative” to blindly speculating in risky assets regardless of their valuations. That’s what created the mortgage bubble that ended in the global financial crisis, and it’s what has created the “everything” bubble today. With deep respect, my impression is that Warren Buffett’s statement reflects that same lack of quantification.
What follows is an exposition that includes both theory and evidence. I’ve drawn freely on some of my prior commentaries, so parts will look familiar to long-time readers. But this is important, particularly at present extremes, so I hope you’ll spend some time with it.
The nerve of this Hussman guy
Before we continue, let’s get my own stress-testing narrative in the half-cycle since 2009 right on the table, so my admitted stumble doesn’t quietly draw the focus away from objective data.
In late-October 2008, after the market had collapsed more than 40% in a decline we fully anticipated, I wrote a piece called Why Warren Buffett is Right, and Why Nobody Cares, observing that stocks had become undervalued and the S&P 500 was likely to enjoy strong returns over the decade ahead. Consider today’s comment as a companion piece expressing the opposite view. That late-2008 shift to a constructive outlook, aligned with a material improvement in valuations, was similar to those I had made after every bear market in what is now more than three decades as a professional investor, following a discipline that had repeatedly navigated complete market cycles admirably.
In 2009, I brought a half-cycle’s worth of ignominy upon myself, by insisting on stress-testing our methods against Depression era data, in the face of job losses and banking strains that were wholly outside of the post-war data that then informed our methods of classifying expected market return/risk profiles. It was a reasonable fiduciary decision, but very badly timed. In the midst of that “two data sets” ambiguity, the decision truncated our late-2008 constructive shift, and we missed a rebound that both our pre-2009 and our current methods could have captured. Worse, based on the historical tendency for extreme “overvalued, overbought, overbullish” syndromes to be closely followed by abrupt market losses and deterioration in market internals, the resulting methods prioritized those syndromes ahead of market internals themselves.
Market internals are an important gauge of speculative pressures, because when investors are inclined to speculate, they tend to be indiscriminate about it. Our overreliance on “overvalued, overbought, overbullish” syndromes turned out to be our Achilles Heel in the recent half-cycle. Faced with the novelty of quantitative easing and zero interest rates, investors continued to speculate long after those extreme syndromes emerged. Those syndromes can still justify a rather neutral outlook, but amid the novelty of quantitative easing, the central lesson (and required adaptation) was this: in a zero interest rate environment, it is necessary to wait for explicit deterioration in market internals, indicating a shift in investor preferences toward risk-aversion, before adopting a hard-negative outlook.
At present, we observe extreme overvalued, overbought, overbullish conditions, interest rates are well off the zero bound, and market valuations, even given proper consideration of interest rates, are at the most offensive levels in history. Still, as I noted a few weeks ago, while I view hedges and safety nets as essential here, there’s no need to “fight” a continued advance, if it emerges, with even larger hedges or higher safety nets. With the S&P 500 far beyond twice the level at which I expect it will end this cycle, it will be fine if the initial few percent lower do nothing for us.
Understand that my error in the recent half-cycle traces to my insistence on stress-testing our methods in the face of undervaluation that our own measures clearly identified, and that I openly recognized (but where similar levels in the Depression were still followed by massive market losses). The resulting methods prioritized extreme “overvalued, overbought, overbullish” syndromes ahead of market internals, and amid the novelty of QE and zero-interest rates, led us to fight too hard against objectively extreme valuations and the persistent speculation of investors. It’s a mistake we’ve adapted to, and that we won’t make again. Understanding that narrative doesn’t require investors to overlook that the market was undervalued in 2009, but is wickedly overvalued today.
Recent years have encouraged the illusion that investors will never again feel anything but sheer euphoria. As one of the few observers who anticipated both the tech collapse and the global financial crisis, and who has adopted a constructive or leveraged outlook after every bear market decline in more than three decades, my sense is that this complete lack of imagination about the range of investor emotions is likely to have brutal consequences.
A final note before we get into the data. I’m a great admirer of Warren Buffett. Not because he’s a mysterious Oracle that can be treated as a black box, but because his views have historically lined up with reliable objective evidence on valuations. Buffett was right about rich valuations in 1972, and 2000. He was right about undervaluation in 1974, and 1982, and late-2008. But even humbled by the narrative that followed my stress-testing decision in 2009, I can say one thing with confidence. From the standpoint of a value-conscious, historically-informed, full-cycle investment discipline, it is utterly incorrect to maintain that “valuations make sense with interest rates where they are.”
Meanwhile, I’ve got no personal conflict with people who choose to be bullish here. My motive is to be of service to others, particularly over the complete market cycle. Most of what I’ve made in my lifetime has gone to philanthropic efforts, and the rest is invested in our value-conscious, historically-informed, full-cycle discipline. I’ll continue to follow our discipline on behalf of those who trust my work, whether others agree or not; adapting it where the evidence requires, and maintaining patience where patience is what’s needed most. Despite speculation that has gone beyond every historical precedent in the recent half-cycle, I know that my open concerns about valuations in prior bubbles, as well as the constructive outlooks I’ve adopted after previous bear market declines, have ultimately proved to be of service to others by the time the market cycle has been completed.
Valuation basics
Look across the room you’re in, and imagine there’s a $100 bill taped in the far upper corner, where the walls and ceiling meet. Imagine you’re handing over some amount of money today, in return for a claim on that $100 bill 12 years from now.
Drop your hand toward the floor. If you pay $13.72 today for that future $100 cash flow, you can expect an 18% annual return on your investment over the next 12 years.
Raise your hand a little higher. If you pay $25.67 today for that future $100 cash flow, you can expect a 12% annual return on your investment over the next 12 years
Raise your hand just above chest-level. If you pay $39.71 today, you can expect an 8% annual return. Move your hand to the top of your head. If you pay $70.14 today, you can expect a 3% annual return. Raise your hand above your head. If you pay $78.85 today, you can expect a 2% annual return.
Now imagine jumping up and touching the ceiling with your hand. If you pay $100 today for that future $100 cash flow, you’ll earn nothing on your investment over the next 12 years.
The chart below shows the relationship between the current price and the embedded future return for our simple 12-year security. Notice that I’ve put the price axis on log scale, which is why the relationship is linear rather than curved.
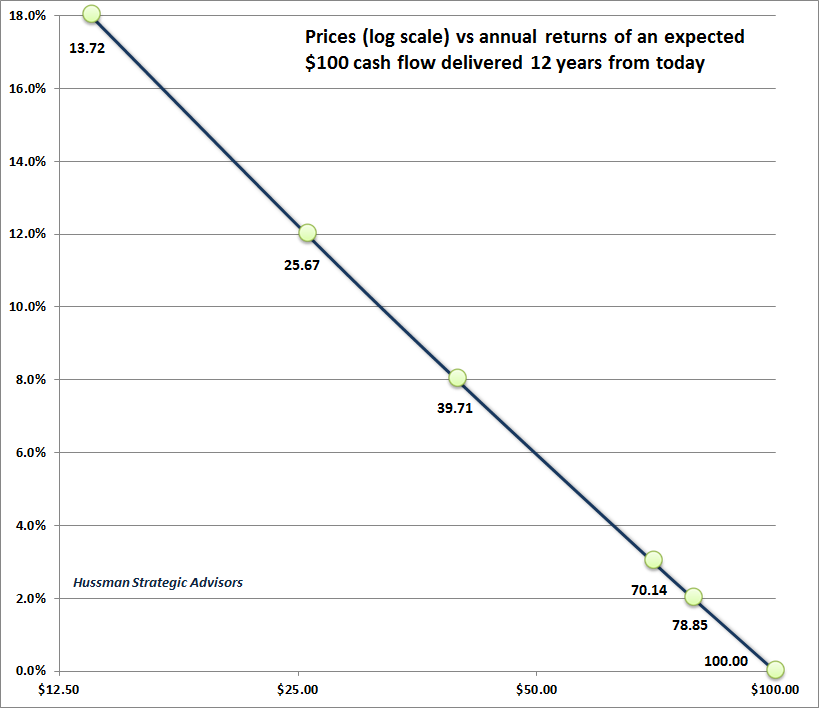
Notice that the impact of a change in interest rates can be quantified. For example, moving from a 3% rate of return to a 2% rate of return for 12 years results in a price change from $70.14 to $78.85, a gain of about 12%. As a general rule of thumb, if we change the interest rate by X% for a period of T years, the impact on the present value of a given cash flow will be roughly X% times T. It’s not an exact rule, but it’s useful.
An additional feature of the relationship above is extremely important. Notice that once we are given the expected future cash flows and the current price, no additional information is required in order to calculate the expected future rate of return. In particular, while the general level of interest rates may be partly responsible for bringing the price to whatever level one observes, once the price is actually established, the expected future investment return can be directly estimated from the level of valuation. No additional “adjustment” for interest rates is needed. Stop and think about this before continuing.
Because present value involves exponents, we’ll generally discover that if we calculate a valuation ratio by dividing the price of the security by some reasonably representative fundamental that’s proportional to the future expected cash flows, there will be a roughly linear relationship between the log valuation ratio and actual subsequent long-term investment returns. Adding information about interest rates will emphatically not improve our estimates of future returns, because the valuation measure will already act as a “sufficient statistic” for those returns. We’ll examine this proposition in actual U.S. market data later in this comment.
Valuations and growth
Let’s imagine a slightly more complicated security. This one pays the holder one payment annually, starting at $10 a year from today. In addition, we’re going to assume that the cash payment grows at a constant rate over the coming 30 years. The chart below shows the present value of that stream of cash flows, depending on the rate of growth, as well as the long-term rate of return that the investor accepts on the investment.
Notice something very important here: if the long-term rate of return is lower, but the growth rate of cash flows is also lower, the “justified” price of the security does not change.
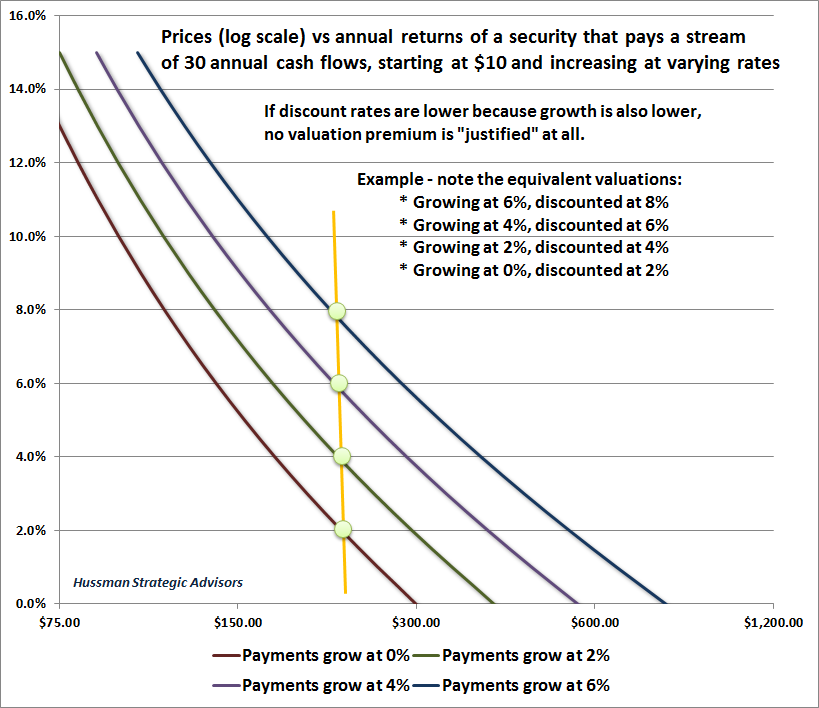
Put simply, if interest rates are low because growth rates are also low, no valuation premium is “justified.” The long-term rate of return on the security will be low anyway without any valuation premium at all. This observation has enormous implications for current U.S. stock market prospects. We’ll demonstrate those implications shortly, across a century of actual market data.
As a side note, we can also quantify the effect of a change in interest rates on the value of the securities above, though the process is slightly more complicated. Even though they’re 30-year securities, changing interest rates by 1% will change the value by much less than 30%, because many of the cash flows come in earlier years. If the interest rate change is permanent for the entire 30-year span, we can estimate the impact of the change using what’s called the “duration” of the security. Duration is essentially an “average” maturity that weights the number of years until each payment is received by the proportion of the total present value that’s paid in each year. If the interest change isn’t permanent, the “justified” impact of the interest rate change on the security price will be smaller than its duration.
Earnings, revenues, and sufficient statistics
In much of my work, I use the phrase “sufficient statistic,” which is a concept drawn from probability theory. A sufficient statistic is basically a number that summarizes all relevant information, so providing additional data doesn’t change one’s expectation.
Consider the very long-term stream of cash flows that a security actually throws off to investors over decades and decades. I’ve regularly observed that while corporate earnings are necessary to generate deliverable cash to shareholders, comparing prices to earnings is actually quite a poor way to estimate future investment returns. The reason is simple. Stocks are not a claim to next year’s earnings, but to a very long-term stream of cash flows that will be delivered into the hands of investors over time. Most of the variation in earnings, particularly at the index level, is uninformative. Corporate earnings are more variable, historically, than stock prices themselves.
So year-to-year earnings are not very useful “sufficient statistics” for that very long-term stream of cash flows. Though “operating” earnings are less volatile, all earnings measures are pro-cyclical; expanding during economic expansions, and retreating during recessions. As a result, to quote the legendary value investor Benjamin Graham, “The purchasers view the good current earnings as equivalent to ‘earning power’ and assume that prosperity is equivalent to safety.”
Not surprisingly, the valuation measures having the strongest correlation with actual subsequent investment returns across history are smoother, and act as more representative “sufficient statistics” for the relevant long-term cash flows. In the valuation of broad equity market indices, and in the estimation of probable future returns from those indices, revenues are actually a better sufficient statistic than year-to-year earnings (whether trailing, forward, or cyclically-adjusted).
Don’t misunderstand – what ultimately drives the value of stocks is the stream of cash that is actually delivered into the hands of investors over time, and that requires earnings. It’s just that profit margins are so variable over the economic cycle, and so mean-reverting over time, that year-to-year earnings, however defined, are flawed measures of the long-term stream of cash flows that determine the value of the stock market at the index level.
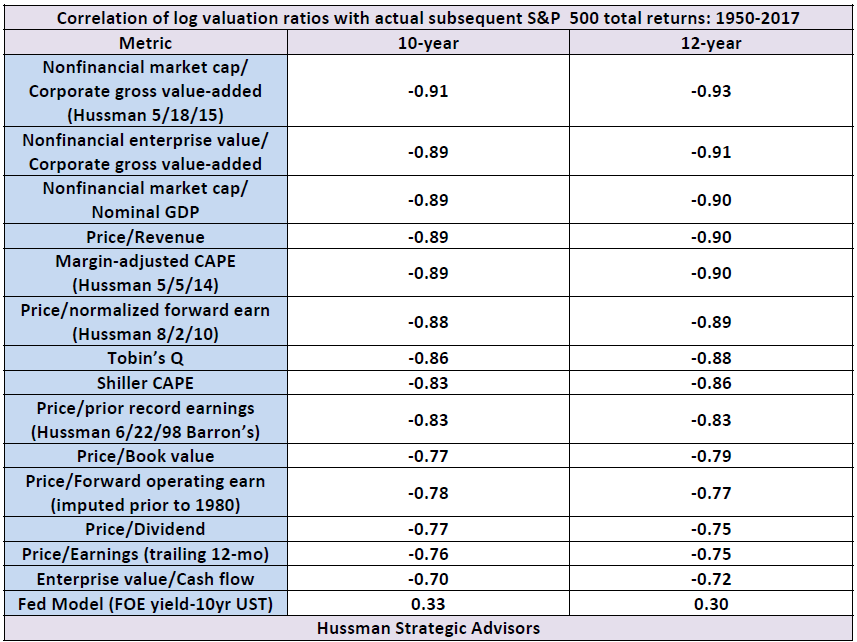
The best way to see that revenues dominate earnings as “sufficient statistics” for valuation is to examine which valuation measures are most strongly correlated with actual subsequent 10-12 year S&P 500 total returns in market cycles across history. Invariably, measures that are based on revenues, or that adjust for variation in profit margins, have a much stronger relationship with actual subsequent market returns than unadjusted earnings-based measures. Our preferred measure is MarketCap/GVA, which I introduced in 2015, and we calculate as the ratio of nonfinancial market capitalization to corporate gross value-added (corporate revenues, excluding the double-counting of intermediate inputs) including estimated foreign revenues. As a reminder, we generally prefer a 12-year horizon because that’s where the “autocorrelation” of valuations reaches zero, meaning that prior overvaluation or undervaluation decays most reliably over that period.
With regard to “sufficient statistics,” remember two things.
• First, revenues and margin-adjusted earnings have historically been far more reliable “sufficient statistics” of future cash flows than year-to-year earnings, or even 10-year averages of earnings.
• Second, provided a valuation ratio is based on a sufficient statistic for future cash flows, the log of that valuation ratio will act as a sufficient statistic for actual subsequent returns. In particular, interest rates may very well affect the level of valuations that we observe, but once a given level of valuation is established, adding information about interest rates will not improve our projections of subsequent market returns.
A note on profit margins
It’s important to recognize that the unusual elevation of profit margins in recent years is largely a temporary artifact of the extraordinary slack in the labor market that emerged in the aftermath of the global financial crisis. Specifically, the elevation of profit margins in recent years has been a nearly precise reflection of declining labor compensation as a share of output prices. To illustrate this below, I’ve shown real unit labor costs (labor compensation per unit of output, divided by price per unit of output) in blue on an inverted left scale, with profit margins in red on the right scale. Real unit labor costs are de-trended, reflecting the fact that real wage growth has historically lagged productivity growth by about 0.4% annually.
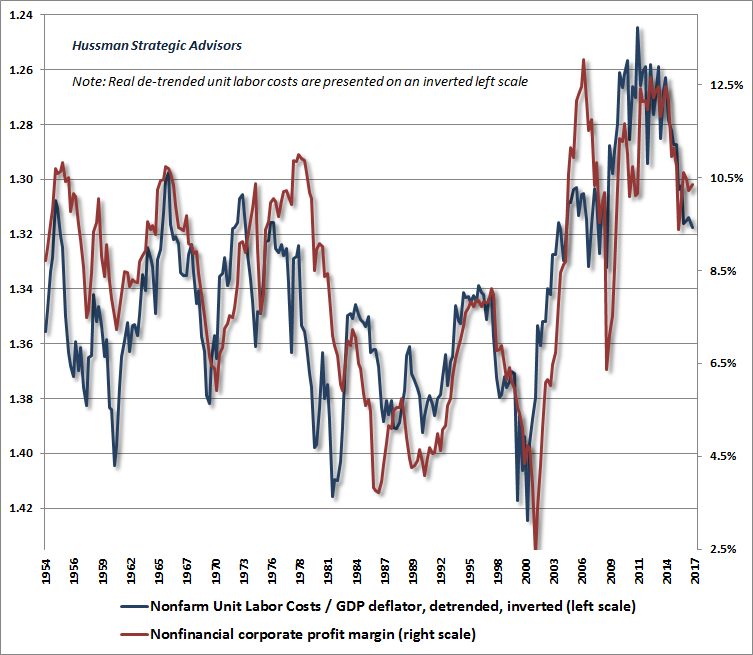
What’s notable here is that the process of profit margin normalization is already underway. Though there will certainly be cyclical fluctuations, this process is likely to continue in an environment where the unemployment rate is now down to 4.2% and demographic constraints are likely to result in labor force growth averaging just 0.2% annually between now and 2024 (see below). Total employment will grow at the same rate only if the unemployment rate remains at current levels. That creates a dilemma for profit margins: if economic growth strengthens in a tightening labor market, labor costs are likely to comprise an increasing share of output value, suppressing profit margins. If economic growth weakens, productivity is likely to slow, raising unit labor costs by contracting the denominator.
Thus far, we’ve established a few propositions. First, provided that the stream of expected future cash flows is held constant, discounting those future cash flows at a lower rate (which is the same as accepting a lower future rate of return), will result in a higher “justified” price today. However, we’ve also observed that if discount rates are low because growth rates are also low, no valuation premium is “justified” at all.
As for “sufficient statistics,” we’ve observed that valuation measures that are relatively insensitive to variations in profit margins are better correlated with actual subsequent market returns than measures that are sensitive to year-to-year fluctuations in earnings (even when one uses operating earnings or smoothed 10-year earnings, as the Shiller CAPE does). It should also be clear from the examples above that as long as we base our valuation measures on “sufficient statistics” for long-term cash flows, we can expect a fairly linear relationship between log valuations and subsequent investment returns.
We have two remaining propositions to demonstrate. The first is that currently depressed interest rates are indeed associated with unusually weak current and prospective growth rates (which implies that low interest rates do not, in fact, “justify” elevated valuation multiples). The second is that margin-adjusted valuations act as sufficient statistics for likely future investment returns, so adding information about interest rates improves neither the reliability of return projections, nor the current level of those projections.
On the prospects for U.S. economic growth
Real U.S. GDP growth is driven by two engines: the growth rate of the labor force, plus the growth rate of output per worker (productivity). On the labor side, based on population growth and other demographic factors, the U.S Bureau of Labor Statistics (BLS) projects that the U.S. labor force – the number of people working or looking for work – will reach 163.8 million in 2024. As of September 2017, the U.S. labor force stood at 161.1 million. Accordingly, the growth rate of the U.S. labor force is projected to average just 0.2% annually over the coming 7 years.
To illustrate what’s going on, the charts below present a long-term perspective of U.S economic and demographic conditions (data: Federal Reserve Economic Database). The first chart below shows the 10-year growth rates of the U.S. working age population, the civilian labor force, and civilian employment since the 1960’s. It’s clear from this chart that the central tendency of the “labor force” contribution to U.S. GDP growth has been steadily declining, having peaked in the 1970s and early 1980s.
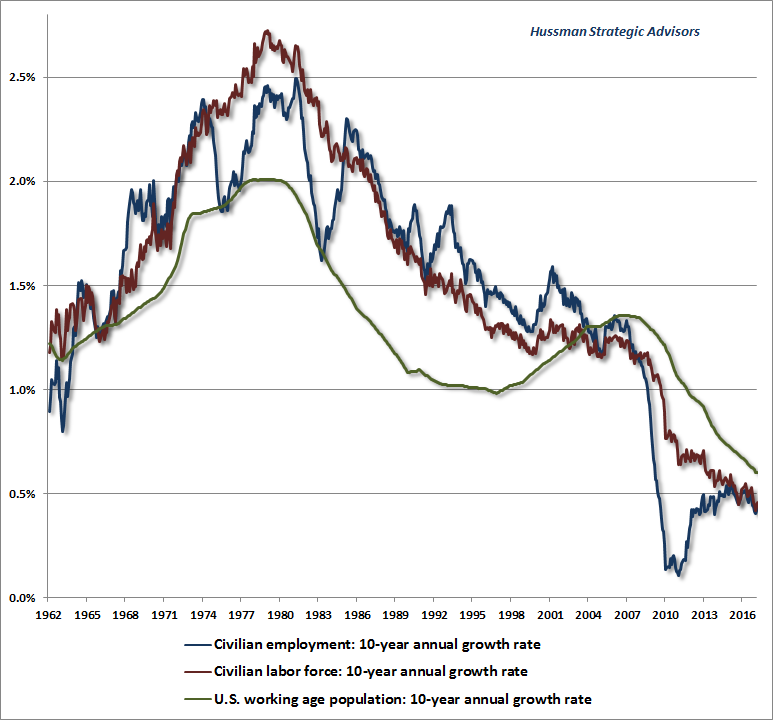
It’s also worth noting that periods of rapid and sustained economic growth invariably begin from points of steep unemployment, because that’s the point from which the economy can enjoy a great deal of growth in the “labor force” contribution to growth. We hear a lot of hope that corporate tax cuts will prompt the kind of growth the U.S. enjoyed following the tax reforms of the 1950’s and the 1980’s. What’s often lost in this conversation is that the principal engines of economic expansion were already loaded with fuel at those points, mainly in the form of rapid underlying labor force growth and slack labor market capacity. That is not at all true today.
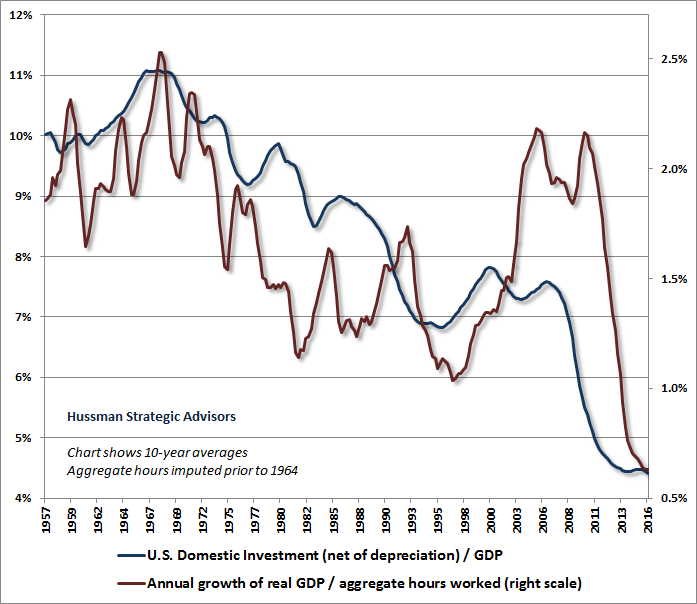
On the productivity front, over the past decade, productivity growth has declined from a post-war average of 2% to a growth rate of just 1.2% annually, with growth of just 0.6% annually over the past 5 years. The gap between dismal productivity and the most productive economic environment in U.S. history is only about 2.5% annually.
Over the long-term, the growth of U.S. productivity is largely driven by the growth of U.S. domestic investment, particularly net of depreciation. As technology increases the speed of obsolescence, depreciation rates have progressively increased in recent decades, so a given amount of gross domestic investment does progressively less to expand the U.S. capital stock. The chart below shows the 10-year averages of U.S. domestic investment (net of depreciation) as a share of GDP, along with the growth rate of real output per labor hour.
It’s worth noting that rapid growth in U.S. domestic investment is also typically associated with rapid deterioration in the U.S. trade deficit (an implication of the savings-investment identity, as explained below). For that reason, we observe a very strong regularity across history: the quickest way to “improve” the U.S. trade balance is to torpedo gross domestic investment, and the quickest way to “worsen” the U.S. trade balance is to enjoy a boom in gross domestic investment. The chart below illustrates this regularity in post-war data.
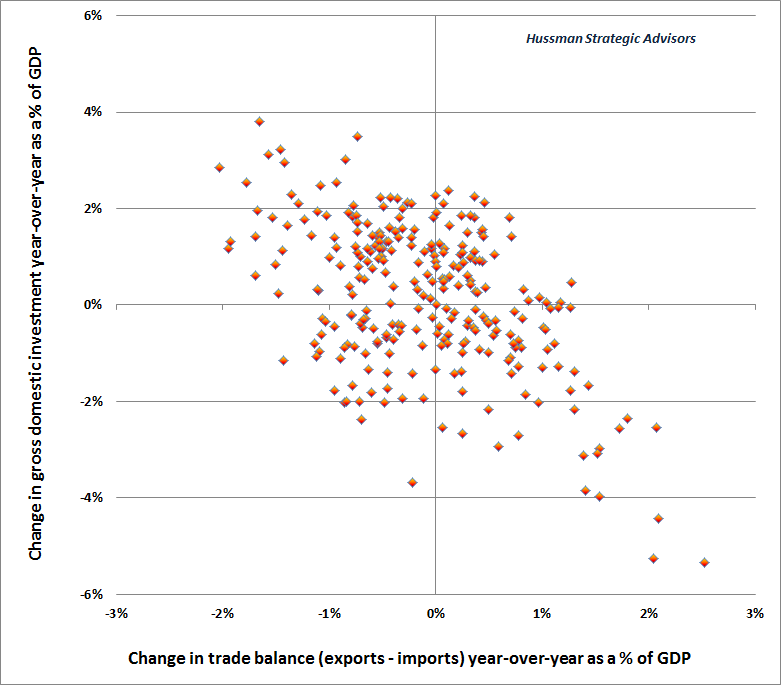
From a cyclical perspective, the problem is that once the trade balance is already at a significant deficit, there is little remaining slack for rapid expansion in either gross domestic investment or, by extension, U.S. productivity growth.
Periods of rapid economic growth typically emerge from points of high unemployment – not when unemployment is already quite low. Likewise, periods of rapid economic growth typically emerge from points where the trade balance (exports – imports) is elevated as a share of GDP – not when it is already at a steep deficit.
Presently, the Federal Reserve estimates the central tendency of long-run real GDP growth to average just 1.85% annually. Understand that even a 1.85% average economic growth rate in the coming years already builds in some optimistic assumptions. See, even if U.S labor force growth grows at the projected rate of 0.2% annually, this growth will transfer to a similar rate of employment growth only if the unemployment rate remains constant at the current 4.2% level. Meanwhile, with labor productivity growing at only about 0.6% annually, well below the post-war average of 2%, the baseline expectation for U.S. GDP growth, given no change in the present trajectory, is actually just 0.2% + 0.6% = 0.8%. So a 1.85% growth trajectory for real GDP assumes that some combination of labor force growth and productivity growth will accelerate from the current baseline.
The upshot is this. Over the coming 7-10 years, the central tendency of U.S. GDP growth is likely to average less than 2%, a result that is largely baked-in-the-cake because of the underlying drivers already in place. On a cyclical horizon focused on the coming 4-year period, the diminished slack in core economic drivers is consistent with a material slowing of economic growth relative to its average in recent years. Given that real U.S. GDP growth has averaged just 2% annually over the past 5 years, and that the current starting positions of labor force growth, unemployment, and the trade balance suggest a deceleration even from that average, we shouldn’t be surprised if real U.S. GDP growth amounts to just a fraction of a percent annually over the coming 4-year period.
The chart below shows the 7-year average growth rate of real GDP, excluding the impact of fluctuations in the unemployment rate. I’ve chosen a 7-year lookback, specifically to exclude the impact of the global financial crisis from the latest data point. At a 4.2% unemployment rate, future economic growth is unlikely to benefit from a substantial further retreat in unemployment. Without that contribution, it should be clear that the underlying drivers of U.S. economic growth, even during the recent economic recovery, have never been weaker.
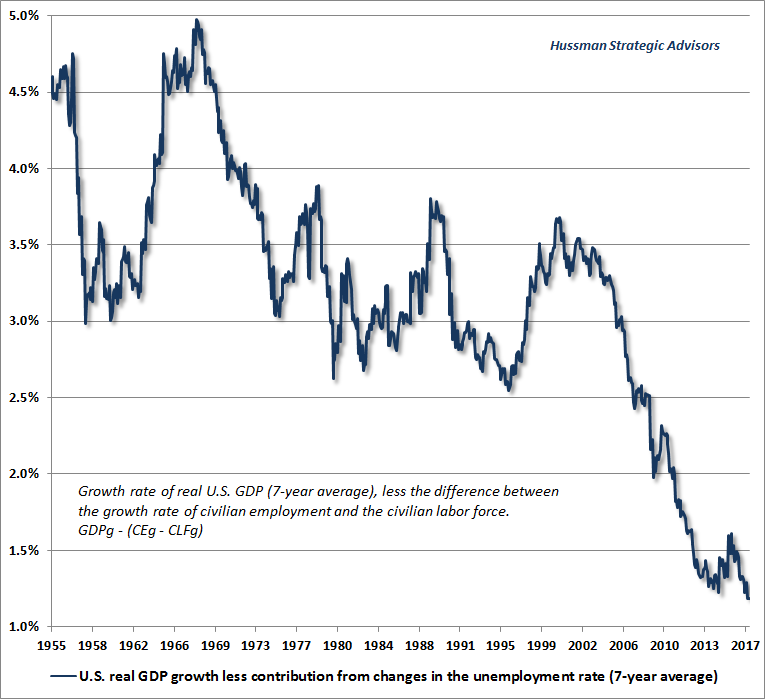
Notably, the growth rates of S&P 500 earnings and revenues have also slowed considerably in recent years, at a pace commensurate with economic growth itself. Indeed, in recent decades, these growth rates have plunged to less than half their historical rate. Given these facts, it’s worth repeating the following: If interest rates are low because growth rates are also low, no valuation premium on stocks is “justified” by the low interest rates. Prospective returns are reduced anyway, without the need for any valuation premium at all.
Valuations, sufficient statistics and interest rates
Our final proposition left to demonstrate is that (log) margin-adjusted valuations are sufficient statistics for likely future investment returns, and that adding information about interest rates improves neither the reliability of the associated return projections, nor the current level of those projections.
For decades, I’ve observed that the reliability of every earnings-based valuation ratio, as measured by its correlation with actual subsequent returns, is substantially improved if one adjusts that ratio for variation in its embedded profit margin. It’s easy to prove this to yourself.
1: Obtain data on your preferred price/earnings measure over several market cycles, and calculate the embedded profit margin (the denominator of your preferred P/E, divided by S&P 500 revenues). If you can’t get that margin data, you can proxy it with U.S. corporate profits divided by U.S. corporate gross value-added (or even divided by U.S. GDP if needed). Calculate the margin the same way you calculate the denominator of your P/E, so if you’re using 10-year average earnings, do the same with the margin data. Just for fun, get data on the long-term Treasury bond yield as well.
2: Now use ordinary least-squares or any other approach to obtain three estimators of actual subsequent S&P 500 10-12 year returns: one using the log valuation measure alone (I prefer the natural logarithm ln for reasons I can detail another time), one using the log valuation measure and the log profit margin, and one using the log valuation measure, the log profit margin, and the level of interest rates.
Here’s what you’ll discover. When you include information on the log profit margin, your estimator will suck it up like a sponge, dramatically increasing the accuracy of your fit, and most likely giving the log margin a very similar (negative) coefficient as your log valuation measure alone. Once you’ve included both the valuation and margin information, adding information on interest rates will do virtually nothing further for the accuracy of your fit.
The reason for this result is that even though you think you care about earnings, history actually cares about revenues, which serve as far better “sufficient statistics” of the very, very long-term cash flows provided by stocks. Observe that price/revenue = price/earnings x earnings/revenue. Taking the log of both sides, you’ll get log(price/revenue) = log(price/earnings) + log(embedded margin). Your predictor will celebrate the inclusion of that margin information, and give it nearly the same coefficient as the log(P/E), because what it actually wants is the log price/revenue ratio. You may not like that result at all, but that’s what you’ll find.
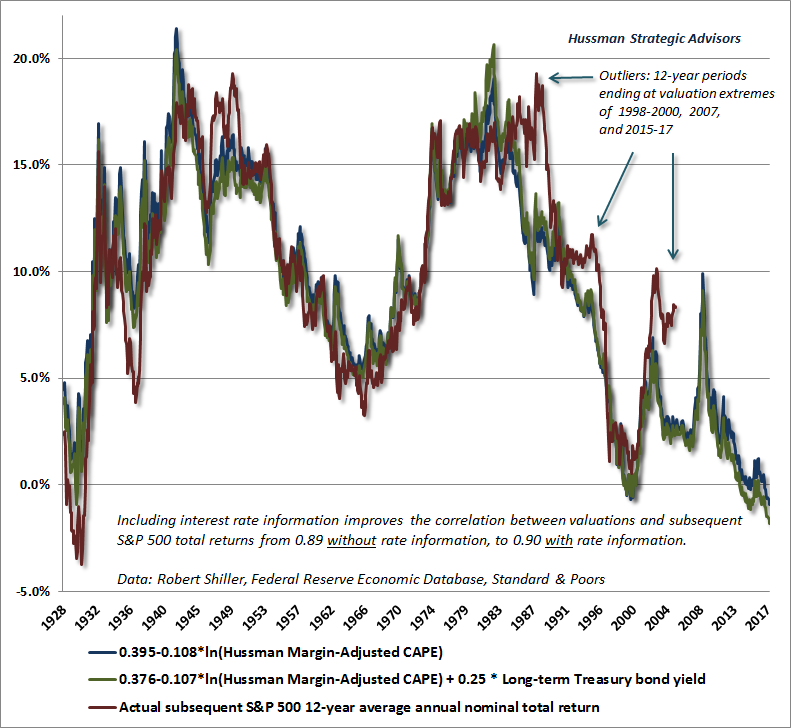
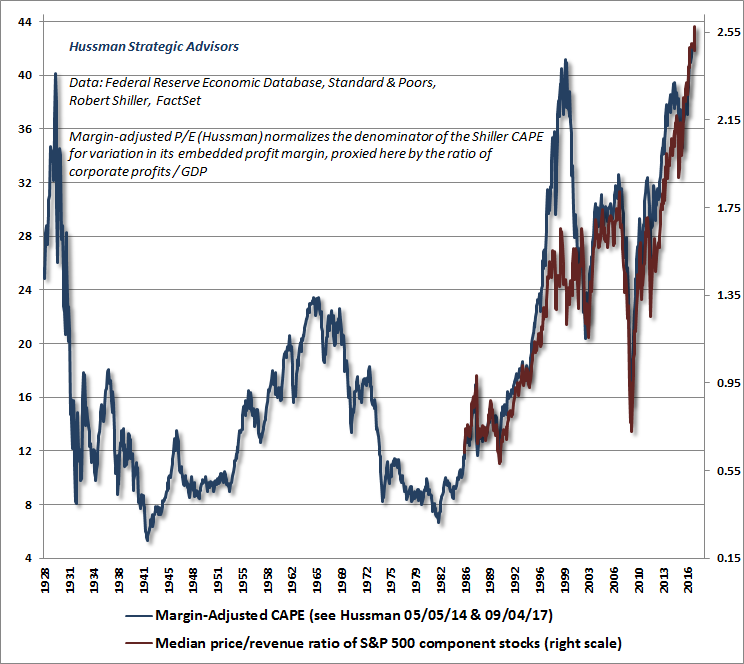
The chart below is based on my margin-adjusted variant of Robert Shiller’s cyclically-adjusted PE (CAPE). Specifically, the CAPE (calculated here as the ratio of the S&P 500 to the 10-year smoothing of inflation-adjusted earnings) is multiplied at each point in time by a factor equal to the 10-year smoothing of corporate after-tax profits to GDP, divided by the historical norm of 5.4%. The resulting measure is similar to the S&P 500 price/revenue multiple, the ratio of market capitalization to corporate gross value-added, and other measures that share a correlation near 90% or higher with actual subsequent 10-12 year S&P 500 total returns in market cycles across history.
As expected, the (log) margin-adjusted CAPE acts as a “sufficient statistic” for actual subsequent S&P 500 total returns, particularly on horizons of 10-12 years (which is the point where deviations from historically normal valuations most reliably damp out). Also as expected, adding additional information about interest rates (green) does virtually nothing to improve the reliability of the resulting projections; a result that can be understood from our earlier valuation examples. If anything, low interest rates actually worsen expected future market returns here. If extreme valuations were not enough, depressed interest rates suggest the likelihood of below-average economic growth as well.
A century of reliable valuation evidence indicates that the S&P 500 is likely to experience an outright loss, including dividends, over the coming 10-12 year horizon, and we presently estimate likely interim losses on the order of -60% or more. A rate of return of even 1% in cash is a much more desirable option than investors may imagine. Moreover, I have little doubt that we’ll observe a spike in prospective returns over the completion of the current cycle, as we’ve observed in every market cycle across history. These spikes are associated with material retreats in valuation. Historically, the best opportunities to embrace market exposure tend to emerge when material retreats in valuation are coupled with early improvements in market action.
It’s worth emphasizing again that while the general level of interest rates may be partly responsible for bringing the price to whatever level one observes, once the price is actually established, the expected long-term return can be directly estimated from the level of valuation. No additional “adjustment” for interest rates is needed. It’s fine to estimate the expected return from the level of valuation and then compare it to the level interest rates to decide whether it’s reasonable to take the risk. But it’s important to realize that once the price is established, the valuation level alone is sufficient to make that estimate. Investors may not like this fact, but it’s a basic implication of security pricing, properly understood.
The chart below shows this relationship in three dimensions. While it’s true that lower interest rates have generally been associated with higher market valuations (particularly during the inflation-deflation cycle from 1970 until the late-1990’s), those low interest rates did absolutely nothing to mitigate the dismal market returns that actually followed extreme market valuations. Interest rates can certainly contribute to the emergence of rich valuations. But once those valuations are set, so are the prospects for subsequent market returns.
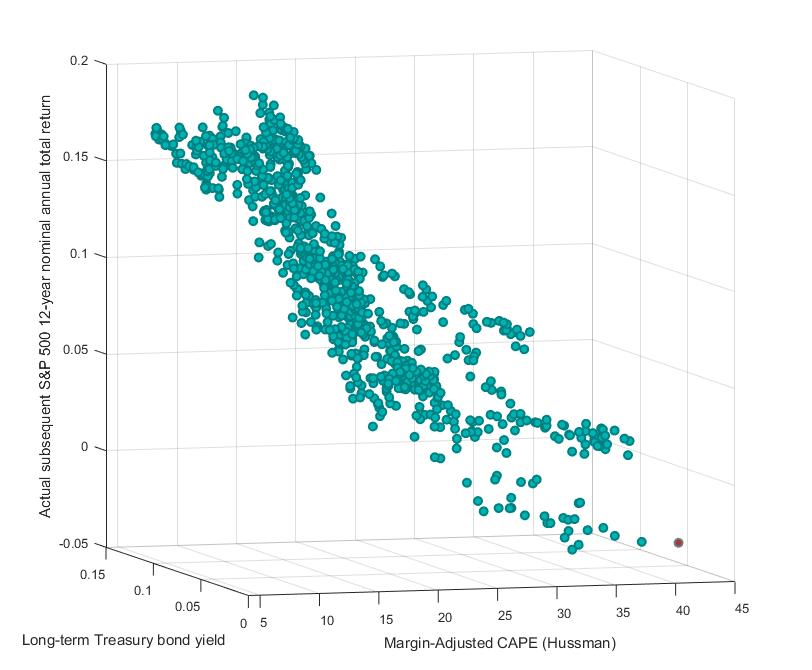
It’s tempting to imagine that if interest rates remain low even 10-12 years from now, everything will work out somehow. Unfortunately, the fact is that interest rates at the end of any 10-12 year period are strongly correlated with the economic growth rate over that period itself. So whatever gains are not taken away by reversion of valuations would instead be taken away by weak interim growth.
In summary, current market valuations are consistent with negative expected returns for the S&P 500 over the coming 10-12 years, with a likely market loss of more than -60% in the interim. The proposition that “lower interest rates justify higher valuations” has become a rather dangerous slogan, and is a distressingly incomplete statement that ignores the other half of the sentence: “provided that the stream of expected cash flows is held constant.” Our refusal to accept the incomplete statement as a given is in no way a rejection of basic finance. To the contrary, it’s a reminder that investors need to quantify the effect of interest rates, to consider the fundamental drivers of growth, and to carefully examine the relationship between their preferred valuation measures and actual subsequent market returns.
What investors apparently want to believe is that low interest rates “justify” rich valuations, yet at the same time, those “justified” valuations will be associated with future returns similar to those that have historically been associated with valuation norms less than half of present levels. This mindset is wholly disconnected from any actual principle of finance. A full understanding of the extreme risks inherent in the current financial precipice calls on investors to recognize the following:
• An investment security is nothing but a claim on some stream of expected future cash flows that will be delivered into the hands of investors over time.
• Provided that the stream of expected future cash flows is held constant, discounting those future cash flows at a lower rate (which is the same as accepting a lower future rate of return), will result in a higher “justified” price today, and this impact can be quantified.
• If interest rates are low because growth rates are also low, no valuation premium on stocks is “justified” by the low interest rates. Prospective returns are reduced without the need for any valuation premium at all.
• Provided that a valuation ratio is based on a “sufficient statistic” for long-term cash flows, the logarithm of that valuation ratio will, in turn, act as a sufficient statistic for long-term investment returns.
• Revenues and margin-adjusted earnings have historically been far more reliable “sufficient statistics” of future cash flows than year-to-year earnings, or even 10-year averages of earnings.
• Currently depressed interest rates are indeed associated with unusually weak current and prospective U.S. growth rates, implying that elevated stock market valuations are not, in fact, “justified” by interest rates at all.
Valuation update
The following charts will provide a sense of where the U.S. equity market currently stands. The first chart shows our margin-adjusted CAPE, which as noted above has a correlation of about -0.89 with actual subsequent market returns across U.S. market cycles since the 1920’s.
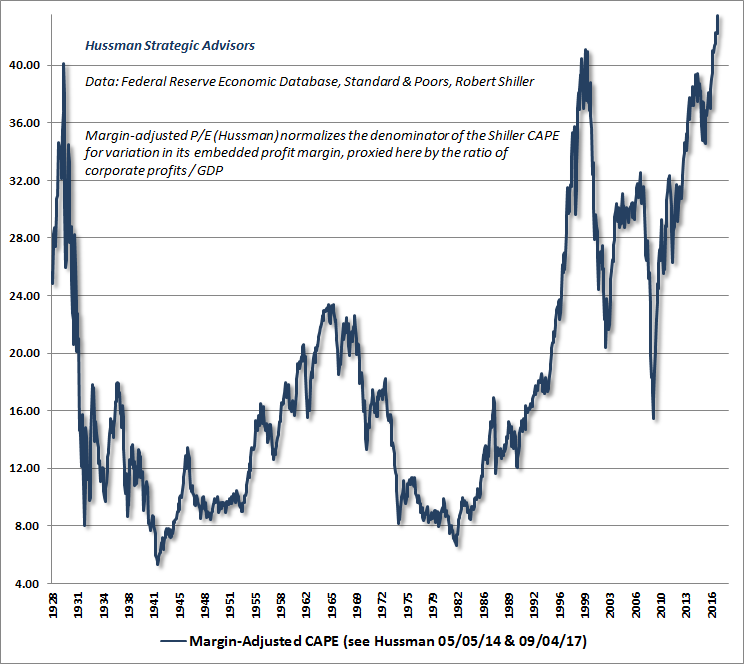
Based on the consensus of the most historically-reliable market valuation measures we identify, the U.S. equity market is now at the most offensive level of overvaluation in history, exceeding even the levels observed in 1929 and 2000. Because investors appear to have a speculative bit in their teeth, our very near-term outlook is rather neutral, allowing for both further speculation and abrupt market losses. Again, as I noted a few weeks ago, I view hedges and safety nets as essential here, but there’s no need to “fight” a continued advance, if it emerges, with even larger hedges or higher safety nets. With the S&P 500 likely to lose more than -60% by the completion of the current market cycle, it will be fine if the initial few percent lower do nothing for us.
Don’t confuse the extreme nature of our market loss projections with a requirement that they must be immediate. My expectation is that the initial market losses will be strikingly abrupt, in the sense that the first whack will emerge seemingly out of the blue. I also expect that the initial decline will immediately wipe out any residual gains the market may enjoy from current levels. Still, given the speculative bit that investors seem to have in their teeth here, an element of our patience here involves the willingness to tolerate any residual advance without raising safety nets further.
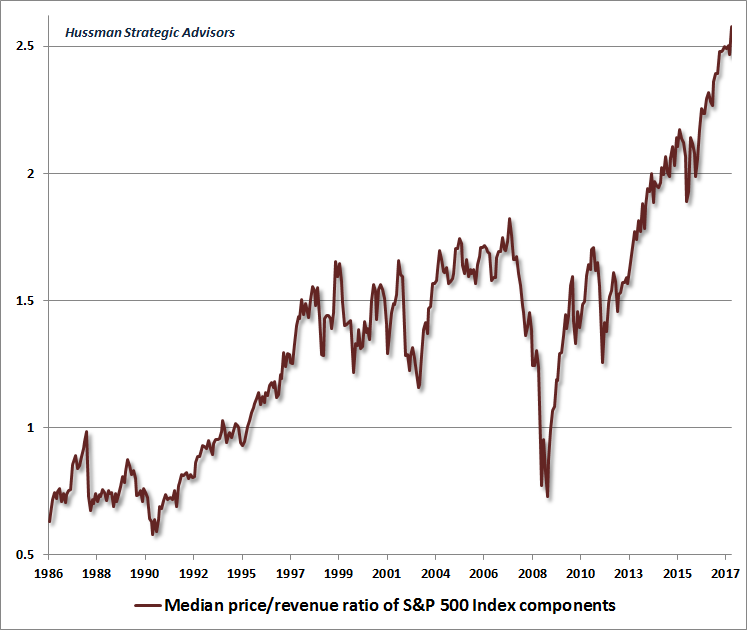
The chart below shows the median price/revenue ratio across all S&P 500 components (thanks to Russell Jackson, our resident math guru, for compiling this in data from FactSet and Standard & Poors). What’s notable here is that unlike the 2000 peak, when overvaluation was concentrated in the top two deciles of stocks (primarily representing large-cap tech stocks at the time), the current valuation extreme is uniform across every decile. Based on the historical relationship between the valuations of various deciles and their subsequent losses over the completion of prior market cycles, I expect nearly every decile of stocks to experience losses in the 50-70% range as this cycle completes, much like the losses that I projected at the 2000 and 2007 peaks (recall that the tech-heavy Nasdaq 100 lost -83% in the 2000-2002 rout), but with the losses extending to a much broader set of stocks in this instance.
To offer a longer historical perspective, and further insight into the difference between the 2000 peak and the present extreme, the chart below overlays the median price/revenue ratio along with the margin-adjusted CAPE. Notice that the extreme valuation of the S&P 500 Index in 2000 was not associated with anything close to the broad overvaluation among S&P 500 components that we currently observe. Indeed, at the 2000 peak, nearly half of all U.S. stocks were at valuations that we viewed as reasonable. This is certainly not the case at present.
With valuations at the most offensive extremes in history, careful investment analysis has been replaced with investing-by-slogan. The problem is that stocks still represent a claim on future cash flows, and over time, reality shows up as those cash flows are delivered. By the completion of the current cycle, I expect that the total return of the S&P 500 will have lagged Treasury bills all the way back to about October 1997, just as by the end of the 2007-2009 decline, the index had lagged Treasury bills all the way back to June 1995.
One of the challenges with securities, banks, and other objects of finance is that while they actually rest on a very long-term stream of future expected cash flows, investors focus mainly on returns, rather than the quality of those underlying factors. That feature allows enormous departures between what investors think is true and the underlying reality that will unfold over time. Those departures can exist and deteriorate for years before they inevitably become common knowledge. It’s exactly the feature that Ponzi schemes rely on, whether those schemes are sold by crooks or central bankers (and it’s sometimes hard to know the difference).
For a while, Bernie Madoff’s investors felt great about their impressive “returns.” For a while, investors in dot-com stocks felt the same. For a while, investors in mortgage bonds felt the same. But when investors focus on returns rather than the very long-term structure, stability, and even existence of the underlying cash flows, terrible things can happen. All that’s required to get the snowball rolling is the creeping recognition that there’s no “there” there.
In response to the delusion that low interest rates “justify” virtually any level of market valuation, regardless of the growth rate of the underlying cash flows, the speculation of recent years has created a situation where there is effectively no way out for investors in aggregate. Every security that is issued must be held by someone until it is retired. When one investor sells a share, it simply means that another investor buys it. The only question is who will hold the bag.
Market conditions are impermanent, and all of this will change over time. As has been the case in every market cycle, the strongest estimated market return/risk profiles we identify emerge when a material retreat in valuations is joined by an early improvement in market action. I have no doubt that we’ll observe similar opportunities over the completion of the current market cycle.
Keep Me Informed
Please enter your email address to be notified of new content, including market commentary and special updates.
Thank you for your interest in the Hussman Funds.
100% Spam-free. No list sharing. No solicitations. Opt-out anytime with one click.
By submitting this form, you consent to receive news and commentary, at no cost, from Hussman Strategic Advisors, News & Commentary, Cincinnati OH, 45246. https://www.hussmanfunds.com. You can revoke your consent to receive emails at any time by clicking the unsubscribe link at the bottom of every email. Emails are serviced by Constant Contact.
The foregoing comments represent the general investment analysis and economic views of the Advisor, and are provided solely for the purpose of information, instruction and discourse.
Prospectuses for the Hussman Strategic Growth Fund, the Hussman Strategic Total Return Fund, the Hussman Strategic International Fund, and the Hussman Strategic Dividend Value Fund, as well as Fund reports and other information, are available by clicking “The Funds” menu button from any page of this website.
Estimates of prospective return and risk for equities, bonds, and other financial markets are forward-looking statements based the analysis and reasonable beliefs of Hussman Strategic Advisors. They are not a guarantee of future performance, and are not indicative of the prospective returns of any of the Hussman Funds. Actual returns may differ substantially from the estimates provided. Estimates of prospective long-term returns for the S&P 500 reflect our standard valuation methodology, focusing on the relationship between current market prices and earnings, dividends and other fundamentals, adjusted for variability over the economic cycle.