

Survival Tactics for a Hypervalued Market


John P. Hussman, Ph.D.
President, Hussman Investment Trust
January 2018
It is not to be forgotten that what we call rational grounds for our beliefs are often extremely irrational attempts to justify our instincts.
– Thomas Huxley
As we begin 2018, the most appropriate starting point is to clarify our actual investment stance. A central aspect of our outlook is the distinction between investment and speculation. If Wall Street believes that stock prices could advance further because investors temporarily have a speculative bit in their teeth, and that they care more that the environment “feels good” than about any careful evaluation of long-term investment prospects, we have no strenuous objection to that argument. Indeed, that’s exactly why, until we see more than the early deterioration in market internals we observe at present, our immediate investment outlook is rather neutral. On the other hand, if Wall Street believes that current valuations are actually “justified,” that 10-12 year S&P 500 total returns are likely to be meaningfully positive, or that the S&P 500 will avoid a collapse on the order of -65% over the completion of the current market cycle, my view is that these beliefs are strenuously at odds with the evidence from a century of market history.
The essential survival tactic for a hypervalued market, and its resolution ahead, is to recognize that market valuations can experience breathtaking departures from historical norms for extended segments of the market cycle, so long as shorter-term conditions contribute to speculative psychology rather than risk-averse psychology. One must distinguish between a boulder resting safely at a permanently high plateau, and a boulder teetering at the edge of a cliff, thanks to temporary and unreliable support. Refrain from imagining that extreme valuations are equivalent to “justified” or “durable” valuations. A century of evidence suggests that something very different is going on.
Specifically, while the most historically-reliable market valuation measures are now more than 2.8 times their historical norms, history has produced many instances (1929, 2000 and the present being the three most offensive) where stocks reached objectively extreme valuations on reliable measures, but prices continued to advance for a portion of the complete market cycle. The “hinge” that distinguishes an overvalued market that continues to advance from an overvalued market that drops like a rock is purely psychological – it’s the preference of investors toward speculation or risk-aversion, typically encouraged by short-term, cyclical factors that lead investors to feel optimistic or fearful. Based on a century of market evidence, we’ve found that the most reliable and observable measure of those psychological preferences is the uniformity or divergence of market internals across a broad range of individual stocks, industries, sectors, and security-types, including debt securities of varying creditworthiness. That uniformity is important, because when investors are inclined toward speculation, they tend to be indiscriminate about it.
The summary of our present outlook is this: we view market valuations as obscene, with negative expected S&P 500 total returns over the coming 10-12 year period, and a probable interim loss on the order of -65% over the completion of the current market cycle. Still, in the absence of further deterioration and dispersion in market internals, our immediate market outlook is actually rather neutral. Remember also that a material retreat in valuations, coupled with an early improvement in market internals, is likely to produce favorable investment opportunities far sooner than 10-12 years from now.
Presently, a further deterioration in market internals, particularly evidenced by widening credit spreads or expanding breakdowns among individual stocks, would signal a shift in investor preferences from speculation toward risk-aversion. We’ll take that evidence as it emerges. I do believe that out-of-the-money tail-risk hedges may be useful, given the low level of option volatility (as measured by the VIX), but a negative market outlook should wait on further internal deterioration. Establishing tail-risk hedges may be useful because, as investors discovered after the 1929, 1973, 1987, 2000 and 2007 peaks, once internals deteriorate materially, the exit doors can prove to be impossibly narrow, at a point where the distance between prices and historically reasonable valuations remains very wide.
Put simply, valuation is the essential driver of investment returns over a 10-12 year horizon, and of the potential market loss over the completion of any given cycle. However, market returns over shorter segments of the cycle (as well as deviations from value-based expectations) are mainly driven by cyclical fluctuations in investor psychology. Even the most extreme overvaluation has little effect on market direction in periods when investors feel optimistic. Likewise, even deep undervaluation may provide little support in periods when investors are fearful. The key during these times is to refrain from attempts to “justify” the level of prices just because the market is trading at one extreme or another, and to carefully monitor the uniformity or dispersion of market internals, in order to gauge that psychology in an observable way.
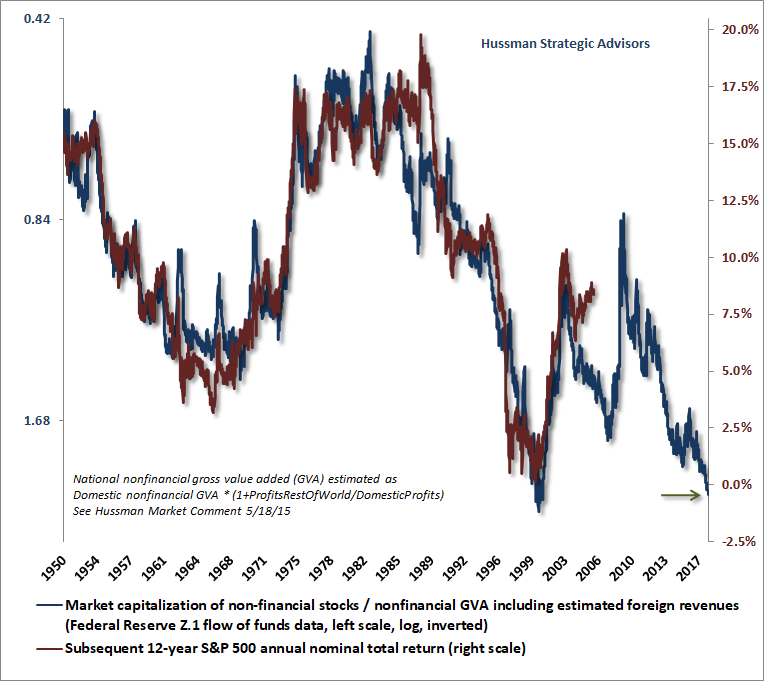
The next few charts demonstrate these principles. First, the chart below shows our preferred valuation measure, which I introduced several years ago (nonfinancial market capitalization to corporate gross value-added, including estimated foreign revenues). MarketCap/GVA is shown on an inverted log scale in blue. The red line shows S&P 500 average nominal total returns over the subsequent 12-year period.
We can extend the history of this chart at a slight cost to reliability using the Margin-Adjusted CAPE, my margin-adjusted variant of Robert Shiller’s cyclically-adjusted P/E, which substantially improves on Shiller’s raw version by accounting for variations in the embedded profit margin. On this measure, market valuations are the most extreme in history. Again, our Margin-Adjusted CAPE is shown on an inverted log scale in blue, along with actual subsequent 12-year S&P 500 total returns.
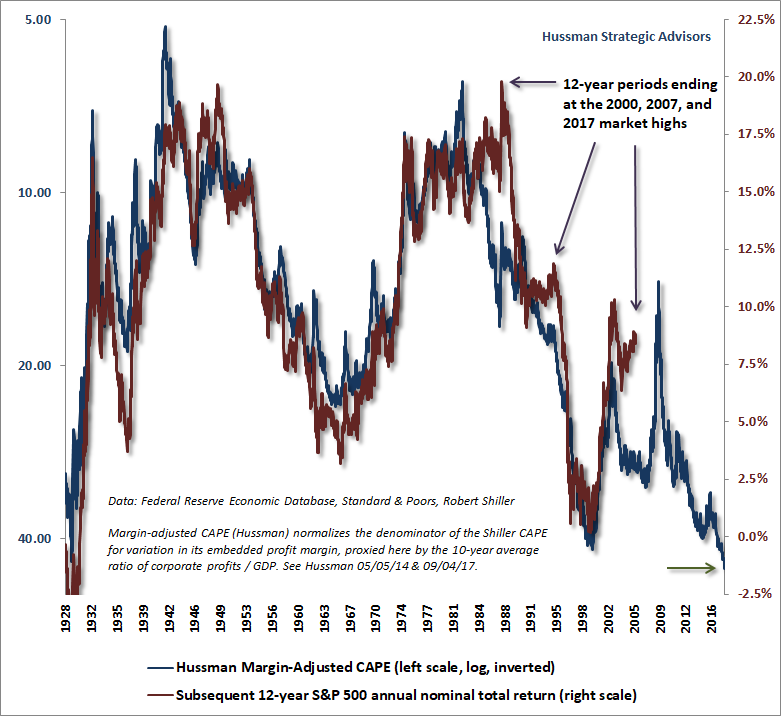
It should be clear that valuations are the primary determinant of whether subsequent market returns are likely to be satisfactory or unsatisfactory, but notice that there are also several “errors” in these charts; points where actual 12-year market returns either exceeded or fell short of the returns that one would have projected 12-years earlier. These “errors” aren’t random. When we look at periods when the most recent 12-year S&P 500 total return has been substantially higher than what one would have expected 12-years earlier, it’s always because the end point represented a temporary speculative extreme, like 2000, 2007, and today. Likewise, 12-year S&P 500 total returns ending at the 1949, 1974, and 1982 secular valuation lows clearly undershot the return that one would have expected 12-years earlier. As a side-note, we prefer the 12-year horizon because that’s the point where the “autocorrelation” profile of valuations generally reaches zero.
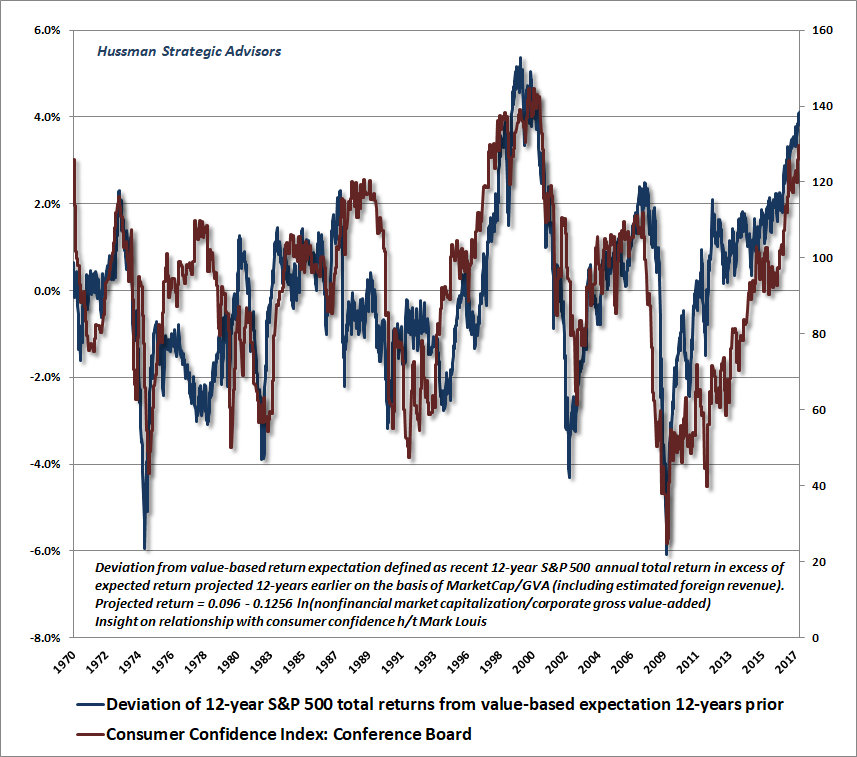
A few weeks ago, Mark Louis, a macro investor, suggested a useful way to illustrate what’s going on with those errors. The blue line in the chart below shows the deviation of 12-year S&P 500 total returns from what one would have projected 12-years earlier, based on MarketCap/GVA. The line runs to the present because we know both the most recent 12-year return, and the return that would have been projected 12-years ago. The red line shows the Consumer Confidence Index reported by the Conference Board. What’s clear from this chart is that the main reason that market returns periodically deviate from value-based expectations is that investors temporarily feel good, or that they temporary feel pessimistic. These departures from value-based expectations reflect shorter-term cyclical factors that create comfort or discomfort among investors. Just like 2000 and 2007, the current departure from valuation norms has much less to do with any durable “justification” for rich valuations as it does with the fact that, for the moment, investors generally “feel good.”
Refrain from imagining that extreme valuations are equivalent to ‘justified’ or ‘durable’ valuations. A century of evidence suggests that something very different is going on.
A quick reminder of why we experienced difficulty during the half-cycle since 2009, and how we’ve adapted. In prior market cycles across history, the emergence of extreme “overvalued, overbought, overbullish” syndromes often provided advance warning of air-pockets, panics and crashes. In the advancing half-cycle since 2009, zero-interest rate policy and post-election enthusiasm encouraged speculation well after these syndromes emerged. The necessary adaptation was to explicitly prioritize market internals above those “overvalued, overbought, overbullish” syndromes, and to do so without any exceptions. The fact that we made that adaptation incrementally certainly eroded my credibility in this half-cycle, despite admirably navigating previous complete market cycles. We now make no exceptions: regardless of any other feature of valuations or market action, if our measures of market internals are favorable, we will not establish a hard-negative market outlook. That single adaptation would have dramatically improved our experience in the recent half cycle.
The recent advancing half-cycle has generated the incorrect impression that we adhere to a perma-bearish outlook as a matter of disposition. As this market cycle is completed, our departure from that expectation may come as a surprise, but it shouldn’t. The fact is that I expect our market outlook to be constructive or aggressive far more often than not over the course of time. Such an outlook emphatically does not require valuations to retreat to historical norms. If you understand that, you’ll also understand why nearly all of my financial assets remain committed to our own value-conscious, historically-informed, full-cycle investment discipline.
The strongest investment opportunities typically emerge when a material retreat in valuations is joined by an early improvement in market internals. In the interim, understand that the most reliable valuation measures we identify are indeed over 2.8 times historical norms that they’ve regularly approached or breached by the completion of every market cycle in history, apart from the 2002 low. That includes market cycles associated with low interest rates. After navigating the 2000-2002 and 2007-2009 collapses (with a constructive stretch in between), Money magazine named me as the best advisor for a bear market. One can never make assurances about the future, but I hope to merit that characterization over the completion of this cycle as well.
Avoid the temptation to “justify” current extremes
Like the 1929 and 2000 market peaks, Wall Street is pushing a great deal of loose analysis intended to “justify” current valuations, imagining that just because prices have reached a certain level, they must actually belong there. Arguments like “valuations are justified given the level of interest rates,” or “given the recent tax cuts,” or “given a growing economy with low inflation” sound reasonable enough, but as we’ve detailed at length in recent months, they don’t hold up to the scrutiny of careful discounted cash flow analysis.
Specifically, if interest rates are depressed because long-term growth rates are also depressed (which we’ll detail again below), no valuation premium is “justified” at all. Even without a valuation premium, prospective equity market returns would already be commensurately depressed and aligned with lower interest rates, as a result of the lower growth rate. This can be demonstrated using any discounted cash flow approach.
Suppose, for example, that a stock is expected to deliver a dividend D next year, future dividends grow at rate g into the infinite future, and those future cash flows are discounted to present value at rate r. Given these assumptions, the present value of the discounted cash flows will be V = D/(r-g). Moreover, assuming that the stock is purchased at a price equal to V and the expected cash flows are actually delivered, one can show that the long-term rate of return on the investment will be r.
Now, reduce r and g by the same amount. What happens to the fair value V? Nothing. What happens to the fair multiple of price to dividends? Nothing. Put simply, if the discount rate is lower because growth is also lower, no valuation premium is justified at all. Now imagine that an investor pays a price that’s 2.8 times V anyway. Will the long-term rate of return on the investment still be r? Not a chance.
To understand the implications of this example, let’s look at some data. I’ve demonstrated before that the growth rate of GDP is the sum of two components: growth in the number of workers (employment growth), plus growth in output per worker (productivity). The “structural” part of employment growth is driven by demographic factors like population growth and the age profile of the work force, while the “cyclical” part of employment growth is driven by changes in the unemployment rate (which falls when employment growth exceeds labor force growth, and rises when employment growth falls short of labor force growth).
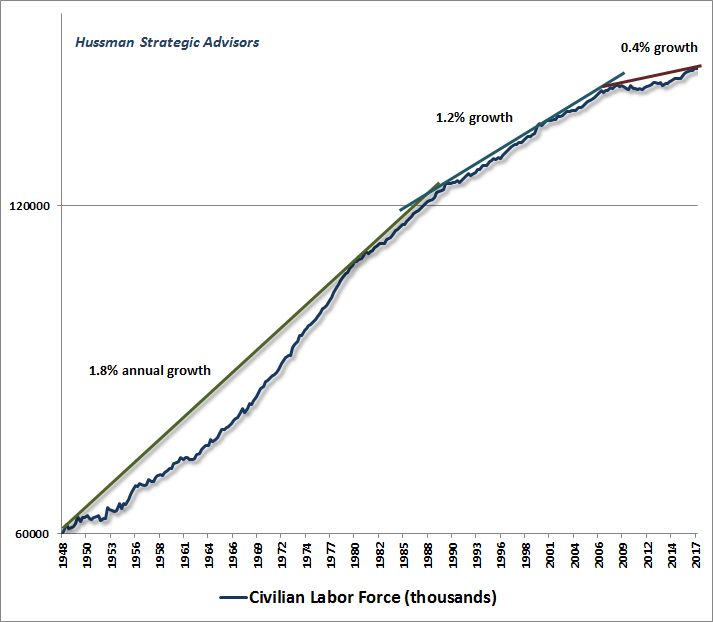
The charts below recap the behavior of these components. First, because of long-term changes in population growth and other demographic factors, U.S. labor force growth has gradually declined from 1.8% annual growth in the early post-war years, to just 0.4% annual growth today.
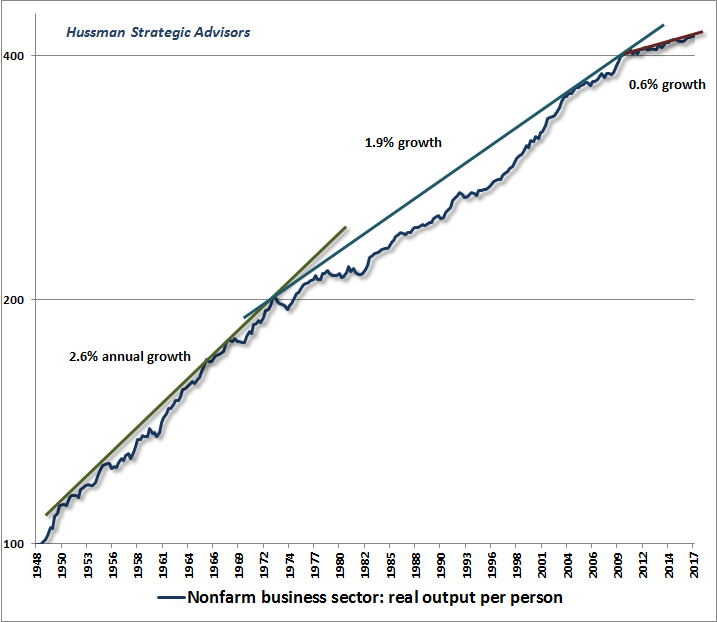
The trajectory of labor productivity shows a similar pattern of maturation and slowdown over the post-war period, with real output per person slowing from 2.6% growth in the early post-war years, to just 0.6% annual growth today.
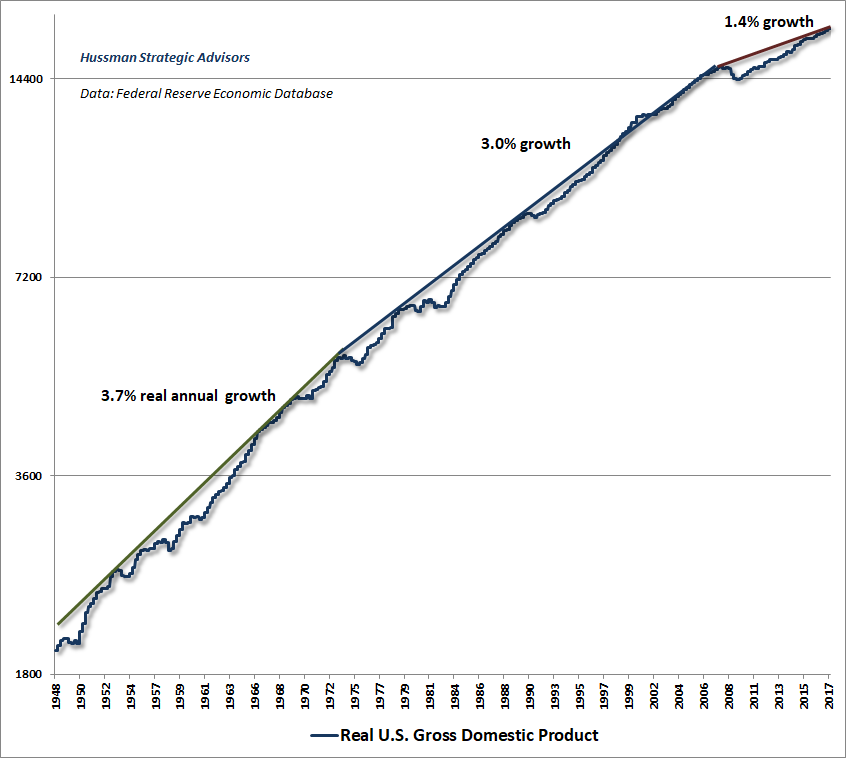
Add 0.4% labor force growth and 0.6% productivity growth, and you get 1% “structural” GDP growth. Not surprisingly, the slowdown in these drivers of real GDP growth have been observed in the form of real U.S. GDP growth averaging less than half of its historical rate. Indeed, even if productivity growth was to suddenly accelerate enough to fully recover the 1.9% average pace of the 1972-2012 period, structural economic growth would still be just 2.3% annually.
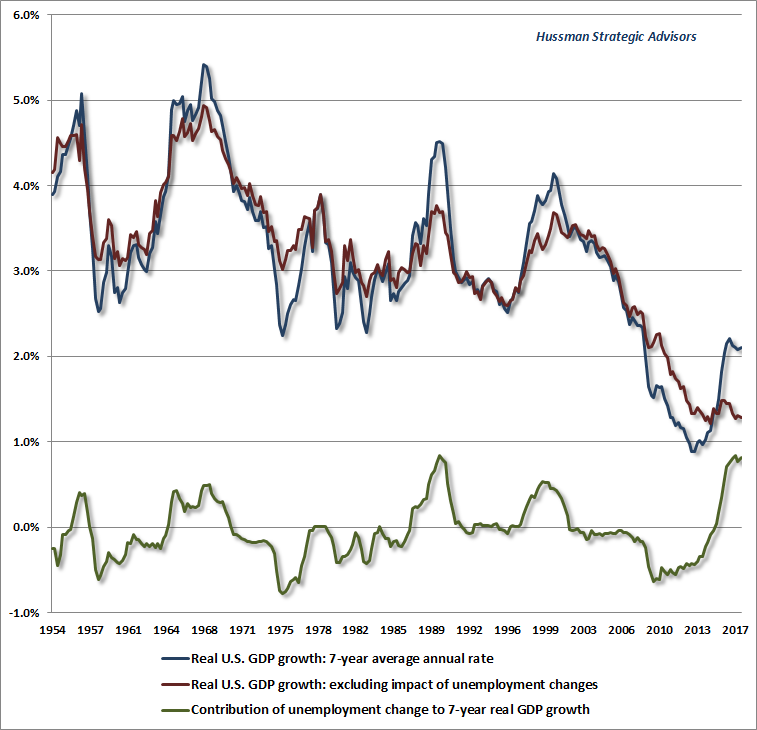
So even in the event of a surge in economic productivity, the trajectory of U.S. GDP growth is likely to be constrained to the 1-2% range. Any growth beyond that range for U.S. real GDP would have to be driven by the “cyclical” component of employment growth, namely a falling unemployment rate. Since 2009, the rate of unemployment has dropped from 10% to just 4.1%, contributing nearly half of the 2.2% annual GDP growth we’ve observed since the bottom of the global financial crisis. Given the current level of unemployment, the scope for further “cyclical” contributions to GDP growth is quite limited. Indeed, any material increase in the unemployment rate at this point would quickly reduce real GDP growth below that 1-2% “structural” expectation, which is another way of saying that economic recessions are likely to emerge more easily than in the past, not less. The chart below illustrates the impact of structural and cyclical components of GDP growth.
The bottom line here is that while interest rates are indeed low, those low interest rates are also coupled with substantially lower growth prospects than in the past. The belief that low interest rates “justify” high equity market valuations may sound appealing, but is only true if the trajectory of cash flows is held constant. That’s not the case here. The simple fact is that no valuation premium at all is “justified” by the combination of low interest rates and low structural economic growth prospects. Moreover, even if valuation multiples were at their historical norms, expected market returns would still be below their historical norms, as a result of lower structural growth. Again, this can be demonstrated using any discounted cash flow approach.
Likewise, even before the recent tax cuts, the effective U.S. corporate tax rate (actual taxes paid as a fraction of pre-tax corporate earnings) was already just 20%; one of the lowest levels in history outside of U.S. recessions. Even if the recent cut reduces the effective corporate tax rate to just 12%; the increase in after-tax earnings would be (1-0.12)/(1-0.20)-1 = 10%, and stock prices would deserve to fully capitalize that as a 10% price increase only if the cuts were expected to permanently survive every future Congress and Administration.
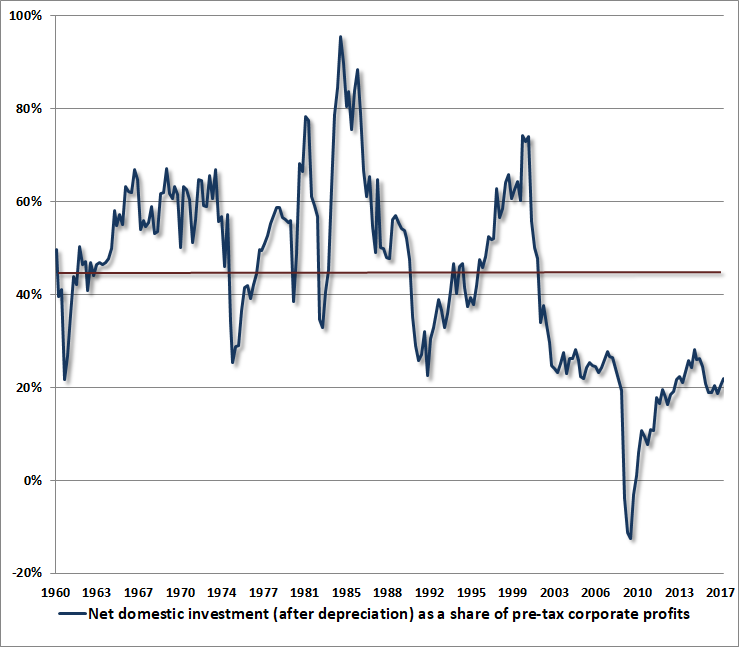
Meanwhile, given that record earnings and depressed corporate borrowing rates have not sufficed to boost net domestic investment beyond half of its historical norm, and prior tax windfalls (e.g. the 2004 repatriation holiday) were almost entirely expended on dividends and stock buybacks, there’s little reason to expect any sort of durable surge in capital spending. That’s particularly true given a 4.1% unemployment rate and already deep account deficits, since rapid growth in capital spending invariably emerges from wholly opposite conditions.
Given the current level of unemployment, the scope for further ‘cyclical’ contributions to GDP growth is quite limited. Indeed, any material increase in the unemployment rate at this point would quickly reduce real GDP growth below the 1-2% ‘structural’ expectation, which is another way of saying that economic recessions are likely to emerge more easily than in the past, not less.
Again, the essential survival tactic for the financial environment ahead is to recognize that market valuations can experience breathtaking departures from historical norms for extended segments of the market cycle, so long as shorter-term conditions contribute to speculative psychology rather than risk-averse psychology. The best observable measure of that psychological preference is the uniformity or divergence of market internals across a broad range of securities.
This distinction between investment and speculation allows one to understand how valuations were able to reach extremes like 1929, 2000, and today, without collapsing at much more modest levels of overvaluation; to understand how valuations can be so strongly related to long-term and full-cycle market outcomes while being nearly useless in navigating shorter segments of the market cycle; and to understand how we can fully expect a -65% market collapse over the completion of this cycle and yet maintain a fairly neutral immediate outlook (albeit with a preference for hedges to cover wicked tail risk).
Don’t discount discounted cash flows
A share of stock is ultimately nothing but a claim on a very, very long-term stream of cash flows that will be delivered into the hands of investors over time. Investment, properly defined, is concerned with the price one pays for that very, very long-term stream of future cash flows, and the returns that can be expected as a result of that tradeoff. On this front, the Iron Law is that the higher the price an investor pays for given stream of expected future cash flows, the lower the return the investor can expect over time. Conversely, the lower the price an investor pays for a given stream of expected future cash flows, the higher the return the investor can expect over time.
Notice that only two objects are required in this formulation: the stream of expected future cash flows, and the current price. The instant these two objects are in hand, the expected long-term investment return is also fully identified. For example, suppose a security promises a $100 payment a decade from today. If the price of that security is $46.32, one can immediately calculate that the expected return is 8% annually. Once the price is known, no appeal to interest rates is required to make that calculation. Of course, once that expected return is calculated, investors can compare it to the returns available on competing investments.
So given any stream of expected future cash flows, once valuations are observed (on sufficiently reliable measures), expected future returns are also observed. To say that valuations are elevated is then equivalent to saying that expected future investment returns will be depressed. Low interest rates may be used as an argument for why future investment returns should be below the norm, but they will be below the norm nonetheless.
Few things in the investment world are more intellectually distressing than an investor who believes that low interest rates “justify” extreme valuations, yet still believes that future investment returns will be satisfactory anyway. If interest rates are low because growth rates are also low, the situation is even worse, because no valuation premium is required in order to reduce future investment returns – the lower growth rate does that already. To assign extreme valuations to stocks in that situation is to reduce future returns even further. That’s exactly what investors have done.
I’ve often observed that every reliable valuation measure is nothing more than shorthand for a proper discounted cash flow analysis. The central requirement for the “fundamental” one uses for a valuation ratio is that it should act as a “sufficient statistic” that is proportional to, and representative of, the very, very long-term stream of cash flows that investors can expect to be delivered into their hands over decades. Earnings are certainly required in order to generate long-term cash flows, but year-to-year earnings (or operating earnings, or NIPA profits, or even Shiller earnings) are rather unreliable statistics for the long-term stream. While we’re sympathetic to the idea that profit margins could potentially be higher in the future than in the past (though most of the arguments we’ve seen to this effect are rather speculative), we’re not at all sympathetic to the idea that the appropriate adjustment is to elevate the expected value of future cash flows by a factor of 2.8.
As an empirical matter, we’ve regularly found that when we relate reliable valuation measures to subsequent S&P 500 total returns, a 10% expected 10-12 year market return generally corresponds to the pre-bubble (i.e. pre-1998) norms for those measures. Above-average valuations correspond to weaker returns, and below-average valuations correspond to stronger returns. This isn’t an accident. Rather, it should inform investors that the long-term returns they expect from stocks are tightly related to the prices they pay.
Every reliable valuation measure is nothing more than shorthand for a proper discounted cash flow analysis.
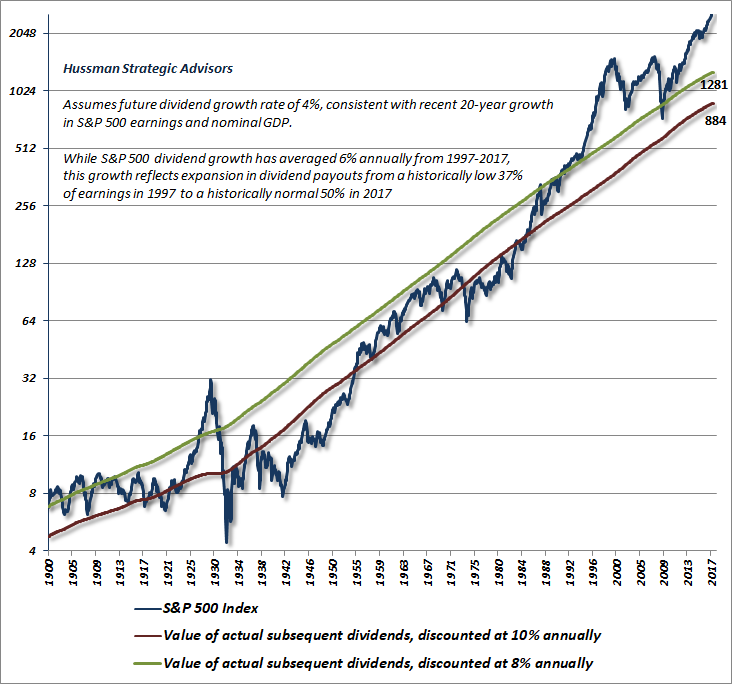
Back in 2007, as the market approached its peak before the global financial crisis, I demonstrated that with very few assumptions, one could actually calculate the level of the S&P 500 corresponding to a 10% expected return, at every point in time across history. The chart below shows this approach. Essentially, we’ve taken actual S&P 500 dividends since 1900, and discounted them back to present value at each point in time, using a 10% capitalization rate. Since future expected dividends also need to be estimated, the assumptions we use exert some effect on current estimates. Given the likelihood of 1-2% real structural GDP growth, we’ve assumed 4% annual nominal growth in future dividends, which is right in line with the growth rate of nominal GDP, corporate revenues, and corporate earnings over the past 20 years. Remember also that Standard & Poor’s already accounts for the impact of stock repurchases by reducing the index divisor (which boosts index-level dividends directly).
What we observe at present may be distressing, but we think it’s also accurate. In order for the S&P 500 to be priced for a 10% expected long-term annual return, the Index would presently need to trade at roughly 884; less than one-third of present levels. An 8% expected long-term return would correspond to a level of roughly 1281 on the S&P 500. Indeed, the Index reached this range of prospective returns even by the completion of the most recent market cycle, and the valuation level associated with an 8% expected return exceeds the actual value of the S&P 500 at nearly every point in history except the period surrounding the 1929 peak and the extremes of recent years. The only reason the S&P 500 has posted even 5.2% average annual total returns since the 2000 peak is that the recent extreme has restored the most offensive valuations in U.S. market history. We expect all of that total return to be erased over the completion of this market cycle.
The bottom line is that we fully expect a market retreat on the order of 50-65% over the completion of the current cycle. That’s a different statement than saying that it must occur immediately. If we’ve learned one thing in this speculative half-cycle, it’s to refrain from underestimating the speculative extremes that investors are capable of embracing. The appropriate response is not to try to “justify” current valuations, but rather to recognize the speculative factors that allow them to temporarily persist, and to closely monitor the uniformity and divergence of market internals. Given the potential for abrupt shifts, we’re partial to establishing tail-risk hedges early, but given the low level of implied volatility in the options market, those hedges are remarkably inexpensive relative to historical norms.
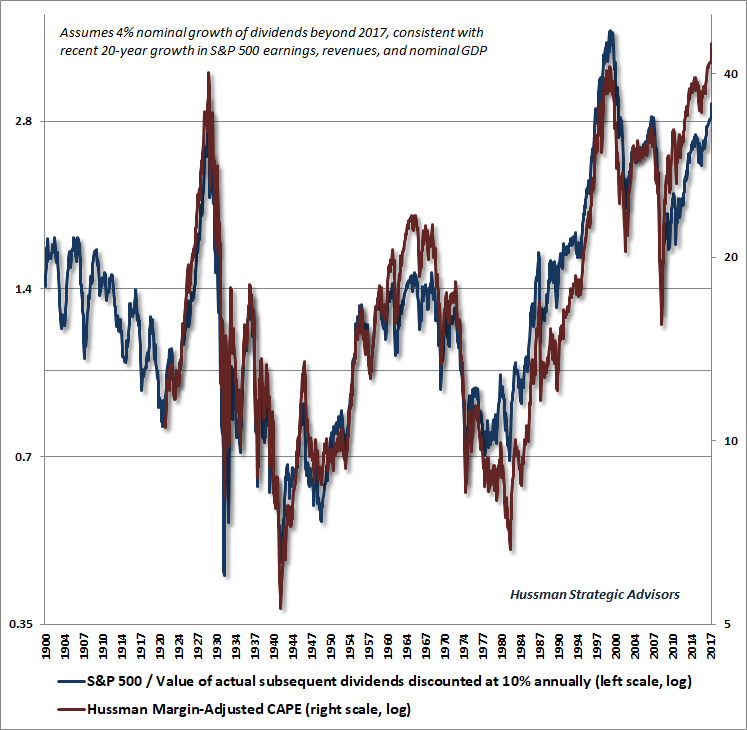
Again, every reliable valuation multiple is simply shorthand for a proper discounted cash flow analysis. The chart below offers a rather elegant illustration of this principle. The blue line shows the ratio of the S&P 500 to the estimated level (based on actual subsequent discounted dividends) where the Index would be priced for a 10% expected return in data since 1900. The red line presents the Margin-Adjusted CAPE on a log scale (right). It should come as no surprise that these measures are tightly correlated with each other, and with actual subsequent market returns across history.
Over the coming years, we expect roughly $20 trillion in capitalization to be erased from the U.S. equity market; a figure that is roughly the same size as U.S. GDP itself. Household financial assets have now reached the highest ratio to disposable personal income in history. Unfortunately, this measure (particularly the log ratio) has a strikingly negative correlation (-0.88) with actual S&P 500 returns over the subsequent 12-year period.
There’s no sense in encouraging investors to sell. In aggregate, that’s not possible. Somebody will have to hold equities over the completion of this market cycle. The best we can do is to speak our truth on behalf of those who value our work; to encourage investors to evaluate their market exposure, investment horizons and risk-tolerances; and to remind them that the position of valuations is likely to exert an enormous impact on their long-term returns, even if the speculative inclinations of investors sustain these extremes over a shorter segment of the market cycle.
The essential survival tactic for a hypervalued market, and its resolution ahead, is to recognize that market valuations can experience breathtaking departures from historical norms for extended segments of the market cycle, so long as shorter-term conditions contribute to speculative psychology rather than risk-averse psychology. Yet those departures matter enormously for long-term returns.
By the completion of this market cycle, there will likely be no talk of the “cost” of getting out too early. The 2000-2002 collapse wiped out the entire total return of the S&P 500 – in excess of T-bill returns – all the way back to May 1996. The 2007-2009 collapse wiped out the entire excess total return of the S&P 500 all the way back to June 1995. We correctly anticipated the extent of both collapses. I can’t emphasize strongly enough how much of our challenges in the recent half-cycle traced to our bearish response to “overvalued, overbought, overbullish” syndromes- which we’ve since subordinated to our measures of market internals, with no exceptions.
Frankly, I expect that the completion of the current cycle will wipe out the entire excess total return of the S&P 500 all the way back to roughly October 1997. That outcome would not even require our most reliable measures of valuation to revisit their historical norms. If you know how our measures of valuation and market action helped us to navigate prior complete market cycles, you know that it would be a mistake to underestimate the full-cycle risks investors currently face, regardless of whether or not those risks are realized immediately.
Keep Me Informed
Please enter your email address to be notified of new content, including market commentary and special updates.
Thank you for your interest in the Hussman Funds.
100% Spam-free. No list sharing. No solicitations. Opt-out anytime with one click.
By submitting this form, you consent to receive news and commentary, at no cost, from Hussman Strategic Advisors, News & Commentary, Cincinnati OH, 45246. https://www.hussmanfunds.com. You can revoke your consent to receive emails at any time by clicking the unsubscribe link at the bottom of every email. Emails are serviced by Constant Contact.
The foregoing comments represent the general investment analysis and economic views of the Advisor, and are provided solely for the purpose of information, instruction and discourse.
Prospectuses for the Hussman Strategic Growth Fund, the Hussman Strategic Total Return Fund, the Hussman Strategic International Fund, and the Hussman Strategic Dividend Value Fund, as well as Fund reports and other information, are available by clicking “The Funds” menu button from any page of this website.
Estimates of prospective return and risk for equities, bonds, and other financial markets are forward-looking statements based the analysis and reasonable beliefs of Hussman Strategic Advisors. They are not a guarantee of future performance, and are not indicative of the prospective returns of any of the Hussman Funds. Actual returns may differ substantially from the estimates provided. Estimates of prospective long-term returns for the S&P 500 reflect our standard valuation methodology, focusing on the relationship between current market prices and earnings, dividends and other fundamentals, adjusted for variability over the economic cycle.