

They’re Running Toward the Fire


John P. Hussman, Ph.D.
President, Hussman Investment Trust
Interim Comment: July 14, 2019
While investors appear exuberant about the prospect for Fed easing, they seem largely unaware that initial Fed easings have almost invariably been associated with U.S. recessions. They’re running toward the fire.
One of the most important warnings offered by firefighters is simple: get out early. In the face of wildfires, some homeowners get the idea of staying in their homes and riding it out. As one firefighter warned “The point is to go.” But if you don’t, it’s better to stay than to panic and run in the midst of a firestorm of smoke and embers. It’s not the fire that gets you. It’s the heat. Even before the flames reach the house, it can be fatal to stand outside trying to protect what you have (h/t John Galvin).
Similarly, our “Exit Rule for Bubbles” is straightforward: You only get out if you panic before everyone else does. You have to decide whether to look like an idiot before the crash, or look like an idiot after it.
Worse, investors often capitulate into panic selling only after their losses have become extreme. By then, it’s too late. It’s not the fire that gets them. It’s the heat. Once the warning signs are flashing, get out early. Attempting to squeeze the last bit out of a vulnerable, hypervalued market is what value investor Howard Marks describes as “getting cute.”
The key is that overvaluation is not enough. Extreme overvaluation can persist for long periods of time if investors have a speculative bit in their teeth. In prior market cycles across history, an effective approach would have been to tolerate overvaluation until either a) uniformly favorable market internals gave way to dispersion and divergence, indicating that investors had shifted from a speculative mindset to a risk-averse one, or b) extreme “overvalued, overbought, overbullish” features indicated that speculation had reached a precarious limit. Once divergent internals or overextended syndromes emerged, overvaluation typically permitted steep and often immediate market losses.
Indeed, those considerations were exactly the ones that allowed us to anticipate the 2000-2002 and 2007-2009 collapses, and to shift to a constructive outlook in-between. Our value-conscious discipline was enormously effective in multiple complete market cycles into 2009.
The advancing half-cycle since 2009 has been legitimately “different” from history in one specific way. While market internals have continued to be an effective gauge of speculation even amid the Federal Reserve’s policies of quantitative easing and zero interest rates, it was detrimental, in this cycle, to act on the idea that speculation had any reliable “limit” at all. To be clear, I was wrong. As long as investors had a speculative bit in their teeth, as evidenced by uniform market internals, even the most extreme “overvalued, overbought, overbullish” syndromes had no consequence.
Recognize that the market has been in a broadening top formation since market internals deteriorated in early 2018.
The most extreme speculation actually tapped itself out by January 2018. On Friday of last week, the S&P 500 Index set a fresh record high, but that high was just 4.9% above the January 2018 pre-correction peak, and just 2.8% above the September 2018 pre-correction peak. Much of the market’s volatility in the interim has been a battle between investors excited by the prospect of fresh Federal Reserve easing, and investors concerned about extreme valuations, emerging recession risk, and the potential for steep full-cycle market losses. This has produced market action that some might label a “megaphone.”

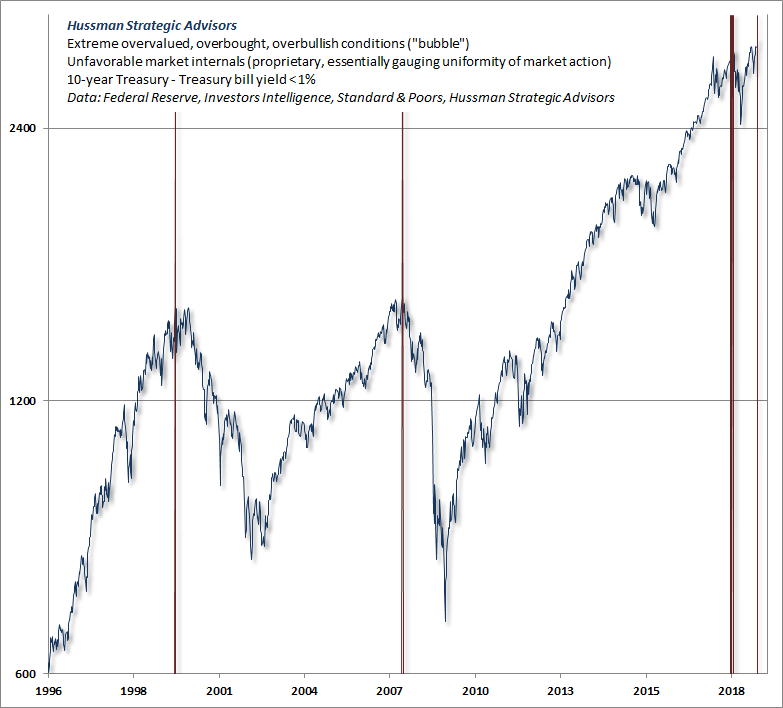
Look carefully at this chart. Our measures of market internals shifted negative on February 2, 2018, and except for a brief positive whipsaw earlier this year, have been unfavorable during the recent push to fresh market highs. We’ve seen a great deal of market volatility since early 2018, but little in the way of durable market gains.
The internal divergence over the past year has been a headwind for hedged equity strategies. The price-insensitive exodus toward passive investing has favored hypervalued, large-cap S&P 500 index components and “glamour stocks” over any disciplined stock selection approach. That’s not terribly unusual for late-stage bull market advances. Still, recognize that the market has been in a broadening top formation since market internals deteriorated in early 2018.
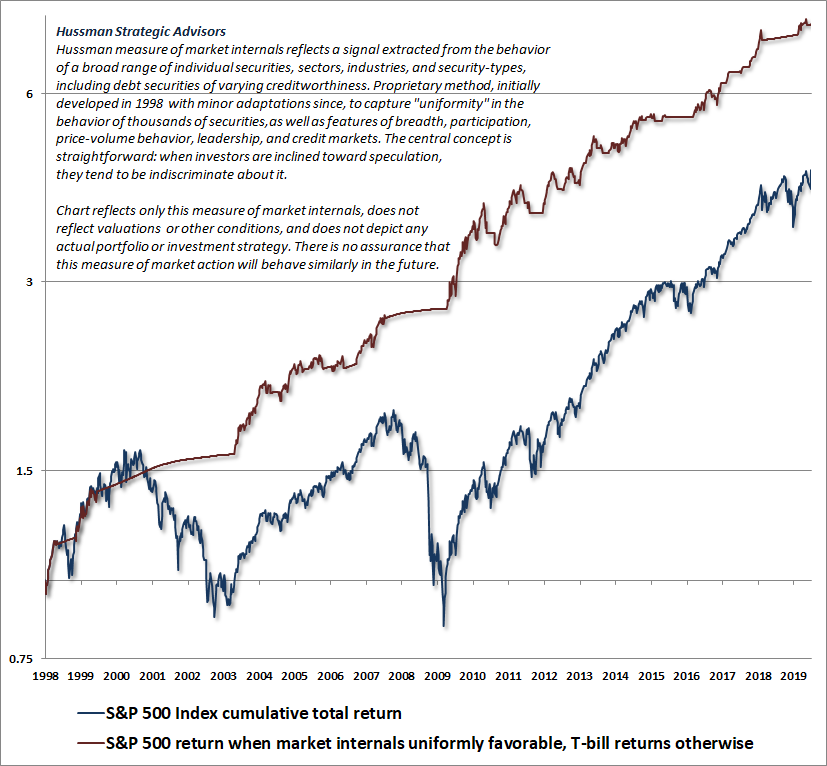
The chart below shows the cumulative total return of the S&P 500 since 1998 (when we initially introduced our measures of market internals), along with the cumulative total return of the S&P 500 restricted to periods of favorable market internals, accruing Treasury bill returns otherwise. Note that this chart is purely historical, does not depict the returns of any investment strategy, and that there is no assurance that market internals will distinguish periods of speculation and risk-aversion similarly in the future.
Overvalued, overbought, overbullish
As I’ve detailed extensively, the Federal Reserve’s extraordinary policies of quantitative easing and zero interest rates disabled every historically reliable “overvalued, overbought, overbullish” limit to speculation. In late-2017, we finally threw up our hands and abandoned those “limits.” While sufficiently extreme conditions can encourage us to adopt a neutral outlook, we will no longer adopt nor amplify a negative market outlook except in periods where our measures of internals are unfavorable.
Given a hypervalued market with still-unfavorable internals, history suggests that a “trap door” is already open here, which is permissive of abrupt and potentially vertical declines. Yet that was also the case at the beginning of July, so why post an interim update?
The reason is this. Though we no longer adopt a bearish outlook in response to extreme “overvalued, overbought, overbullish” syndromes when market internals remain favorable, I believe that it is still important to track when those syndromes emerge in the context of negative market internals, as we see presently.
One version of these syndromes is so extreme that I’ve simply labeled it “Bubble” in our database. Prior to the current market cycle, this extreme variant has only emerged just before the worst market collapses in the past century. The list of these instances: August 1929, the week of the market peak; August 1972, after which the S&P 500 would advance about 7% by year-end, and then drop by half; August 1987, the week of the market peak; July 1999, just before an abrupt 12% market correction, with a secondary signal in March 2000, the week of the final market peak; and July 2007, within a few points of the final peak in the S&P 500, with a secondary signal in October 2007, the week of that final market peak.
We observed a few instances of this syndrome, to no effect, in late-2016 and early-2017 during post-election exuberance about corporate tax cuts. As with other “overvalued, overbought, overbullish” syndromes, this syndrome hasn’t been enough – in itself – to place a reliable “limit” on speculation in the current market cycle.
What’s notable is that we observed this “Bubble” syndrome again last week, this time in the context of negative market internals and a relatively flat yield curve (where “relatively” flat here means a 10-year Treasury bond yield less than 1% above the 3-month Treasury bill yield). From my perspective, that’s a combination worth noting, because the only time we’ve observed it in weekly data was at the exact market high of March 2000, the exact market high of October 2007, the pre-correction market high of September 2018, and today. Restrict the criteria to a yield spread of 0.5% or less, and last week’s signal joins only two other ones, which precisely identify the bull market peaks of 2000 and 2007.
The point here is not to “call a market top,” though I certainly believe that the likelihood is significant. Rather, my point is to call attention to the full-cycle implications of where the market is at present. See, whether or not this is the very last chance to avoid the firestorm, “the point is to go.” I normally encourage passive investors to adhere to their discipline, provided that they have fully examined their tolerance for the steep market losses that regularly emerge over the completion of the cycle. That’s because the very long-term prospects of maintaining a passive investment position typically exceed Treasury bill yields, even at bull market tops.
The problem here is that, as of Friday July 12, our estimate of likely 12-year total returns for a conventional portfolio mix invested 60% in the S&P 500, 30% in Treasury bonds, and 10% in Treasury bills, has dropped to just 0.5%. A passive investment strategy is now closer to “all risk and no reward” than at any moment in history outside of the three weeks surrounding the 1929 market peak.
Look, I get it. The S&P 500 just hit a new record high, and it feels like vindication that the market has completely recovered last year’s October-December loss. This hubristic level of overconfidence is clear in the churlish and even aggressive way that any remark about potential market losses is dismissed. But objectively, the index is less than 3% above its September 2018 high, with the same warning signs and more – particularly on the economic front.
Presently, we observe market conditions that have been associated almost exclusively, and in most cases precisely, with the most extreme bull market peaks across history.
Psychologically, it’s very difficult for investors to exit a bull market once stocks are even 7-8% off of their highs. Bear markets are punctuated by fast, furious, prone-to-failure rallies exactly to maintain the hope of recovering. That’s the whole point of our Exit Rule for Bubbles – you only get out if you panic before everyone else does.
Examine past bull market peaks, and you’ll invariably find that the initial decline was steep enough, usually within the first 15-30 trading sessions, to paralyze investors and keep them hoping and holding through the entire bear market that followed. Once the March 2000 peak was registered, the S&P 500 fell -11.2% over the next 15 trading sessions. Though the S&P 500 nearly recovered its peak at the beginning of September 2000, it gave back -12.6% over the next 28 sessions. Similarly rapid losses followed the 1987, 1990, and 2007 market peaks. Those initial losses are precisely what lock investors into paralysis.
They’re running toward the fire
The current market highs are dominated by a single concept: the idea that the Federal Reserve is likely to shift to an easing mode in the months ahead, most likely at its July 30-31 meeting. I don’t doubt that prospect at all. The problem, as I observed in my regular July comment, is that with the exceptions of 1967 and 1996, every initial Fed easing (ultimately amounting to a cumulative cut of 0.5% or more, following a period of tightening in excess of 0.5%), has been associated with a U.S. economic recession.
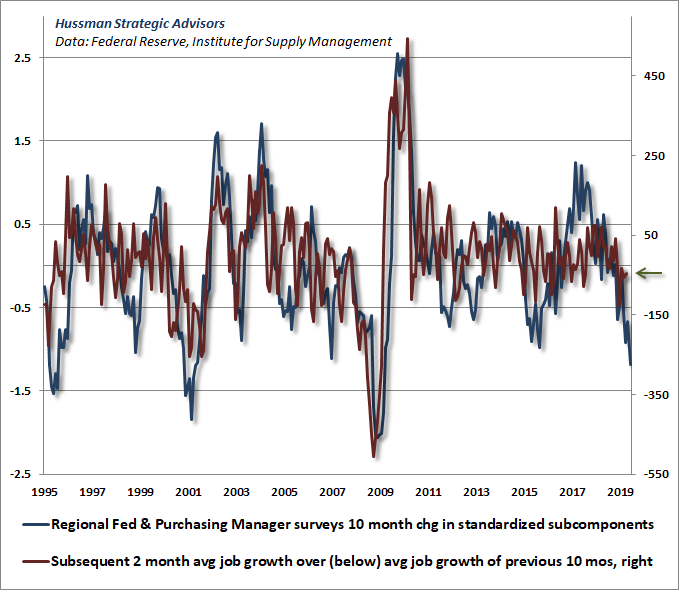
When we examine our leading measures of economic activity, based on national and regional Federal Reserve and purchasing managers surveys, we find that weakness in the broad composite tends to lead employment data by about two months. Specifically, a 10-month change in the composite measure is well-correlated with the change in non-farm payrolls over the following two months, relative to average job growth over the preceding 10 months.
Investors should allow for the distinct possibility that the jobs data will take a rather dark turn shortly.
To put some numbers around this, over the past 10 months, non-farm payrolls have grown by about 185,000 jobs per month. Yet the plunge we’ve observed in leading measures implies a shortfall of over 250,000 from that average, suggesting that we may observe negative payroll numbers in the coming months. That’s a noisy estimate, of course, and payroll numbers are often heavily revised well after economic turning points have been set, but investors should allow for the distinct possibility that the jobs data will take a rather dark turn shortly.
It’s also notable that we’re observing a very wide dispersion between Civilian Employment (reflecting the “household” survey used to calculate the unemployment rate) and Non-Farm Payrolls (reflecting the “establishment” survey that typically makes headlines). In the first 6 months of 2019, Civilian Employment grew by only 60,000 jobs. The chart below offers some idea of that dispersion.
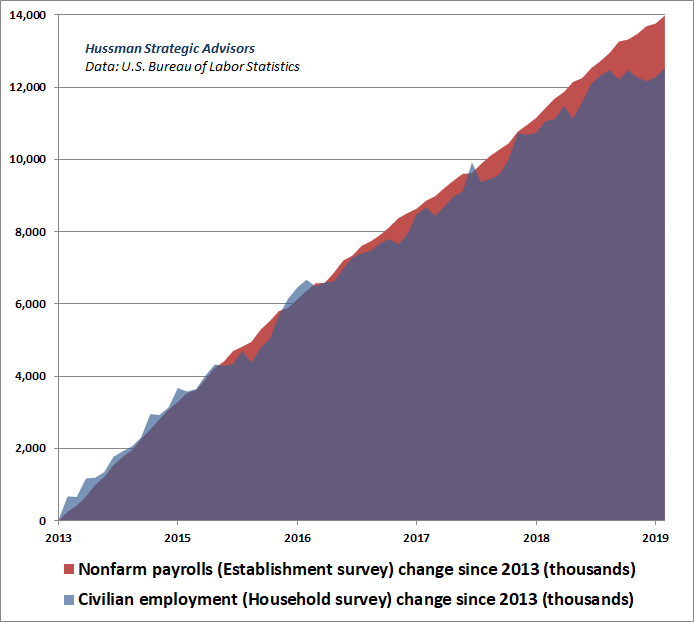
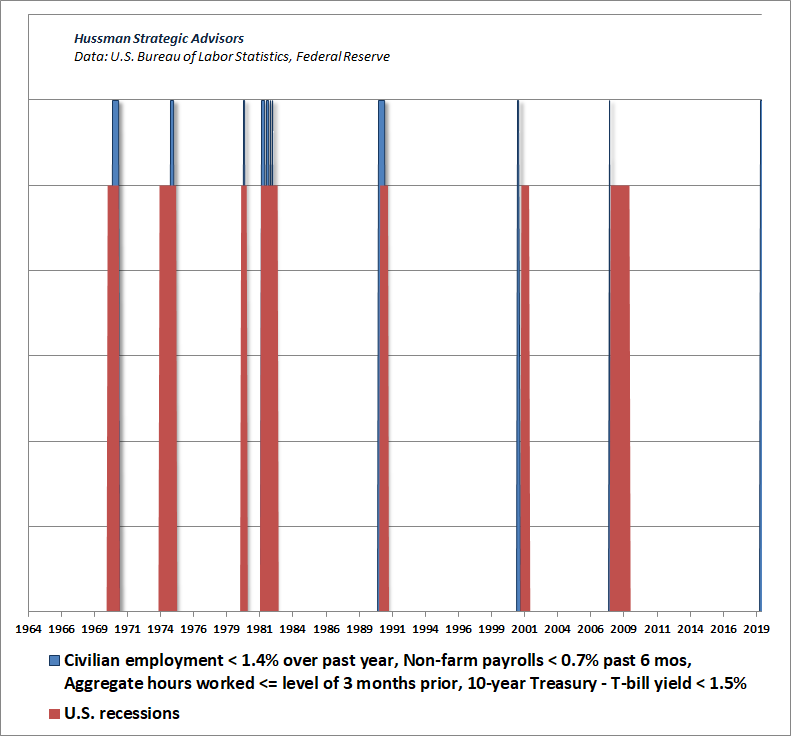
Notably, if we examine points in history similar to the present, where Civilian Employment grew by less than 1.4% year-over-year (a threshold originally proposed by Martin Zweig), Non-Farm Payrolls grew by less than 0.7% over the prior 6-month period, aggregate hours worked were flat or down over the prior 3-month period, and the yield curve was even moderately flat, all of the previous instances were associated with U.S. recessions.
Put simply, while investors appear exuberant about the prospect for Fed easing, they seem largely unaware that initial Fed easings have almost invariably been associated with U.S. recessions. They’re running toward the fire.
Valuation review
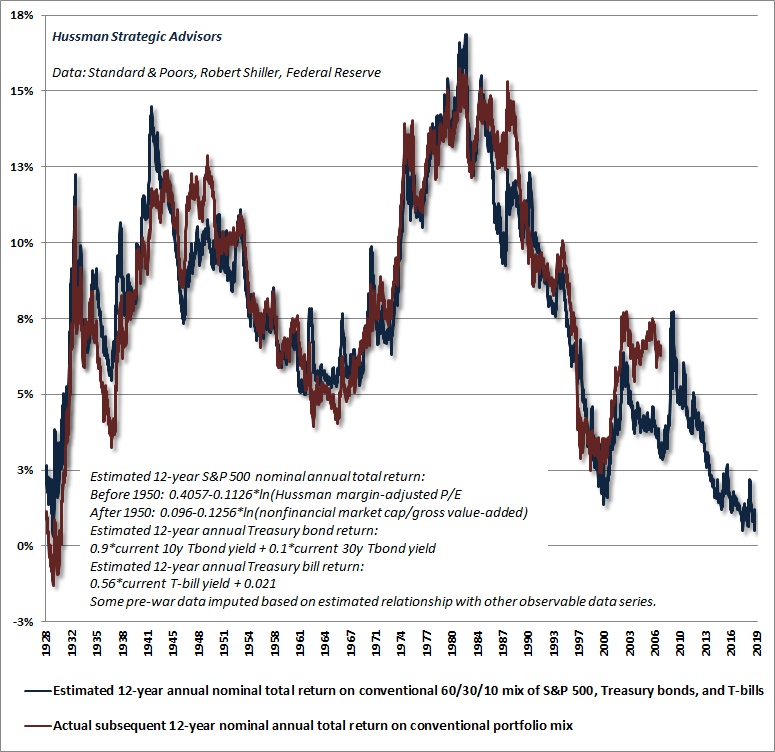
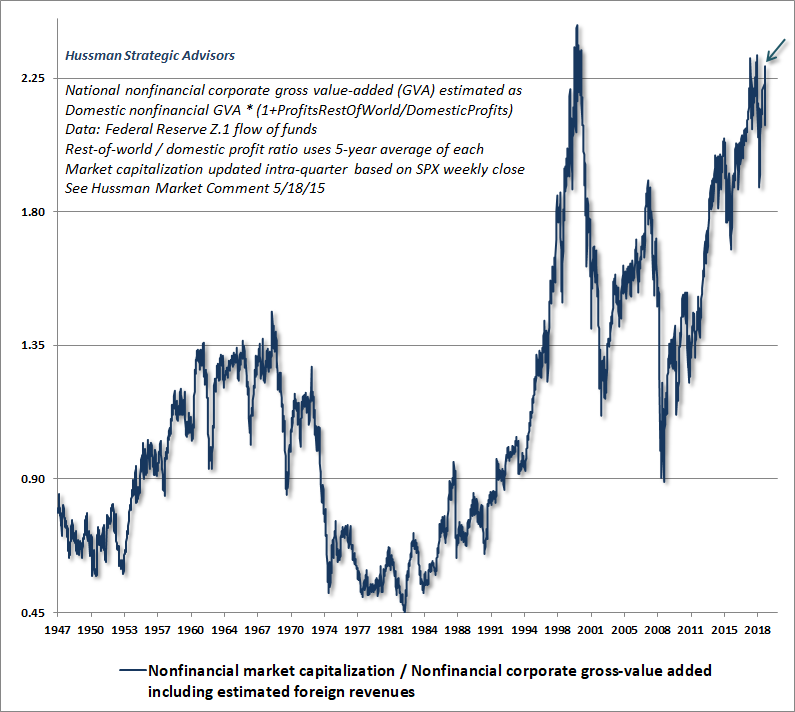
Finally, as a brief update to valuations, the two charts below present the measures we find best correlated with actual subsequent S&P 500 total returns in market cycles across history, easily outperforming price/forward earnings, the Shiller CAPE, and the Fed Model, among other measures.
The first chart shows our measure of nonfinancial market capitalization to nonfinancial corporate gross value-added, including estimated foreign revenues. Notice something. The current multiple is 2.27. The highest level ever observed at the end of any market cycle in history was in October 2002, when the multiple set a trough of 1.11. Of course, that trough proved to be temporary, and both market valuations and the S&P 500 itself plunged to lower levels during the 2007-2009 collapse. Still, even a retreat in valuations to the highest level ever observed at a bear market trough would take the S&P about 51% lower. I actually view that outcome as optimistic.
The next chart shows our Margin-Adjusted P/E (MAPE), which behaves largely as a market-wide price/revenue ratio, and allows calculation back to the 1920’s. As of Friday, July 12, the MAPE stood at 46.02. The highest level ever observed at the end of any complete market cycle was 19.83, in October 2002. A retreat simply matching that level would imply a market loss of about -57% over the completion of the current cycle. Averaging the “optimistic” outcomes for the MAPE and MarketCap/GVA, the S&P 500 would have to lose about -54% simply to reach the highest level of valuation seen at any bear market trough. Such a loss would be enough to wipe out every bit of total return that the S&P has enjoyed, over-and-above Treasury bills, all the way back to 2000. Complete cycles matter.
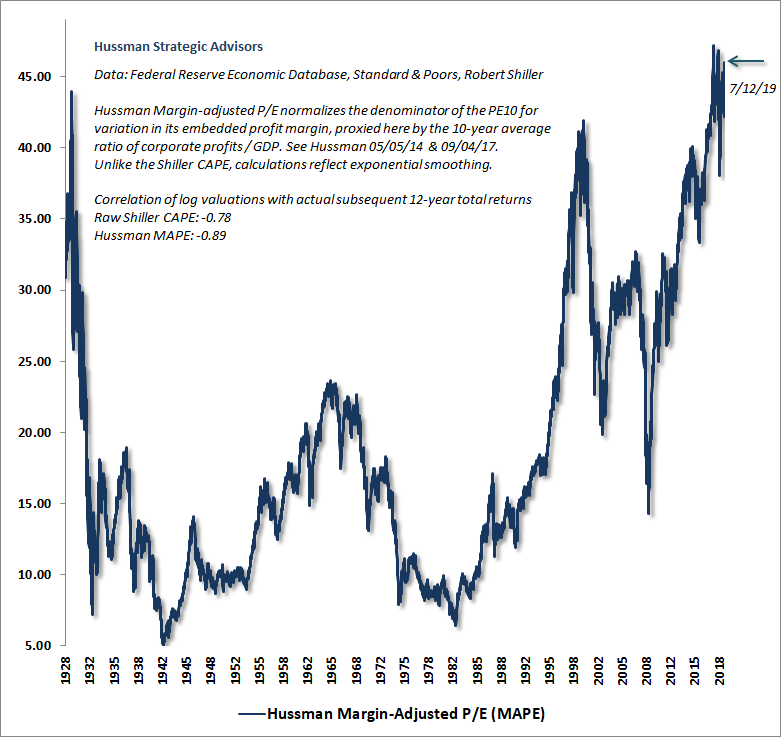
Notice that the MAPE actually exceeds the level observed at the 1929 peak. That’s not to suggest that I expect Depression-like market losses to follow. As I’ve noted before, the -89% market loss during the Depression can be thought of as two back-to-back losses, each representing two-thirds of the market’s value. The first two-thirds was a rather standard, run-of-the-mill outcome, given the hypervaluation of the market at the 1929 peak. It was the second two-thirds loss, largely the result of policy failures, that made Depression losses so severe.
One may argue, perhaps defensibly, that aggressive monetary and fiscal policy can avoid Depression-type economic outcomes, but remember that there’s really very little correlation between Federal Reserve policy changes and more general, cyclical economic fluctuations. Indeed, the trajectory of every U.S. economic expansion – including this one – has followed a very simple mean-reverting path, where the output gap (real GDP vs. potential GDP) at the recession low has narrowed at a rate of roughly 8% per quarter. That trajectory has not been affected even by the most extraordinary monetary policies.
As for the financial markets, remember that the Fed eased aggressively throughout both the 2000-2002 and 2007-2009 collapses, and that the market’s response to Fed easing is highly conditional on investor psychology and the condition of market internals. In my view, unless market internals are explicitly favorable, one shouldn’t rely on Fed easing to provide much durable support for financial assets.
I continue to expect a market loss on the order of 60-65% over the completion of the current cycle. A 50% loss is a rather optimistic scenario, given that it would not even take valuations to the level we observed in October 2002, which was the highest level of valuation ever observed at the end of a market cycle. If our measures of internals were uniformly favorable, these full-cycle risks would remain, but we would defer our immediate concerns. It will remain important to monitor those internals, regardless of how extreme market valuations have become.
Presently, we observe market conditions that have been associated almost exclusively, and in most cases precisely, with the most extreme bull market peaks across history.
Don’t miss a special update! Join our 100% spam-free mailing list below.
Keep Me Informed
Please enter your email address to be notified of new content, including market commentary and special updates.
Thank you for your interest in the Hussman Funds.
100% Spam-free. No list sharing. No solicitations. Opt-out anytime with one click.
By submitting this form, you consent to receive news and commentary, at no cost, from Hussman Strategic Advisors, News & Commentary, Cincinnati OH, 45246. https://www.hussmanfunds.com. You can revoke your consent to receive emails at any time by clicking the unsubscribe link at the bottom of every email. Emails are serviced by Constant Contact.
The foregoing comments represent the general investment analysis and economic views of the Advisor, and are provided solely for the purpose of information, instruction and discourse.
Prospectuses for the Hussman Strategic Growth Fund, the Hussman Strategic Total Return Fund, the Hussman Strategic International Fund, and the Hussman Strategic Dividend Value Fund, as well as Fund reports and other information, are available by clicking “The Funds” menu button from any page of this website.
Estimates of prospective return and risk for equities, bonds, and other financial markets are forward-looking statements based the analysis and reasonable beliefs of Hussman Strategic Advisors. They are not a guarantee of future performance, and are not indicative of the prospective returns of any of the Hussman Funds. Actual returns may differ substantially from the estimates provided. Estimates of prospective long-term returns for the S&P 500 reflect our standard valuation methodology, focusing on the relationship between current market prices and earnings, dividends and other fundamentals, adjusted for variability over the economic cycle.