

December 2022 Portfolio Notes


John P. Hussman, Ph.D.
President, Hussman Investment Trust
December 2022
Fund News: On December 2, 2022, Hussman Strategic Allocation Fund paid a capital gains distribution of $1.7395 per share, representing a short-term capital gain of $0.8324 per share and a long-term capital gain of $0.9071 per share. For shareholders who have elected to reinvest distributions, the result is to own a larger number of shares, at a lower distribution-adjusted price. From a tax standpoint, the distribution results in a current taxable gain (for taxable accounts), but also reduces the future tax liability because the Fund price is reduced by the amount of the distribution. We would prefer to avoid such distributions entirely, but doing so this year would have required us to offset the gains on our hedges by selling individual stocks that we view as core investments.
Strategic Allocation Fund and Strategic Growth Fund presently hold highly overlapping equity portfolios, reflecting our value-conscious stock selection discipline. From the inception of Strategic Growth Fund on July 24, 2000 through November 30, 2022, the unhedged equity investments and cash equivalents of Strategic Growth Fund have gained 10.36% annually, versus an average annual total return of 6.72% for the S&P 500. Our long-term stock selection record is why we generally prefer to maintain our core portfolio and hedge it in unfavorable markets, rather than simply holding cash.
Notably, from the inception of Strategic Growth Fund through November 30, 2010 – when the Federal Reserve aggressively expanded its zero-interest rate policies – the hedging approach of Strategic Growth augmented the Fund’s stock selection returns while also reducing portfolio volatility. The Fund remained ahead of the S&P 500 through May 20, 2014. However, as I’ve detailed extensively in other comments, our bearish response to historically-reliable “limits” to speculation became progressively detrimental, as zero-interest rates encouraged persistent yield-seeking speculation among investors well-beyond prior extremes. By the beginning of 2022, our most reliable valuation measures had exceeded the levels observed at both the 1929 and 2000 bubble peaks.
We adapted our discipline in late-2017 by abandoning our bearish response to previously reliable “limits” to speculation, when our measures of market internals suggest speculative behavior among investors. We introduced additional adaptations in 2021 to lean more heavily to a constructive investment outlook – regardless of the level of valuations – when our measures of market internals are uniformly favorable. These adaptations have restored the strategic flexibility that we enjoyed prior to the Federal Reserve’s foray into zero-interest rate policy, with Strategic Growth Fund nicely outperforming a more than 25% gain in the S&P 500 since the February 2020 pre-pandemic high, with substantially lower volatility.
Still, the adaptations to our discipline do not encourage us to adopt a constructive market outlook in overvalued markets with ragged and divergent internals, which is the set of conditions we presently observe, as we did at the 2000, 2007, and 2020 market peaks.
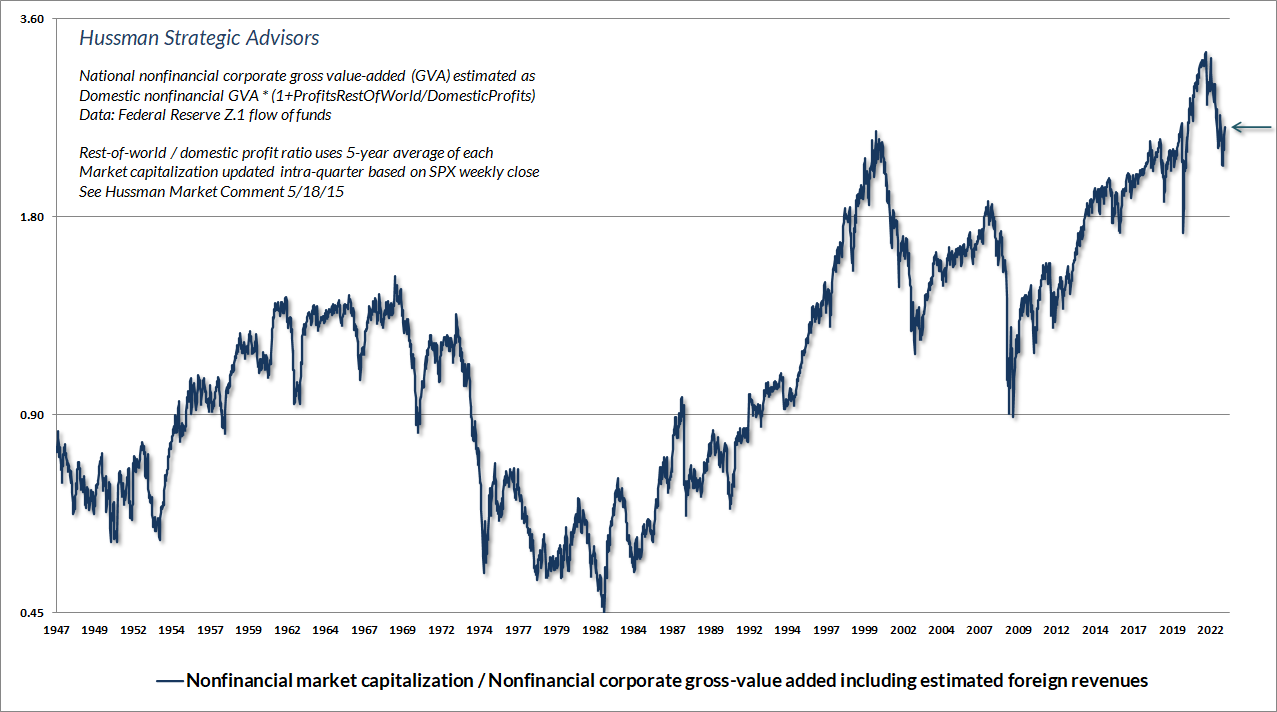
Year-to-date market losses have retraced the frothiest segment of the recent speculative bubble, yet valuations remain at levels that we continue to associate with negative expected S&P 500 nominal total returns over the coming 10-12 year period. As of November 30, 2022, the total return of the S&P 500 is down less than 15% from the most extreme level of stock market valuations in history, based on the measures that we find best-correlated with actual subsequent market returns across a century of market cycles. The chart below shows the ratio of nonfinancial market capitalization to gross value-added, including estimated foreign revenues (MarketCap/GVA).
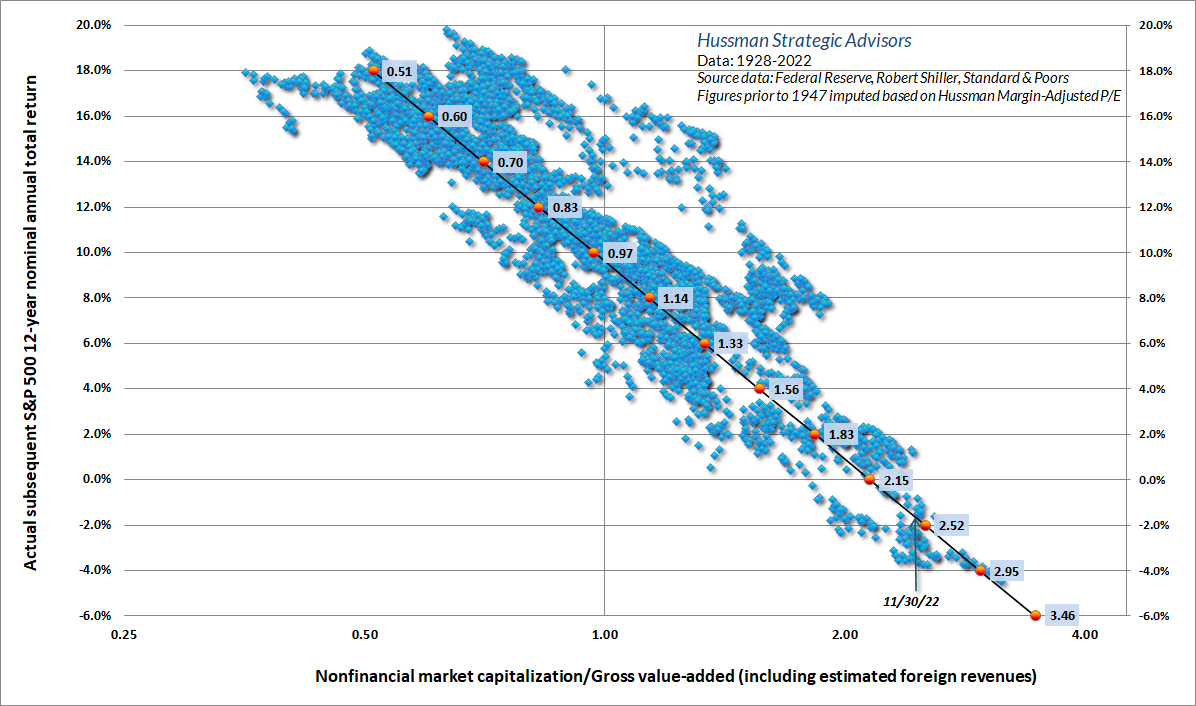
The chart below shows the relationship between MarketCap/GVA and actual subsequent 12-year S&P 500 total returns. The extreme valuations reached at the beginning of 2022 occurred in the context of zero interest rates, in a financial system where the Federal Reserve was effectively forcing investors to choke down 36% of GDP in zero-interest money (mostly held indirectly through bank account balances). As part of its effort to address inflation pressures, the Federal Reserve is now explicitly paying 3.9% interest to banks on their reserve balances (IORB) and to money market funds on overnight funds (ON RRP) – a figure that is likely to move well above 4% in the coming weeks. As a result, the impact of these balances on yield-seeking speculation has been sharply reduced. This leaves the equity market at speculative valuations, but without the support of speculative pressures.
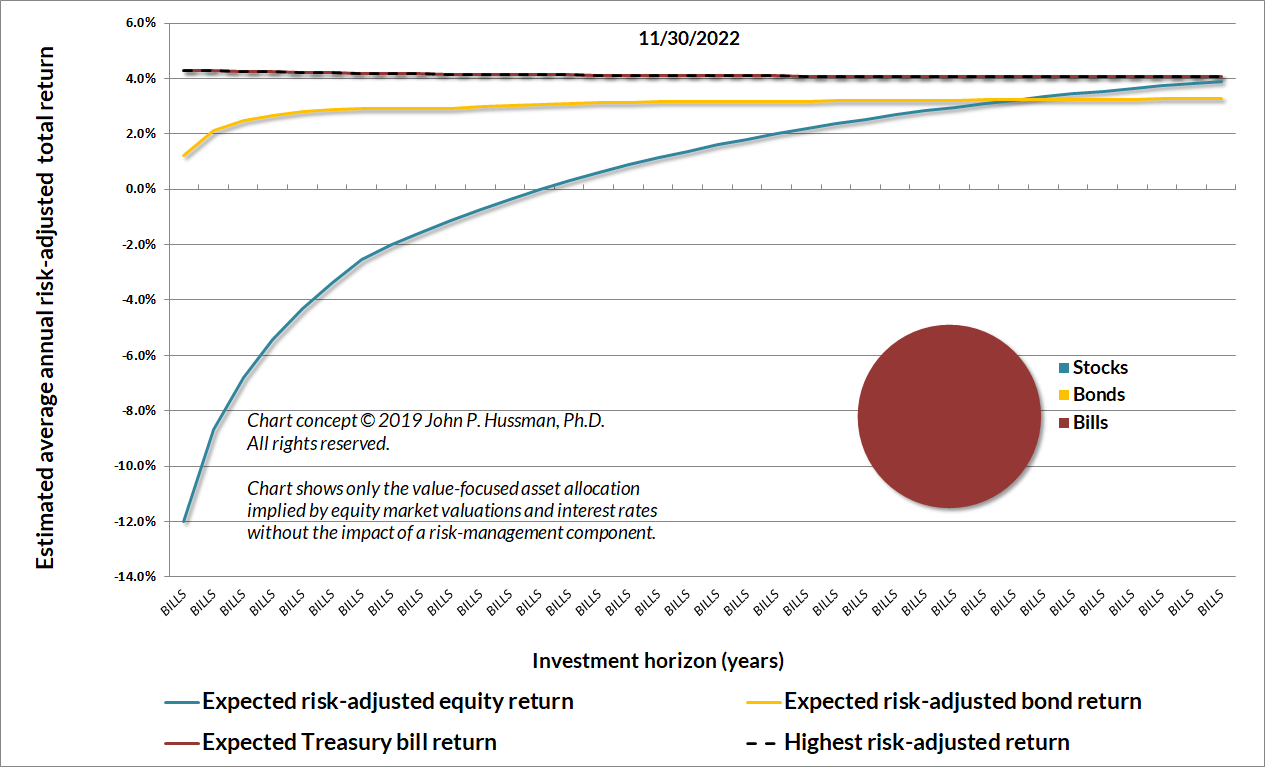
The next chart below shows our estimated “value-focused allocation” based on current equity market valuations and prevailing yields on Treasury bonds and bills, reflecting the methodology discussed in our 2019 white paper Strategic Allocation. The white paper includes similar charts, showing this allocation at a broad range of market extremes across history. There are only two periods when we’ve seen an all-cash profile: 1928 to early 1930, and 2021-2022. In practice, rather than holding cash during unfavorable market periods, our preference is to hedge our equity holdings, continuing to adhere to a value-conscious stock-selection discipline in our core portfolio.
The investment framework described in the Strategic Allocation white paper modifies this value-focused allocation with a risk-management component, to adjust exposure during segments of the market cycle where risk-aversion or speculation among market participants may temporarily drive valuations to depressed or elevated levels. On that front, our key measures of market internals continue to reflect ragged and divergent market action, based on the behavior of thousands of individual stocks, industries, sectors, and debt securities of varying creditworthiness.
In our view, steep market losses generally reflect risk-aversion meeting a low risk-premium. As a result, we continue to describe market conditions, particularly in equities, as a “trap door” situation. In Strategic Growth Fund, Strategic Allocation Fund and Strategic International Fund, our equity exposures are fully or nearly-fully hedged (Strategic Allocation Fund always holds at least 5% of assets in unhedged equities). That will change as market conditions change. As always, we believe that the strongest return/risk profile for stocks emerges when a material retreat in valuations is joined by a shift to uniformly favorable market internals. We’ve observed such a shift after every bear market decline since I introduced our key measure of internals in 1998, as well as in a century of historical data.
On the bond market front, it’s notable that all of the cumulative total return of Treasury bonds, in excess of Treasury bill returns, has historically accrued during periods when the 10-year bond yield has been at least 2% above Treasury bill yields, or alternatively, above year-over-year nominal GDP growth. That doesn’t mean that bonds cannot perform well in other conditions, but on average, bond returns have lagged Treasury bills when yields have been inadequate, as we presently view them to be. In our view, a 3.5% 10-year Treasury yield would be more enticing if 2-year Treasury notes and short-term Treasury bill yields did not provide higher (and for T-bills, still improving) alternative yields. Overall, our exposure to long-term bond market duration continues to be relatively limited, with Strategic Total Return Fund holding the majority of its assets in Treasury notes with an average duration of less than 2 years.
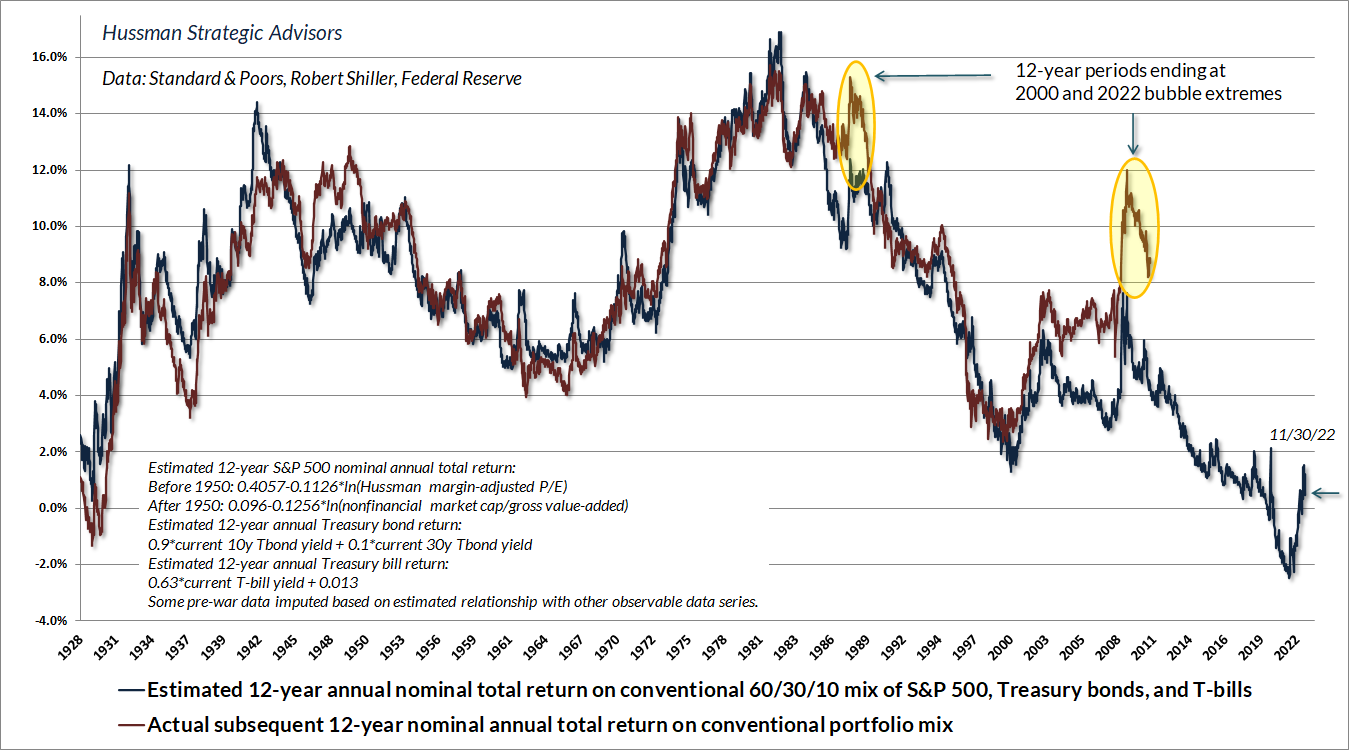
We continue to believe that a value-conscious, risk-managed, full-cycle discipline, focused on the combination of valuations and market internals, will be essential in navigating market volatility in the years ahead. The chart below shows our estimate of 12-year prospective returns for a conventional passive portfolio mix invested 60% in the S&P 500, 30% in Treasury bonds, and 10% in Treasury bills. The red line shows actual subsequent 12-year returns for this same portfolio mix. While year-to-date market losses have brought this estimate out of the negative territory that we observed at the recent speculative peak, our estimates are nowhere near levels that we would associate with satisfactory long-term returns. If our measures of market internals were to shift to a uniformly favorable condition, suggesting that investors have taken the speculative bit in their teeth, we would expect to adopt a more constructive outlook, despite rich valuations – albeit with position limits and safety nets. Presently, however, market conditions reflect neither what we would consider “investment merit” nor “speculative merit.”
Finally, on the precious metals front, we continue to view the valuations of precious metals equities as reasonable, which encourages us to hold about 10% of assets in this sector in Strategic Total Return Fund. Historically, precious metals shares have performed far better in periods when bond yields are declining (in general, below their level of 6-months earlier) than when they are advancing. Likewise, downward pressure on the U.S. dollar, which often emerges during the mid-to-late stage of U.S. recessions, also tends to benefit precious metals stocks. For now, our investment outlook in this sector is clearly constructive, but not aggressive.
Keep Me Informed
Please enter your email address to be notified of new content, including market commentary and special updates.
Thank you for your interest in the Hussman Funds.
100% Spam-free. No list sharing. No solicitations. Opt-out anytime with one click.
By submitting this form, you consent to receive news and commentary, at no cost, from Hussman Strategic Advisors, News & Commentary, Cincinnati OH, 45246. https://www.hussmanfunds.com. You can revoke your consent to receive emails at any time by clicking the unsubscribe link at the bottom of every email. Emails are serviced by Constant Contact.
The foregoing comments represent the general investment analysis and economic views of the Advisor, and are provided solely for the purpose of information, instruction and discourse.
Prospectuses for the Hussman Strategic Growth Fund, the Hussman Strategic Total Return Fund, the Hussman Strategic International Fund, and the Hussman Strategic Allocation Fund, as well as Fund reports and other information, are available by clicking “The Funds” menu button from any page of this website.
Estimates of prospective return and risk for equities, bonds, and other financial markets are forward-looking statements based the analysis and reasonable beliefs of Hussman Strategic Advisors. They are not a guarantee of future performance, and are not indicative of the prospective returns of any of the Hussman Funds. Actual returns may differ substantially from the estimates provided. Estimates of prospective long-term returns for the S&P 500 reflect our standard valuation methodology, focusing on the relationship between current market prices and earnings, dividends and other fundamentals, adjusted for variability over the economic cycle. Further details relating to MarketCap/GVA (the ratio of nonfinancial market capitalization to gross-value added, including estimated foreign revenues) and our Margin-Adjusted P/E (MAPE) can be found in the Market Comment Archive under the Knowledge Center tab of this website. MarketCap/GVA: Hussman 05/18/15. MAPE: Hussman 05/05/14, Hussman 09/04/17.