

Hussman Funds 2022 Semi-Annual Report and Shareholder Letter


John P. Hussman, Ph.D.
President, Hussman Investment Trust
February 2023
The Semi-Annual Report of the Hussman Funds for the period ending December 31, 2022 is now available online. Please click here for the full report (PDF). The report includes a detailed Letter to Shareholders and current outlook as of February 10, 2023, reprinted below, as well as extensive information including investment performance, portfolio holdings, fees, and expenses.
Dear Shareholder,
By relentlessly depriving investors of risk-free return over the past decade, the Federal Reserve has spawned an all-asset speculative bubble that we estimate will provide investors little but return-free risk over the coming decade. As usual, no forecasts are necessary. Our investment discipline is to align our market outlook with measurable conditions including valuations, market internals, and the observable behavior of interest rates, inflation, and other factors. There is no question that we view stock market valuations as perilously high, and likely to be followed by more than a decade of negative total returns. Yet we constantly gauge the condition of investor psychology – speculative versus risk-averse – based on the uniformity of market internals across thousands of securities. Our investment approach does not require valuations to return to their historical norms, though we constantly hold that possibility in mind. We have broadened the range of conditions in which we expect to adopt a constructive market exposure, with position limits and safety nets that reduce the risk that we believe is inherent in a hypervalued market.
-Hussman Funds 2021 Semi-Annual Report (02/11/22)
For the year ended December 31, 2022, the Hussman Funds performed as intended. All of the Funds pursue a value-conscious, historically-informed, risk-managed, full-cycle investment discipline. Amid significant market volatility, and continuing potential for extreme market turbulence, all of the Funds outperformed their respective benchmarks.
Strategic Growth Fund maintained a flexible but generally defensive stance toward market risk during the year ended December 31, 2022, and had a total return of 17.32%, compared with a total return of -18.11% for the S&P 500 Index. Strategic Allocation Fund also maintained a generally defensive investment stance during the year, and had a total return of 4.42%, compared with a total return of -16.86% for the Bloomberg U.S. EQ:FI 60:40 Index. Strategic Total Return Fund maintained an unhedged but modest exposure to interest rate volatility during the year, typically ranging between 2-3 years in duration, and had a total return of -6.23%, compared with a total return of -13.01% for the Bloomberg U.S. Aggregate Bond Index. Strategic International Fund maintained a generally defensive exposure to international equity market fluctuations during the year, and had a total return of -2.94% compared with a total return of -14.45% for the MSCI EAFE Index.
For the 3-year period ended December 31, 2022, Strategic Growth Fund had an average annual total return of 10.26%, compared with 7.66% annually for the Fund’s benchmark, the S&P 500 Index. The deepest interim loss for the Fund during this period was -13.11%, compared with an interim loss of -33.79% for the S&P 500 Index. Strategic Allocation Fund had a 3-year average annual total return of 7.58%, compared with 3.73% annually for the Fund’s benchmark, the Bloomberg U.S. EQ:FI 60:40 Index. The deepest interim loss for the Fund during this period was -5.11% compared with an interim loss of -21.68% for the benchmark. Strategic Total Return Fund had a 3-year average annual total return of 1.89% compared with a total return of -2.71% for the Fund’s benchmark, the Bloomberg U.S. Aggregate Bond Index. The deepest interim loss for the Fund during this period was -13.53% compared with an interim loss of -18.41% for the benchmark. Strategic International Fund had a 3-year average annual total return of -2.47%, compared with a 0.87% gain for the Fund’s benchmark, the MSCI EAFE Index. The deepest interim loss for the Fund during this period was -13.20%, compared with an interim loss of -33.90% for the benchmark.
Valuations and long-term returns
While 2022 was a challenging year for the financial markets, it is important to place stock and bond market losses in the context of valuations. Every security is a claim on a future stream of cash flows that investors expect to be delivered over time. For any given set of cash flows, the only way to increase the future expected return is to reduce the current price. For example, at the beginning of 2022, investors had priced 10-year Treasury bonds to provide a yield to maturity (average annual total return) of just 1.51%. By the end of the year, 10-year Treasury bonds were priced to provide average annual returns of 3.87% (as were 9-year Treasuries). To achieve that higher yield to maturity, the price decline required of 10-year Treasury bonds in 2022 was (1.0151^10) / (1.0387^9) – 1 = -17.46%, assuming a zero coupon for simplicity. From this lower starting price, the additional yield-to-maturity amounts to nothing but the expected recovery of that loss. The higher long-term return is the result of a larger advance in the price toward the face value of the bond as it matures, and for coupon bonds, of future cash flows being a larger percentage of the lower starting price.
Put simply, higher expected returns go hand-in-hand with lower starting valuations. Long-term returns are not determined by randomly flipping a coin, but by arithmetic. Respect for the relationship between current price, expected future cash flows, and long-term returns is what distinguishes “investing” from “speculation.” Year-to-year returns can experience a great deal of fluctuation, particularly as investor psychology shifts between speculation and risk-aversion. Yet long-term returns are much more mathematical in nature, because they are linked, and must ultimately be produced, by the delivery of future cash flows. There can be uncertainty around those cash flows due to default risk, or in the case of stocks, economic and business fluctuations. Yet in our analysis, the extent of the uncertainty around long-term economy-wide and index-level cash flows is far smaller than investors often seem to imagine. Long-term cash flows are also much less dependent on current-year profit margins than nearly all of Wall Street implicitly assumes when it values stocks based on a single year of “forward operating earnings.”
In the belief that low or zero interest rates left investors “no alternative” but to speculate, regardless of valuations, investors drove stock market valuations to a January 2022 extreme that, on our most reliable measures, stood at 3.6 times the historical norms that we associate with “run of the mill” long-term stock market returns (historically, about 10% annually). Presently, our most reliable valuation measures, based on their correlation with actual subsequent returns in market cycles across history, remain between 2.4 and 2.7 times their respective historical norms. These valuations exceed those observed at the 1929 and 2000 peaks, are matched by valuations observed at market peaks in 2018 and 2020, and are exceeded only by the final speculative advance to the January 2022 extreme. Nothing in our investment discipline requires these valuation measures to revisit their historical norms in the future. Still, it is worth repeating that respect for the relationship between current price, expected future cash flows, and long-term returns is the crucial distinction between “investing” and “speculating.”
As I observed in our 2021 Semi-Annual Report:
“Faced with short-term interest rates near zero, it may be reasonable for investors to expect stock market valuations to stand well-above their historical norms. It is also not impossible for the stock market to ‘grow its way out’ of extreme valuations. The main difficulty with valuations at 3.6 times their historical norms is arithmetic. If these valuation measures were simply to touch those norms 30 years from today, prices would have to grow 4% slower than fundamentals, on average, during that period (1/3.6 ^ 1/30 – 1 = -4.18%). Given that S&P 500 revenues, nonfinancial gross value-added, and nominal GDP have all grown at a rate of only about 4% over the past 10, 20, and 30 years, the same economic growth, coupled with that 4% valuation headwind, would combine to leave the S&P 500 Index unchanged over those 30 years.”
The market losses of 2022 have removed only the most speculative froth from the extreme valuations that the Federal Reserve encouraged through a decade of zero-interest rate monetary policies. In our view, these losses have not meaningfully restored “value,” particularly in the equity markets. Value is not measured by the extent that prices have declined, but by the relationship between prices and properly discounted cash flows. We presently observe little basis on which to expect adequate long-term returns from passive holdings in U.S. equities or Treasury bonds. As of early-February 2023, we estimate 12-year average annual nominal total returns of just 0.7% annually for a passive portfolio allocated 60% to the S&P 500, 30% to Treasury bonds, and 10% to Treasury bills.
This will change. Valuations and prospective long-term returns can change substantially even over a year or two. For now, however, the phrase “passive investment” seems something of an oxymoron. As I wrote in February 2020, with market valuations and estimated long-term returns close to present levels, “Whatever they’re doing, it’s not ‘investment’.”
Decades ago, the famed value investor Benjamin Graham wrote, “The habit of relating what is paid to what is being offered is an invaluable trait in investment. We are convinced that the average investor cannot deal successfully with price movements by endeavoring to forecast them. Our recommended policy has, however, made provision for changes in the proportion of common stocks to bonds in the portfolio, if the investor chooses to do so, according as the level of stock prices appears less or more attractive by value standards. That sounds like timing; but when you consider it you will see that it is not really timing at all, but rather the purchase and sale of securities by the method of valuation.”
The objective of the Hussman Funds is to provide investors with alternatives that pursue a value-conscious, historically-informed, risk-managed, full-cycle investment discipline. The Federal Reserve’s foray into zero-interest rate policy certainly required us to adapt in ways that increase our attention to speculative pressures and limit our reliance on historical “limits” to speculation. These adaptations have restored the strategic flexibility that we enjoyed across decades of complete market cycles, and their benefit has been increasingly evident in recent years – even amid an overall advance in the S&P 500 since 2019. Still, what quantitative easing and zero interest rate policy emphatically did not change is arithmetic, and specifically, the arithmetic that links current price, expected future cash flows, and long-term investment returns. In our view, the greatest risk in the financial markets is the willingness to ignore that arithmetic. Such willingness has never been permanent.
Portfolio Composition
As of December 31, 2022, Strategic Growth Fund had net assets of $542,397,568, and held 274 stocks in a wide variety of industries. The largest sector holdings as a percent of net assets were technology (23.6%), health care (17.0%), consumer discretionary (15.1%), consumer staples (9.2%), materials (8.2%), communications (7.7%), industrials (7.6%) and financials (7.0%). The smallest sector holdings as a percent of net assets were energy (4.4%), utilities (0.7%) and real estate (0.2%).
Strategic Growth Fund’s holdings of individual stocks as of December 31, 2022 were valued at $546,086,300. Against these stock positions, the Fund also held 825 option combinations (long put option/short call option) on the S&P 500 Index and 1,250 option combinations on the Russell 2000 Index. Each option combination behaves inversely to the underlying index, and has a notional value of $100 times the index value. On December 31, 2022, the S&P 500 Index closed at 3,839.50, while the Russell 2000 Index closed at 1,761.246. The Fund’s total hedge represented a notional value of $536,914,500, hedging 98.3% of the dollar value of the Fund’s investment positions in individual stocks.
Though the performance of Strategic Growth Fund’s diversified portfolio cannot be attributed to any narrow group of stocks, the following equity holdings achieved gains in excess of $1.5 million during the six months ended December 31, 2022: Dick’s Sporting Goods, The Buckle, Clearfield, Netflix, Super Micro Computer, Etsy, Sprouts Farmers Market and Biogen IDEC. There were no equity holdings with a loss in excess of $1.5 million during this period.
As of December 31, 2022, Strategic Allocation Fund had net assets of $25,162,361 and held 270 stocks in a wide variety of industries. The largest sector holdings as a percent of net assets were technology (17.7%), health care (13.0%), consumer discretionary (11.6%), consumer staples (7.0%), materials (5.9%), communications (5.8%), industrials (5.6%) and financials (5.5%). The smallest sector weights were energy (3.1%), utilities (0.6%) and real estate (0.2%). Treasury bills, Treasury notes and money market funds represented 28.8% of the Fund’s net assets.
Strategic Allocation Fund’s holdings of individual stocks as of December 31, 2022 were valued at $19,133,416, representing 76.0% of the Fund’s net assets. Against these stock positions, the Fund also held 27 option combinations (long put option/short call option) on the S&P 500 and 40 option combinations on the Russell 2000 Index. The notional value of this hedge was $17,411,634, hedging 91.0% of the value of equity investments held by the Fund. The Fund’s holdings in long-term Treasury obligations represented 9.6% of the Fund’s net assets.
In Strategic Allocation Fund, during the six months ended December 31, 2022, the following equity holdings achieved gains in excess of $50,000: Dick’s Sporting Goods, The Buckle, Clearfield, Netflix, Super Micro Computer, Etsy, Atlas Air Worldwide, Sprouts Farmers Market and Biogen IDEC. There were no equity holdings with a loss in excess of $50,000 during this period.
As of December 31, 2022, Strategic Total Return Fund had net assets of $224,880,382. Treasury bills, Treasury notes, Treasury Inflation-Protected Securities (TIPS) and money market funds represented 78.2% of the Fund’s net assets. Sector holdings of equities as a percent of net assets were precious metals shares (12.9%), energy (3.5%), exchange-traded funds (2.9%), utilities (2.0%), and industrials (0.4%).
In Strategic Total Return Fund, during the six months ended December 31, 2022, the following holdings achieved portfolio gains in excess of $200,000: AngloGold Ashanti ADR, Agnico Eagle Mines, and Cheniere Energy Partners. Portfolio losses in excess of $200,000 during this period were recognized in Nabors Industries, Laredo Petroleum, Barrick Gold, NRG Energy and Newmont, as well as several US Treasury securities, despite a typical portfolio duration of only 2-3 years during 2022.
As of December 31, 2022, Strategic International Fund had net assets of $14,051,131 and held 191 stocks in a wide variety of industries. The largest sector holdings as a percent of net assets were consumer discretionary (16.7%), financials (11.7%), communications (10.5%), health care (9.8%), industrials (9.6%), consumer staples (8.1%), technology (7.6%) and materials (7.2%), The smallest sector weights were utilities (3.1%), energy (1.9%) and real estate (1.8%). Investment in shares of money market funds accounted for 7.7% of net assets.
Strategic International Fund’s holdings of individual stocks as of December 31, 2022 were valued at $12,361,519. In order to hedge the impact of general market fluctuations, as of December 31, 2022, Strategic International Fund was long 12 put option contracts on the S&P 500 Index and short 75 futures on the Mini MSCI EAFE Index. The notional value of this hedge was $11,934,900, hedging 96.5% of the value of equity investments held by the Fund. Because part the hedge in Strategic International Fund reflected the use of long index put options without a matching short call option position, the Fund had a small positive net exposure to fluctuations in the international equity markets during the year.
While Strategic International Fund’s investment portfolio is diversified and the Fund’s performance is affected by numerous investment positions, the hedging strategy of the Fund was primarily responsible for the reduced sensitivity of the Fund to market fluctuations from the Fund’s inception through December 31, 2022. The only equity holding having a portfolio gain in excess of $35,000 during the six months ended December 31, 2022 was Europris ASA. Equity holdings with portfolio losses in excess of $35,000 during this period were recognized in Wacom Co. and International Distribution Services PLC.
Supplementary performance information for the Funds is available on the Hussman Funds website: www.hussmanfunds.com
Current Outlook
Despite broad-based equity market losses in 2022, the retreat is still nowhere near what we estimate would be needed simply to restore historically run-of-the-mill prospects for long-term equity returns. In our view, the potential loss in the Standard & Poor’s 500 Index remains about -60% from current levels. Still, as I noted in our 2021 Semi-Annual Report, our investment approach emphatically does not require valuations to return to their historical norms. The adaptations we have adopted in recent years restore the strategic flexibility that we enjoyed across decades of complete market cycles, allowing us to embrace even the possibility of sustained market overvaluation without concern, however unlikely we might consider that outcome.
Bonds
In the bond market, the yield on 10-year U.S. Treasury bonds advanced from just 1.51% at the beginning of 2022 to 3.87% by the end of the year, while the yield of 3-month Treasury bills advanced from just 0.06% to 4.38%. Given that Treasury bond yields remain well-below T-bill yields, the potential for further bond market losses depends largely on what yield investors view as acceptable based on inflation, competing yields, and economic activity. Historically, the total return of 10-year Treasury bonds has lagged Treasury bill returns, on average, when the yield on 10-year Treasury bond has been below the average of core CPI inflation, 3-month T-bill yields, and year-over-year nominal GDP growth. As of December 31, 2022, that average stood at 5.80%. In early-February 2023, 10-year Treasury bond yields fell as low as 3.33%, further widening the gap from these benchmarks.
In our view, prevailing bond yields already rely on a significant retreat in inflation, as well as explicit Federal Reserve interest rate cuts, leaving little room for further declines in yield except in the event of fresh economic weakness or credit distress. We currently view this tradeoff between potential return and risk as inadequate to justify significant exposure to long-term bonds.
Inflation pressures peaked in mid-2022 and eased modestly by the end of the year. Core consumer prices increased by 5.7% during 2022, while the core personal consumption expenditures price index increased by 4.4%. It is possible that inflation may retreat progressively from these levels, but the historical record suggests that inflation shocks tend to decay over a period of years rather than quarters. Indeed, across history, we find that the best predictor of inflation is not unemployment, GDP growth, or even Federal Reserve policy. Rather, inflation has a significant psychological component; the best predictor of inflation is the most recent rate of inflation, with the next best predictor being lagged inflation from the previous year. After that, the best correlates of inflation, although weaker, are negative economic shocks, which exert downward pressure on inflation, as well as tight capacity and supply shocks – particularly amid unsustainable government deficits – which exert upward pressure on inflation.
In recent months, investors appear to have taken rapidly declining inflation and resumed monetary easing for granted, embedding those expectations into bond yields and still-elevated market valuations. Having done so, investors now rely on those outcomes. Any stall in progress on the inflation front, and particularly any upward surprise in core inflation even on the order of 0.2-0.4%, could be disruptive to both bonds and stocks. Meanwhile, the most likely drivers of improving inflation –economic recession and credit strains – would pose their own challenges to the financial markets. In our view, this creates a tightrope: the failure of inflation to resolve quickly would be unfavorable for the financial markets, yet the conditions most likely to produce a quick resolution of inflation would also be unfavorable for the financial markets.
Precious metals
With regard to precious metals and other commodities, inflation does tend to be supportive for these assets. Yet the combination of rising nominal interest rates and gradually easing inflation pressures also means that “real” after-inflation interest rates have been pressed higher. This has been particularly true in the U.S., resulting in upward pressure on the foreign exchange value of the U.S. dollar. Historically, the shares of precious metals companies tend to perform most strongly when real interest rates and the U.S. dollar are falling, particularly when nominal Treasury yields are falling as well.
The Hussman Funds generally held moderate positions in precious metals shares during 2022. In particular, Strategic Total Return Fund generally held between 8-12% of net assets in this sector during 2022, which we view as neither defensive nor aggressive in context of the Fund’s objective and history. I expect that more aggressive exposure to precious metals shares will await some combination of lower prices or downward pressures on real and nominal interest rates.
Equities
We continue to view elevated stock market valuations as the most pointed risk faced by most investors. The chart below presents several of our most reliable market valuation measures, each as a multiple to its own historical norm. The lines are nearly indistinguishable, as their shared reliability is reflected in similar behavior over time. A color version of this chart is presented in the online version of this Semi-Annual Report (www.hussmanfunds.com). While the 2022 retreat in U.S. equity markets has removed the most extreme speculative froth from valuations, all of these measures remain near their 2000 speculative peaks.
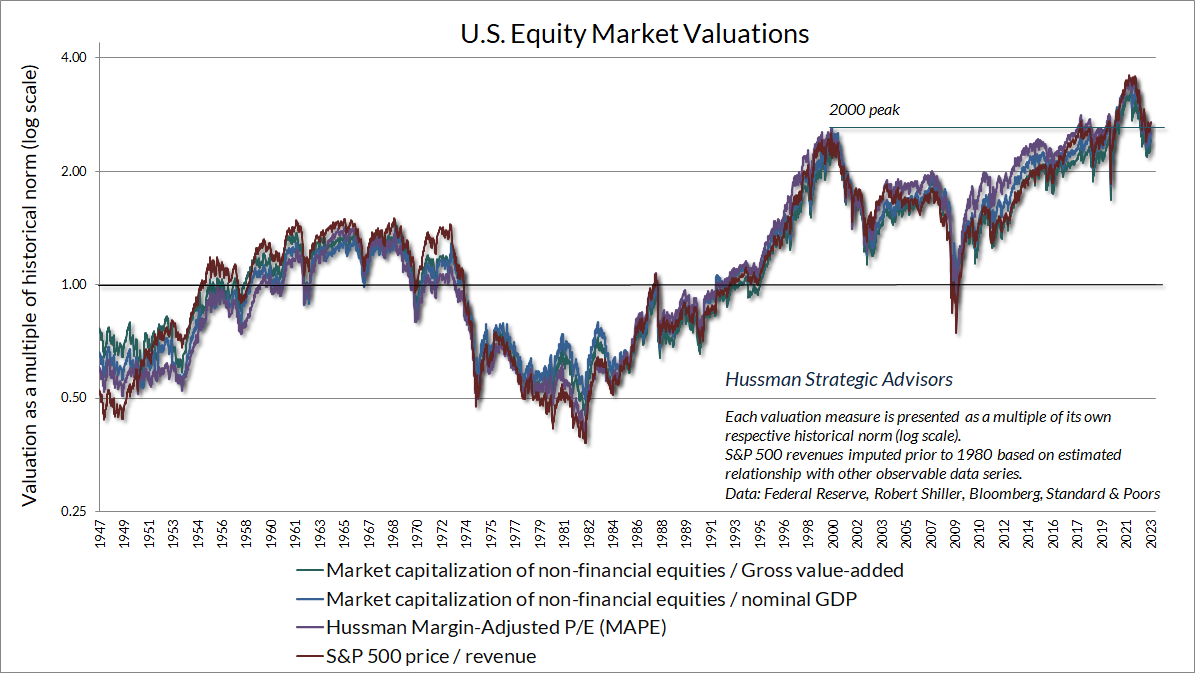
Several arguments are typically offered in defense of current speculative extremes. One suggestion is that these extremes are driven by very large companies such as Apple, Google, and Microsoft, that deserve their valuations due to high profit margins. The difficulty with this argument is that even when components of the Standard & Poor’s 500 Index are sorted by their price/revenue multiples, the median valuation of every subset has exceeded its 2000 extreme in recent years, from the 10% of components with the lowest multiples to the 10% with the highest multiples. The same is true when S&P 500 components are sorted by market capitalization. Moreover, when the components of the S&P 500 are sorted by market capitalization, the median profit margins of the largest stocks comprising 20-40% of S&P 500 market capitalization are no higher, relative to the median S&P 500 component, than has been typical over the past two decades. In short, the rich valuations we observe in the U.S. equity market are not the artifact of a handful of companies, nor have the largest companies become significantly more profitable in recent years, relative to other S&P 500 components.
It is true that the general level of corporate profit margins has been higher, across the board, than in 2000, but three clear macroeconomic drivers account for nearly all of that difference, and none are permanent. First, for several years following the 2008-2009 global financial crisis, profit margins enjoyed a significant boost due to depressed labor costs – a boost that has been gradually reversing since 2014. Second, low interest rates also helped to boost profit margins during the past decade. Economy-wide corporate interest costs closely track Baa corporate bond yields. Given that nonfinancial corporate debt is nearly the same size as nonfinancial corporate revenue, each 100 basis point decline in Baa corporate yields tends to reduce interest costs and boost profit margins by that same 100 basis points. This driver has sharply reversed in recent quarters, as the level of Baa interest rates moved from 3.3% to 5.6% in 2022. Finally, trillions of dollars in deficit spending caused a sharp but temporary boost in the income and savings of other economic sectors, as every deficit of government must be matched by a corresponding surplus in household, corporate, and foreign saving. This is not a theory but an accounting identity. Unless one expects multi-trillion dollar pandemic deficits to become the norm, this recent driver of corporate profits should not be viewed as sustainable.
Put simply, the data do not support the argument that current valuation extremes are somehow justified by a structural change in the composition of S&P 500 components, nor do they support the belief that elevated profit margins reflect a structural change in macroeconomic conditions. To the contrary, the data suggest that elevated profit margins in recent years have been driven by temporary and cyclical factors. Depressed labor costs were the primary driver between 2009-2014, followed by depressed interest costs due to zero interest rate monetary policies later in the decade, and finally amplified by pandemic deficits in recent years. In our view, it is dangerous and almost superstitious to take the bloated profit margins and corporate earnings of recent years at face value, and to value equities on that basis. The failure of profit margins to maintain a permanently high plateau could have very unpleasant consequences in a market where the price/revenue ratio of the S&P 500 is currently near 2.4, compared with a historical norm of less than 1.0.
Monetary policy and yield-seeking speculation
Investors often make the mistake of dismissing rich valuations if they do not result in immediate losses. That is emphatically not how valuations work. Extreme valuations are not equal to a near-term forecast about market direction. When investors are inclined to speculate, they tend to be indiscriminate about it, so the “uniformity” of market internals across thousands of stocks, industries, sectors, and security-types conveys information about that psychology. I developed our key measure of market internals in 1998, even before the inception of the Hussman Funds, and it has remained an important part of our investment discipline. In previous market cycles across history, there were also measurable “limits” to speculation. These syndromes combined overextended valuations, price behavior, and investor sentiment, and were regularly followed by severe market losses. The most important impact of unprecedented Federal Reserve policy in recent years – zero interest rates and quantitative easing (QE) – was to remove any well-defined “limit” to financial speculation.
The policy of “quantitative easing” involves changing the mix of government liabilities that are held by the public. It “works” largely by starving investors of yield. Specifically, the Federal Reserve (“Fed”) buys interest-bearing Treasury and mortgage securities for its balance sheet, and pays for them by creating different liabilities – bank reserves and currency – which someone in the economy has to hold instead, at every moment in time, until the Fed retires them. For much of the past decade, this money earned zero interest. Most of this base money is held by the public indirectly, as bank balances. The only way for a holder to get rid of this “base money” is to buy something, typically investment securities that might offer the hope of a higher return. Yet buying another security does not destroy the base money. The money just passes to the seller, like a hot potato. By January 2022, the Fed was forcing the public to choke down zero-interest base money in the breathtaking amount of 36% of GDP. The discomfort of investors with that much “zero” encouraged the most profound speculative financial bubble in U.S. history.
We estimate that until the Federal Reserve reduces its balance sheet to less than 16% of nominal GDP (which was the historical peak prior to 2008), holding interest rates above zero will require the Fed to explicitly pay interest to banks and financial institutions on reserves and “reverse repos.” The Fed is presently doing just that, paying interest in the amount of 4.65% annually. The effect is to convert zero-interest base money to the “synthetic” equivalent of interest-bearing Treasury bills. This reduces the incentive of holders to get rid of the base money through spending or yield-seeking speculation, and eases the pressure on both inflation and security valuations.
It is important to observe that easy monetary policy does not, in itself, ensure speculation or support financial markets. Recall, for example, that the Federal Reserve eased aggressively through the entire 2000-2002 and 2007-2009 market collapses. When investors become risk-averse, safe low-interest liquidity is treated as a desirable asset rather than an inferior one; creating more of it does not provoke speculation. It was easy money, combined with speculative investor psychology, that produced the recent financial bubble. We remain aware of the potential for fresh speculation and reckless Fed policy, and constantly monitor the uniformity of market internals for that reason, but we no longer assume that speculation or Fed recklessness have any reliable “limit.”
Value-conscious, historically-informed, risk-managed, full-cycle
The core elements of our discipline – value-conscious, historically-informed, risk-managed, full-cycle – drive both our security selection and our exposure to market risk. Our aim is to implement that discipline on behalf of our shareholders, as market conditions change over time. In that context, it is notable that from the inception of Strategic Growth Fund on July 24, 2000 through December 31, 2022, the equity investments and cash equivalents of the Fund had a cumulative total return of 748.72% (10.00% annually), versus a cumulative total return of 300.59% (6.38% annually) for the S&P 500. For more than a decade after the Fund’s inception, through October 2010, the hedging approach of the Fund both added to the stock selection returns of the Fund, and reduced downside risk. It is not a coincidence that this changed exactly when the Federal Reserve doubled down on its policy of quantitative easing; expanding the quantity of zero-interest base money beyond any historical range, encouraging relentless yield-seeking speculation, and ultimately driving equity market valuations above their 1929 and 2000 extremes.
While the challenges of deranged Federal Reserve policy ultimately led us to abandon our reliance on historically reliable “limits” to speculation, valuations and market internals remain essential elements of our discipline. We remain convinced that valuations are highly informative about likely long-term market returns, yet nothing in our approach relies on valuations to retreat to their historical norms. We remain convinced that speculation and risk-aversion can be distinguished by the uniformity and divergence of market action across thousands of securities, yet nothing in our approach relies on future restraint on the part of speculators or the Fed. We have broadened our ability to pursue a value-conscious discipline even amid rich valuations, yet nothing in our approach relies on the spectacular valuation extremes of recent years to be sustained – as passive investors now require.
In short, the adaptations we made in response to reckless monetary policy had one key objective: to restore our strategic flexibility. We have surrendered the “limits” that held us to a defensive outlook, yet we have preserved the elements of our discipline – particularly attention to valuations and market internals – that were essential in navigating previous complete market cycles, and remain so today. All the Hussman Funds are intended to outperform their respective benchmarks over time, with smaller interim losses than passive investment approaches. As we regularly observed in previous market cycles, and have increasingly observed in recent years, I am pleased to report that for the year ended December 31, 2022, our discipline performed “as intended.”
As always, I remain grateful for your trust.
Sincerely,
John P. Hussman, Ph.D.
Past performance is not predictive of future performance. There is no assurance that the Hussman Funds will achieve their investment objectives. Investment results and principal value will fluctuate so that shares of the Funds, when redeemed, may be worth more or less than their original cost. It is possible to lose money when investing in securities. Current performance may be higher or lower than the performance data quoted.
An investor should consider the investment objectives, risks, charges and expenses of the Funds carefully before investing. The Funds’ prospectuses contain this and other important information. To obtain a copy of the Hussman Funds’ prospectuses please visit our website at www.hussmanfunds.com or call 1-800-487-7626 and a copy will be sent to you free of charge. Please read the prospectus carefully before you invest. The Hussman Funds are distributed by Ultimus Fund Distributors, LLC.
The securities in which the Funds invest, as well as the risks associated with these securities and with the investment programs of the Funds, are described in each Fund’s Prospectus. Among these risks are those associated with investments in derivative instruments, investments in shares of money market funds, concentration of investments within a particular business sector and, in the case of Hussman Strategic International Fund, investments in foreign securities.
Periodic updates regarding market conditions and investment strategy, as well as special reports, analysis, and performance data current to the most recent month end, are available at the Hussman Funds website www.hussmanfunds.com.
Estimates of prospective return and risk for equities, bonds and other financial markets are forward-looking statements based the analysis and reasonable beliefs of Hussman Strategic Advisors (the “Adviser”), which serves as the investment adviser of the Funds. They are not a guarantee of future performance and are not indicative of the prospective returns of any of the Hussman Funds. Actual returns may differ substantially from the estimates provided. Estimates of prospective long-term returns for the S&P 500 reflect valuation methods focusing on the relationship between current market prices and earnings, dividends and other fundamentals, adjusted for variability over the economic cycle.
This Letter to Shareholders seeks to describe some of the Adviser’s current opinions and views of the financial markets. Although the Adviser believes it has a reasonable basis for the opinions or views expressed, actual results may differ, sometimes significantly so, from those expected or expressed. The securities held by the Funds that are discussed in this Letter to Shareholders were held during the period covered by this Report. They do not comprise the entire investment portfolios of the Funds, may be sold at any time and may no longer be held by the Funds. The opinions of the Adviser with respect to those securities may change at any time.
16500952-UFD-2/28/2023
Keep Me Informed
Please enter your email address to be notified of new content, including market commentary and special updates.
Thank you for your interest in the Hussman Funds.
100% Spam-free. No list sharing. No solicitations. Opt-out anytime with one click.
By submitting this form, you consent to receive news and commentary, at no cost, from Hussman Strategic Advisors, News & Commentary, Cincinnati OH, 45246. https://www.hussmanfunds.com. You can revoke your consent to receive emails at any time by clicking the unsubscribe link at the bottom of every email. Emails are serviced by Constant Contact.
The foregoing comments represent the general investment analysis and economic views of the Advisor, and are provided solely for the purpose of information, instruction and discourse.
Prospectuses for the Hussman Strategic Growth Fund, the Hussman Strategic Total Return Fund, the Hussman Strategic International Fund, and the Hussman Strategic Allocation Fund, as well as Fund reports and other information, are available by clicking “The Funds” menu button from any page of this website.
Estimates of prospective return and risk for equities, bonds, and other financial markets are forward-looking statements based the analysis and reasonable beliefs of Hussman Strategic Advisors. They are not a guarantee of future performance, and are not indicative of the prospective returns of any of the Hussman Funds. Actual returns may differ substantially from the estimates provided. Estimates of prospective long-term returns for the S&P 500 reflect our standard valuation methodology, focusing on the relationship between current market prices and earnings, dividends and other fundamentals, adjusted for variability over the economic cycle. Further details relating to MarketCap/GVA (the ratio of nonfinancial market capitalization to gross-value added, including estimated foreign revenues) and our Margin-Adjusted P/E (MAPE) can be found in the Market Comment Archive under the Knowledge Center tab of this website. MarketCap/GVA: Hussman 05/18/15. MAPE: Hussman 05/05/14, Hussman 09/04/17.