

Collision Course: Monetary Tightening Meets an Easy Money Bubble


Bill Hester, CFA
Senior Research Analyst
Hussman Strategic Advisors
December 2021
Whether investors are ready or not, global monetary tightening cycles are fast approaching. The Reserve Bank of New Zealand raised its short-term rate twice in the last two months. Norway’s central bank raised its target rate back in September. The Bank of Canada is warning investors that it is speeding up its timetable for monetary tightening. More than half of emerging market central banks are already raising interest rates.
Here in the U.S., pressure is building for the Federal Reserve to taper its asset purchases more quickly. Jerome Powell, fresh off a nomination for a second four-year term as chair, and Lael Brainard, who was elevated to be vice chair, will be tasked to navigate higher inflation amid a tightening labor market.
Two points are worth highlighting following the nomination announcement. The first is that, considering how narrow the race seemed to be between Powell and Brainard, it seems likely that they will work together closely in guiding the direction of monetary policy over the next couple of years, maybe even more so than recent chairs and vice chairs. The second is that this next term may be very different than the last.
For Powell, the economic backdrop is starting out very different than his first term. With inflation mostly moderate during his entire time on the Board of Governors (an average of just 1.5% through the end of last year), Powell has been able to frame monetary policy in terms of “supporting” the labor market and “achieving the goal” of 2% inflation. With prices rising 6.8% year-over-year in November, that’s changed.
On the inflation side of the mandate, broad set of indicators show that trends have mostly worsened these last few months. Inflation has likely been a surprise to the more dovish members of the Federal Open Market Committee (FOMC), who noted back at the November 3rd policy meeting that the worst readings might have already passed and that forces were already in motion to bring inflation back to 2 percent over the medium term, according to recently released meeting minutes.
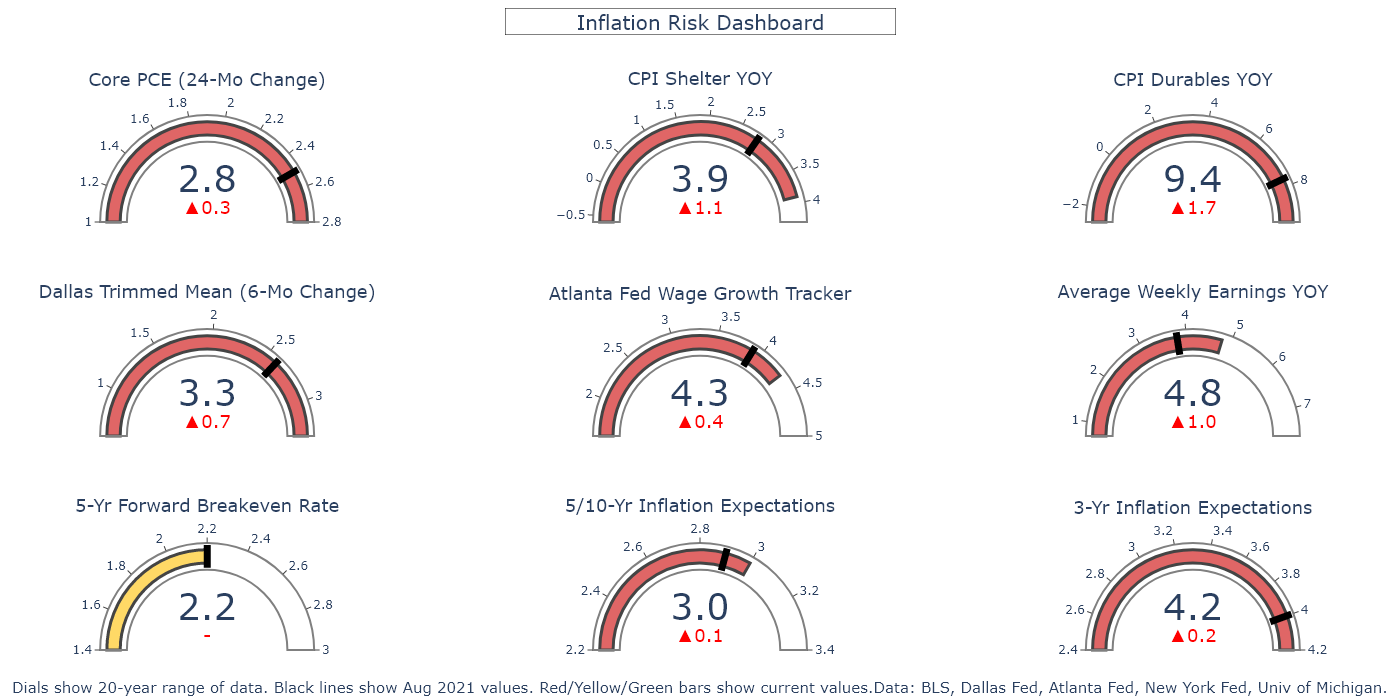
Is there a good way to gauge the level of concern held by Powell and other FOMC members about inflation over the next few months? Based on a speech this summer from Powell, and two more from Brainard, a set of observable indicators is available that offer a sense of how concerned they may be about continuing inflation risks. These indicators mostly fall into three categories – various measures of consumer inflation, wage trends, and inflation expectations. The indicators include ones they specifically mentioned or that capture an area of their concern. The range in each dial below is determined by the boundaries of the data over the last 20 years. A fully-shaded dial means that the current value is at a 20-year high.
The black lines show where the data were back in August, about the time the speeches took place. Dials are shaded by color depending on where current values are relative to August. The 5-Yr Forward Breakeven Rate is roughly at the same level as it was in August, so it’s shaded yellow. All of the other metrics, which have drifted higher to various degrees, are shaded red. When taken together, these gauges suggest that inflation concerns have probably risen for Powell, and help explain his change of tone last week in front of the Senate Banking Committee, where he suggested that a faster tapering of asset purchases will be discussed at the December FOMC meeting.
On the employment side, the biggest question board members will wrestle with over the next few meetings is whether the level of maximum employment has changed as a result of the pandemic. Brainard’s most recent comments on the subject suggest she still feels that the labor force can return to its pre-pandemic levels. But Powell may be beginning to lose confidence in this argument. “There’s room for a whole lot of humility here as we try to think about what maximum employment would be,” Powell said at last month’s policy meeting.
One position that Powell may evolve toward communicating next year is that taking measured steps toward withdrawing extraordinary, pandemic-related monetary policy doesn’t necessarily mean the end of improving labor markets. The last expansion supports this idea. With inflation gaining ground in late 2015 and climbing to nearly 3 percent in 2017, the Fed slowly raised rates. This occurred even though the unemployment rate was still above its level that would have been considered a full recovery.
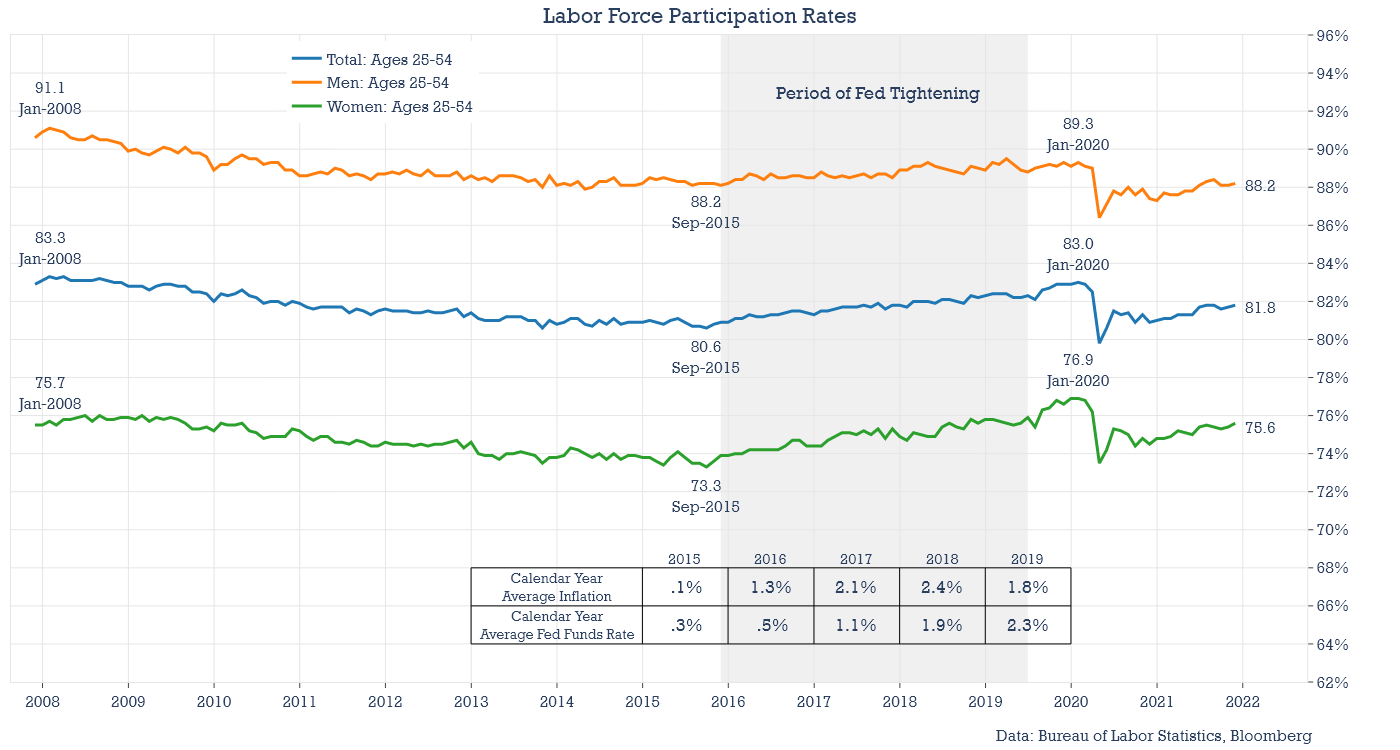
At the time of the first Fed Funds rate increase in 2015, the unemployment rate was 5 percent (it’s currently 4.2 percent). By 2019, inflation moderated, falling below 2 percent, and the labor market would continue to grow. Prime age (25-54) labor force participation rates (the share of the population that is either working or are unemployed but actively looking for work) rose 2.4 percentage points during this time. The participation rate for women rose from 73 percent to just shy of 77 percent in a little over four years. So, during this period – when the Fed Funds Rate was increased by 225 basis points – inflation moderated and the labor market tightened. To argue that “any amount of tightening” would stop the current labor market recovery in its tracks doesn’t conform to even the most recent cycle.
Looking through the list of metrics in the dashboard above, there are probably two indicators worth following closely over the next few months. The first is the shelter costs component of the CPI. It makes up about a third of the overall CPI and it has a positive (but lagged) correlation with home prices, which have been rising at a rate of about 20 percent annually according to the S&P Case-Shiller Home Price Index. Among the indicators above, shelter inflation is already a component that has drifted higher relative to the summer when compared with the other measures. Because the trend in rising home prices hasn’t yet broken, shelter costs are very likely to head higher over the next few months.
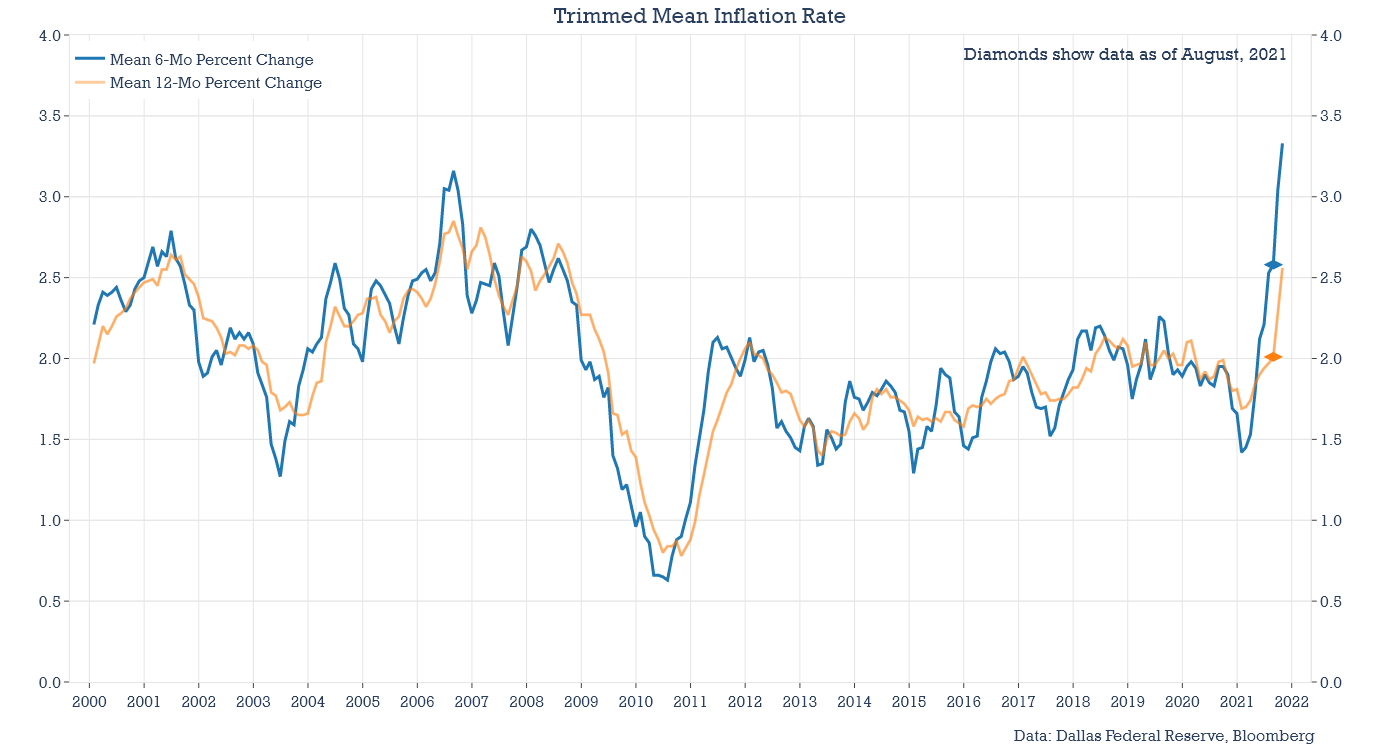
A second indicator to monitor is the change in the trimmed average inflation rate, which is an index calculated by the Dallas Federal Reserve. It attempts to be less influenced by the volatility in price changes that have occurred in pandemic-related areas like used cars, airfares, and dining costs. The chart below shows what the average 6-month and 12-month inflation rates within the Personal Consumption Expenditures Index look like.
Exceptions to the Brainard Principle
The biggest risk to the financial markets and also to the recovery in labor markets is probably what Chairman Powell once described as exceptions to the Brainard Principle. In this case, he wasn’t referring to soon-to-be vice chair Lael Brainard. He was instead commenting on the work of Yale economist Bill Brainard, who once suggested that the more uncertain a policy maker is about the impact of a change in policy, then the more incrementally they should move. Former ECB president Mario Draghi, once explained how he thought about this principle by remarking, “in a dark room you move with tiny steps.”
But in a 2018 speech, prior to both the pandemic and this year’s large jump in inflation, Powell noted that there are two important exceptions to the Brainard Principle. Powell said:
Two particularly important cases in which doing too little comes with higher costs than doing too much. The first case is when attempting to avoid severely adverse events such as a financial crisis or an extended period with interest rates at the effective lower bound. In such situations, the famous words ‘We will do whatever it takes’ will likely be more effective than ‘We will take cautious steps toward doing whatever it takes.’ The second case is when inflation expectations threaten to become unanchored. If expectations were to begin to drift, the reality or expectation of a weak initial response could exacerbate the problem. I am confident that the FOMC would resolutely ‘do whatever it takes’ should inflation expectations drift materially up or down or should crisis again threaten.
– Jerome Powell, Federal Reserve Chairman, 2018
This exception to the Brainard Principle is an important and often overlooked concept because the Federal Reserve has held such a strongly dovish stance the last couple of years. With three decades of declining rates of inflation in the books, who could blame them? – provided one was willing to ignore risks like financial instability, speculative bubbles, and subsequent crises. For 25 years, financial markets have experienced Do Whatever It Takes monetary policy, particularly when the economy has been running below full-employment. This has created a series of asymmetric policy responses that investors have become comfortable with and dependent on. A Do Whatever It Takes response to fight higher inflation would be an extremely unfamiliar world for financial markets to live in.
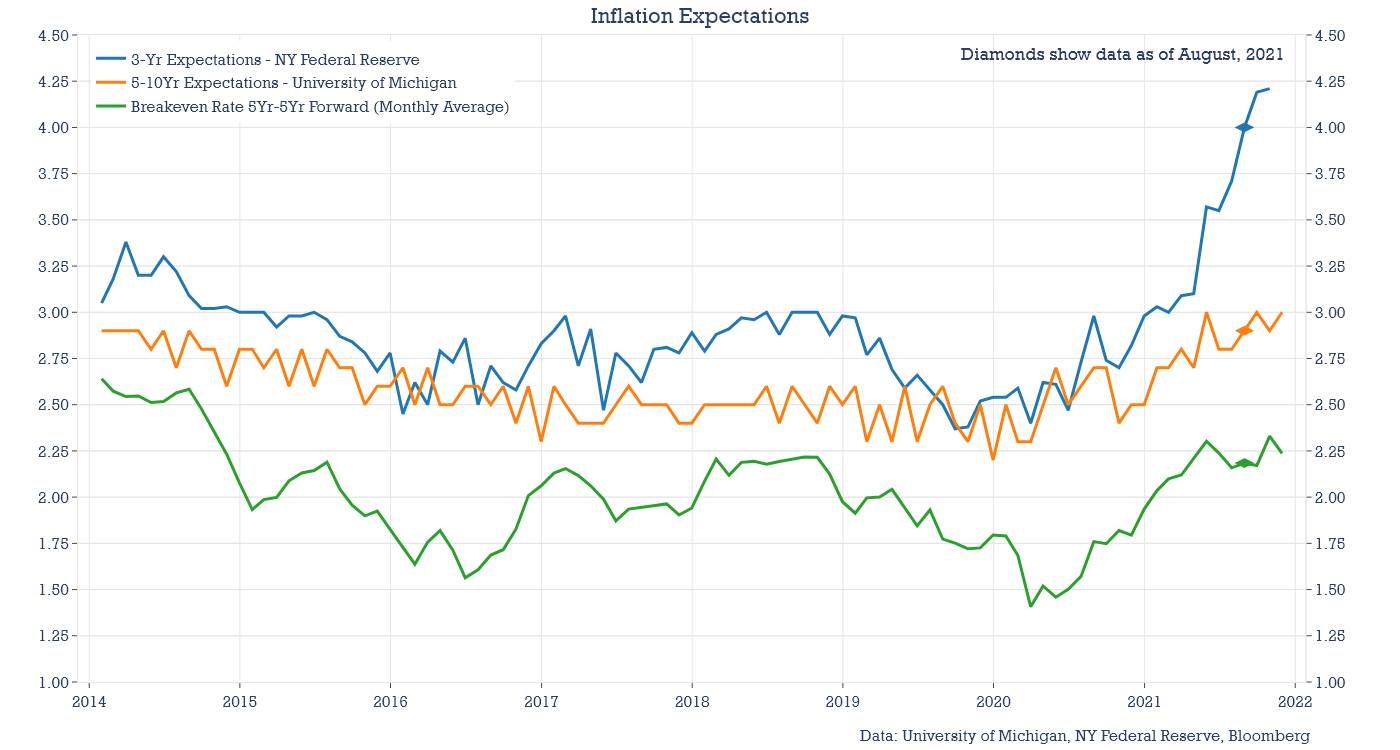
The mention of inflation expectations is important here too. Powell mentioned them again in his Jackson Hole Speech this year. And Brainard also mentioned them in two separate speeches over the summer, commenting that she was “particularly attentive” to them. Probably the three best measures of longer-term inflation expectations come from two separate surveys and a market-based expectation. The first is the University of Michigan question about expected inflation over a 5 to 10-year period. The second is a consumer survey from the NY Federal Reserve which includes a question about expectations for inflation in three years. Fed Board members also frequently quote a break-even inflation rate calculated using ordinary and inflation-protected Treasury bond yields, which is used as an expectation for inflation over the five-year period beginning in five years.
All three metrics have been trending higher, but the moves in 5 to 10-year inflation expectations and break-even rates have been modest. Interestingly, 3-year inflation expectations have popped higher the last few months. If either of the other measures move higher over the next few months, joining this index, it would undoubtedly put more pressure on the Federal Reserve to change its timetable for withdrawing its emergency-related monetary easing.
Where rates would need to go in a rush
What level of interest rates would the Federal Reserve need to target if inflation expectations became more embedded in consumer attitudes over the next year? What might the rate path look like under a Do Whatever It Takes inflation-fighting policy regime?
There are several models that we can use to estimate where short-term rates should be pegged at considering the amount of slack in the labor force and the level of inflation. These rules-based formulas have been kicked to the curb these last few years. Monetary policy has essentially become activist and fully discretionary. Even prior to the pandemic, rates were held far below rules-based estimates. And last year the Federal Reserve introduced a new framework which both allows for missing inflation targets to the upside (without explicit guidelines for how long), and expands the number of measures used to gauge the tightness of the labor market. These changes will introduce additional discretion in setting policy across the entire business cycle.
The high level of rates suggested by rules-based formulas may be surprising. And they’re unlikely to be reached if the Federal Reserve continues to look past inflation risks, while focusing mostly on the labor market. But if at some point, the FOMC’s perspective shifts on inflation risks, and in Powell’s words “doing too little comes with higher costs than doing too much”, it’s worth keeping these rules-based estimates in mind.
The most influential of these is the Taylor Rule. It suggests an overnight rate based on how far growth and inflation have veered from their targets. If both are at their targets, the Fed Funds rate should be set at the neutral rate plus inflation. But if inflation is above its target, or unemployment is below its target, then rates should be increased to guide those metrics back to their target levels. The same goes for when these targets are missed in the opposite direction, but in this case, rates would be lowered.
There have been many different versions of the Taylor Rule, first created by Stanford University’s John Taylor almost 30 years ago. Below is a version that targets inflation and the unemployment rate:
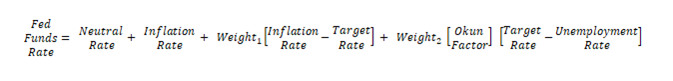
In the formula above, the neutral rate is the real interest rate consistent with an economy at full employment with moderate inflation. Weight1 and Weight2 measure the relative importance of missing either the inflation target (typically considered to be 2%) or the unemployment rate target (based on the concept of NAIRU, or the non-accelerating inflation rate of unemployment). The original rule weighted deviations from the two targets equally, but more recent versions of the rule, preferred by Janet Yellen and Ben Bernanke, double the importance of the labor shortfall relative to overshooting inflation. The remaining parameter in the formula is the Okun Factor, a byproduct of Okun’s Law, which captures the tight correlation between growth in GDP and the unemployment rate. More labor is typically needed to produce more goods. The original Taylor Rule used the distance between actual GDP and potential GDP to measure slack in the economy. The Okun Factor allows us to use the unemployment rate to measure this slack while staying true to the original concept of the rule.
There are both benefits and drawbacks to the Taylor Rule. One benefit is its simplicity. It relies on just two major economic measures: inflation and economic slack. A drawback is that the inputs to the model are open to interpretation and debate. Studying the debates that have taken place over the last two decades surrounding Taylor Rule inputs could make for its own college degree. All of the recent Federal Reserve chairs have entered into this debate. Ben Bernanke suggested that forecasted values for inflation and growth should be used, instead of 4-quarter trailing results, as the rule originally suggested. Janet Yellen argued that a neutral rate of 2 percent is too high in the modern economy. And Jerome Powell suggested that both the neutral interest rate and the natural rate of unemployment can change over time, making these types of models difficult to use in real time.
Taylor himself observed that policy makers should consider a broad range of additional variables. He has also been open to the many variations of his original model. Taylor’s critique of the Federal Reserve has always been rooted in the idea that policy should be predictable and accountable. He intended the Taylor Rule as a “hypothetical but representative policy rule” that could be used an objective guideline, and a benchmark to limit excessive discretion.
Much of the progress in medicine over the years has been due to doctors using checklists. Experience shows that checklists are invaluable for preventing mistakes, getting good diagnoses and appropriate treatments. Of course doctors need to exercise judgement in implementing checklists, but if they start winging it or skipping steps the patients usually suffer. Checklist-free medicine is as bad as rules-free monetary policy.
– John B. Taylor, Stanford University, A Monetary Policy for the Future, 2015
If the average rate suggested by the Taylor Rule was only 25 or 50 basis points higher than the current overnight rate, it would be an open question whether the Fed was operating based on “rules” or based on “discretion.” Yet despite evidence that deviating from rules-based monetary policy encourages financial speculation, with little impact on real economic activity, there’s currently an enormous gap between the current Federal Funds Rate and the implied rates from these models. This gap provides a measure of how far current interest rates are from the path that might be expected under a Do Whatever It Takes policy focused on containing inflation risks.
The graph below estimates Taylor Rule-implied rates based on various forecasts for inflation. The target parameters lean to the dovish side (a natural real interest rate of 1 percent and a NAIRU of 4 percent), meaning they will suggest lower interest rates than typical Taylor Rule inputs would. Four different measures of inflation are used, including headline and core CPI, and headline and core PCE (from the Personal Consumption Expenditures Price index). All the forecasts come from the recently released Survey of Professional Forecasters, published by the Philadelphia Federal Reserve.
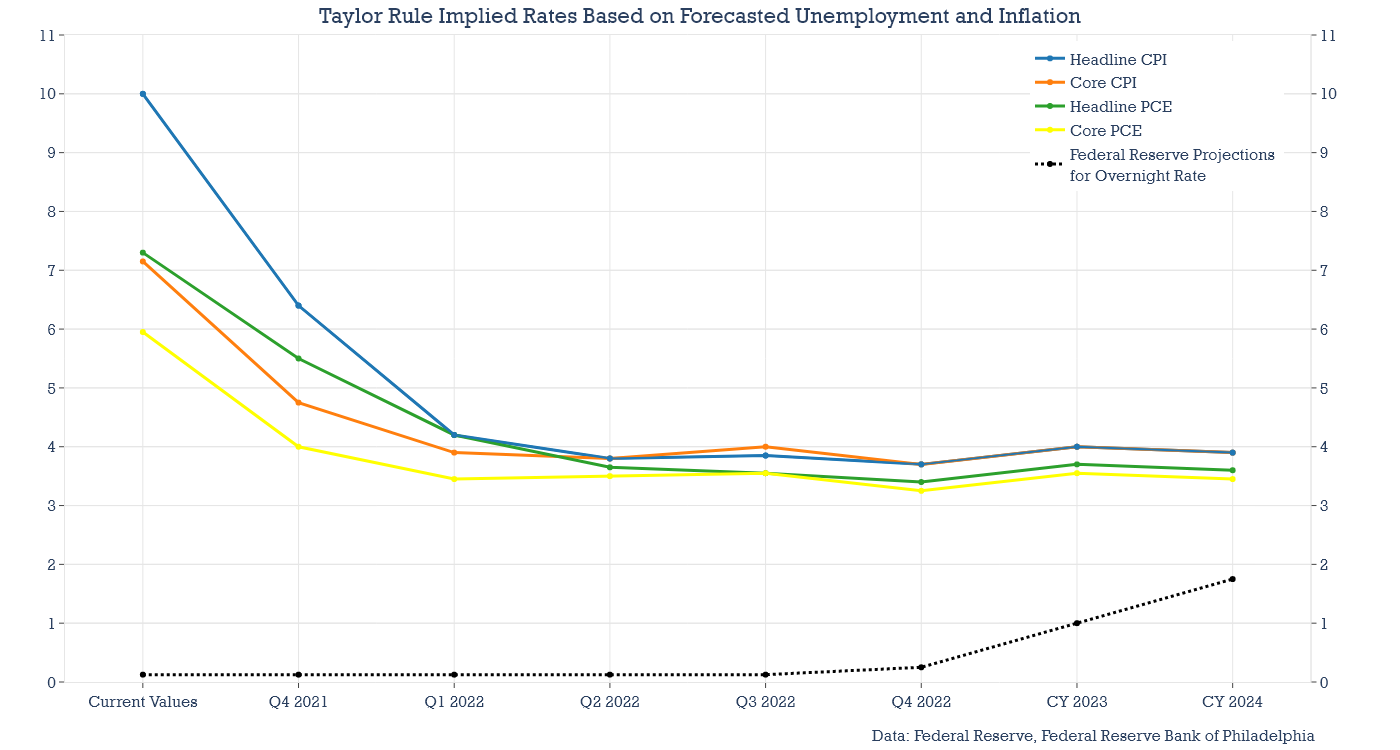
The implied rates all sit between 3 and 4 percent for the end of next year and the following two calendar years. If these forecasts are generally correct, next year will be a period where the spread between suggested rates and overnight rates will be the most glaringly off course. The current deviation may continue to be overlooked, because we’re still within a window where inflation might be considered transitory. But as we move further from the recession, and the immediate recovery, any further divergences between implied rates and actual rates may become a larger focus.
It may be difficult for investors to imagine overnight rates getting anywhere close to 3 percent next year. But one thing the investment profession should have learned this year is that it is extremely difficult to forecast inflation over short periods of time. It may be best to at least allow for a scenario where the Federal Reserve is faced with a rise in consumer inflation expectations, and inflation itself, that is not transitory. If so, an adjustment in interest rates to these levels is what an inflation-focused Do Whatever It Takes policy might look like.
The order of global monetary tightening cycles
Using rules-based guidelines to estimate interest rates can be helpful in another way too. These estimates are currently doing a good job of ranking Global Central Bank angst.
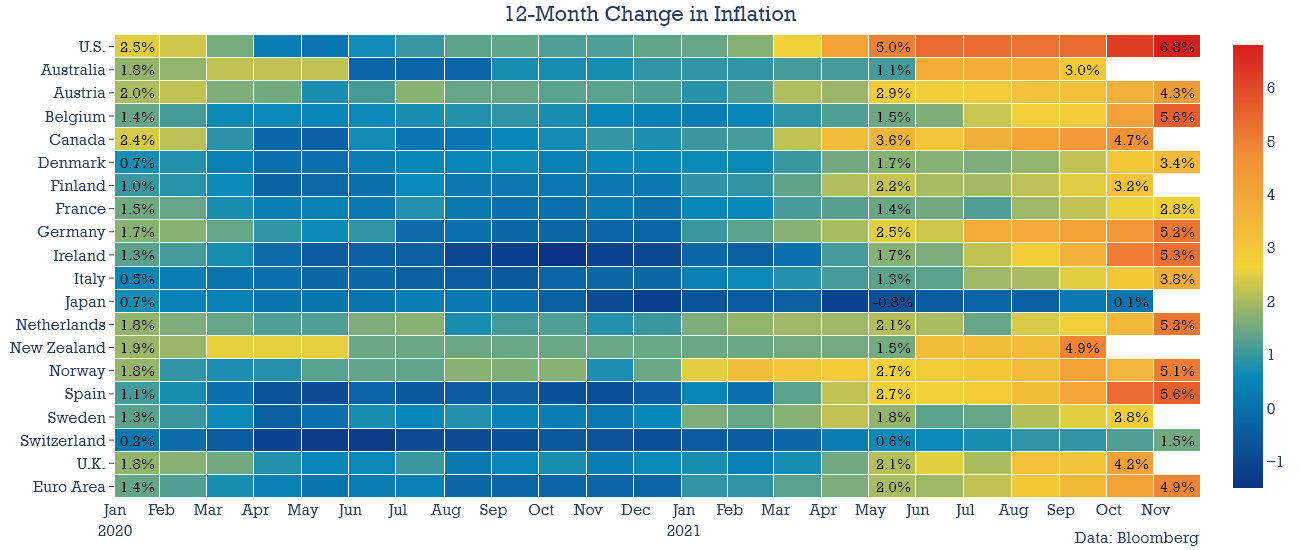
Two points can be made about this year’s inflation trends. The first is that while rising prices started in the U.S., the trend has gone global. Even Japan may end up seeing (mildly) elevated consumer prices. Its measure of producer prices hit a 40 -year high last month. The chart below shows this broadening of inflation. The chart presents a heat map of global inflation rates, month-by-month, since January 2020.
U.S. inflation is currently 6.8%, the highest rate in the developed world. But inflation has risen above 5 percent in six countries (including Germany, Ireland, and Spain) and four other countries are now seeing price increases of between 4 and 5 percent (including Canada, New Zealand and the U.K.). November inflation in the euro area surged to a record 4.9 percent, exceeding all forecasts for the measure.
This broadening of global inflation is important. As Larry Summers has recently pointed out, the backdrop of global disinflation was a key argument Jerome Powell made earlier this year to support the idea that U.S. inflation would be transitory. Broadening global inflation also weakens the argument that inflation would be unique to the U.S. because of the way the Covid-related fiscal packages were designed (the size and structure of the packages) and also U.S.-focused supply chain issues. (The differences in the size and structure of pandemic responses globally probably do help explain why inflation rates in the U.S. are the highest among developed countries).
The second point is that the level and the persistence of inflation globally has surprised just about everyone. Here’s a tally of inflation surprises (actual inflation relative to consensus forecasts) for a wide number of developed economies. It’s been quite the year for inflation surprises.
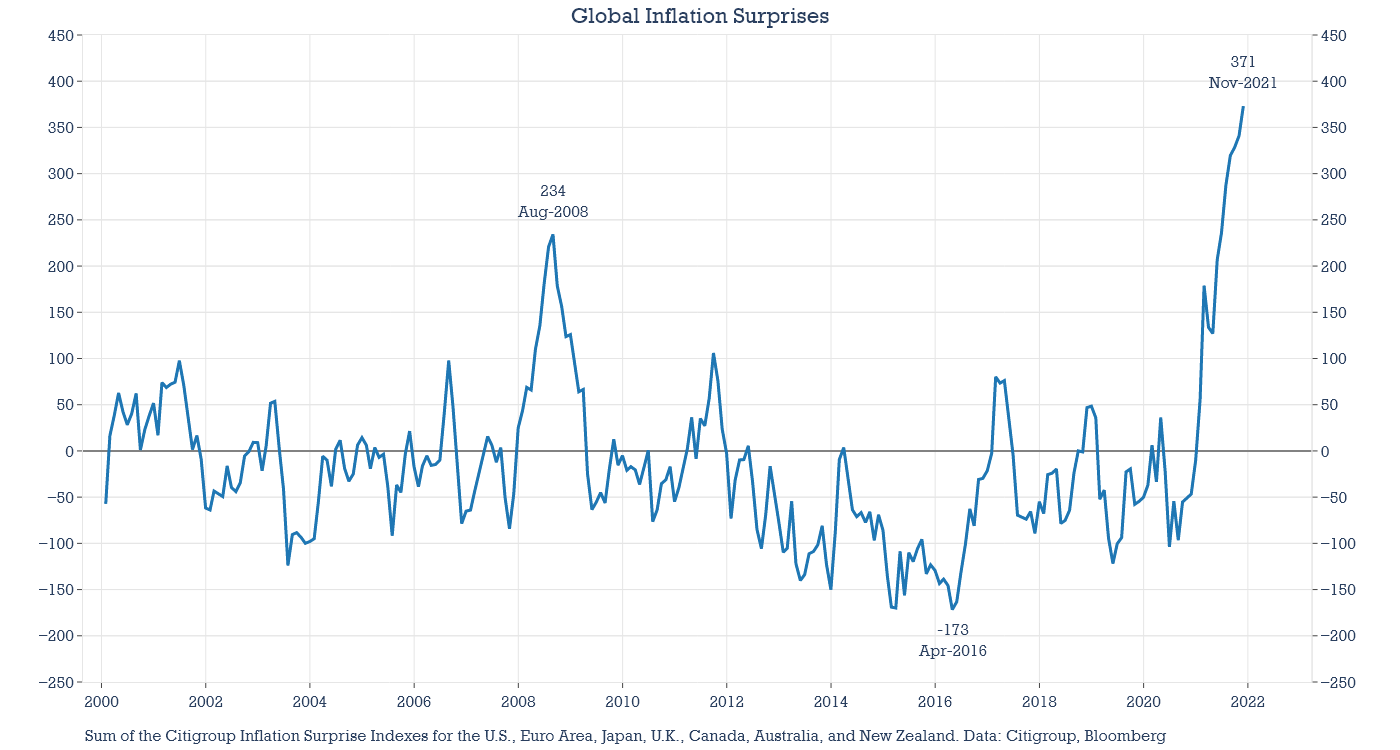
The line above captures the recent consensus track record that includes just about every working financial economist in the world, and it’s humbling. And we should keep this year’s miss in mind when we look at forecasts for next year. But forecasts for inflation next year are still important because they highlight a predicament faced by most central banks. Intermediate-term forecasts for inflation aren’t moderating. In many places, they’re rising. Each box below shows the consensus forecast for the rate of inflation that is expected during the final quarter of 2022, according to Bloomberg surveys. The first column shows the consensus forecast in mid-August, with each column showing how expectations have evolved week-by-week. The last column is the most recent survey. Expectations for medium-term inflation have picked up most noticeably over the last six weeks.
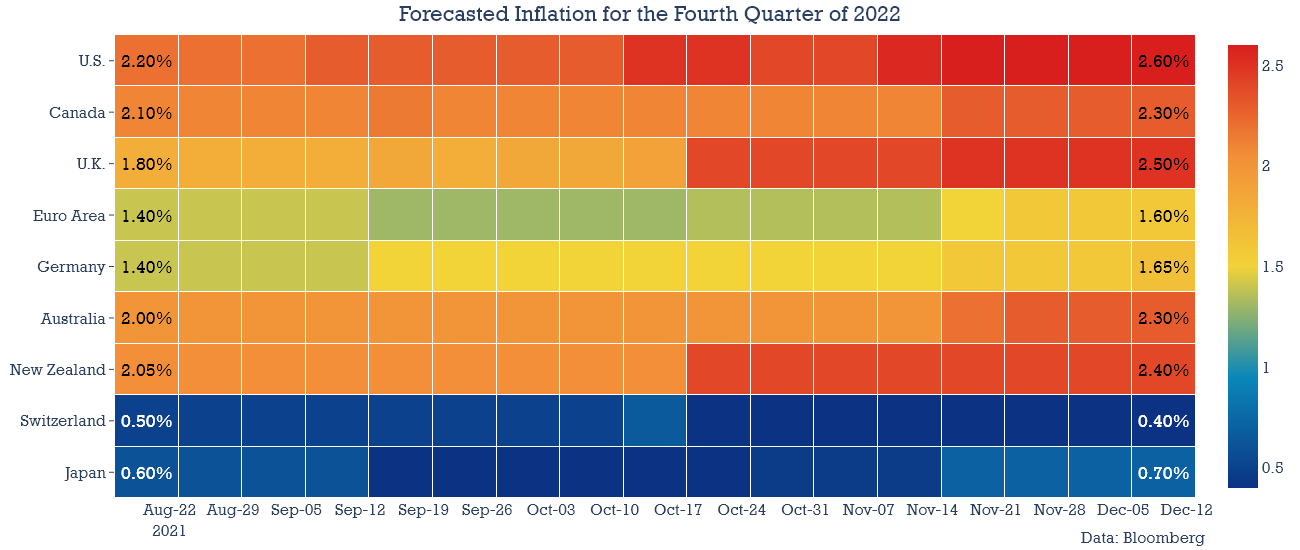
As in the U.S., the level of interest rates suggested by rules-based guidelines has been mostly ignored by global central banks in the last few years. Almost universally, rates have been kept lower than the Taylor Rule had suggested. Again, it’s difficult to imagine overnight rates reaching levels suggested by these objective, rules-based guidelines without a complete change in mindset regarding inflation risks. But an interesting aspect of applying these feedback models globally is that they offer a sense of central bank discomfort with the level where monetary policy is calibrated. The chart below calculates a set of implied overnight interest rates for each country. The red dots show the implied overnight rate using both Core and All-Items inflation measures for each country or region. The orange dot calculates an implied rate using forecasts for inflation and unemployment for the fourth quarter of 2022. The blue dots show the current overnight rate.
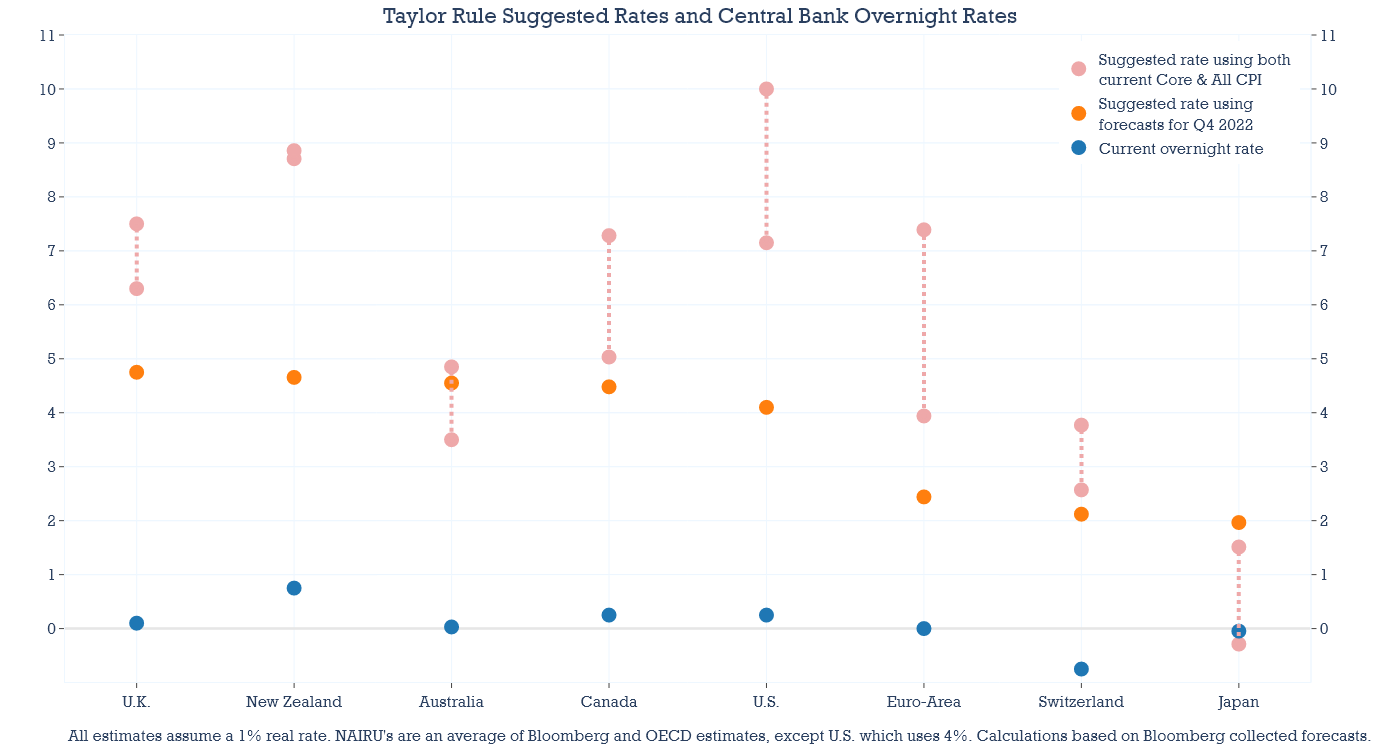
The spread between implied rates and overnight rates turns out to be a capable tool to measure the amount of pressure each central bank has apparently felt to change the pace of their monetary policies. Starting from the left, the Bank of England is expected to tighten policy at one of its next two meetings. The Reserve Bank of New Zealand raised rates twice already. More rate increases are expected over the next few months. The Bank of Canada is already tapering its asset purchases, and policy makers there have suggested that the timetable for raising rates is shortening. On the other side of the spectrum, the Bank of Japan and the European Central Bank will probably be one of the last central banks to tighten policy, based on historical precedent and recent communications.
The overall message from applying these models globally is that more dispersion across countries in the path toward tighter monetary policies should be expected, compared with the simultaneous easing that was seen at the start of the 2020 global recession.
Global monetary tightening cycles are beginning amid record valuations
A global monetary tightening cycle may end up highlighting one of the weaknesses of purely discretionary policy: investors have no observable policy guideline to anchor their expectations. Without that, investors are left with only communication from Central Banks. This can be confusing because board members are rarely in complete agreement, creating the risk of mixed messages. Views also change over time, as they should, but communicating these changes is a delicate matter when policies are already highly discretionary. For example, Bank of Canada Governor Tiff Macklem recently added a twist to the way he communicates about inflation, following persistent upward surprises. Last month, Macklem said that inflation in Canada is “transitory, but not short lived”. Those subtle shifts in central bank language make uncertain policy statements become even more subject to interpretation.
We’re already seeing a pickup in financial market volatility when Central Banks mis-telegraph their intentions. The Bank of England surprised investors by keeping rates on hold last month, after leading them to believe the first increase in rates was coming. The pound fell by more than a percent the day of the announcement. The Reserve Bank of Australia abandoned its policy of yield curve control before officially announcing the decision, which led to the biggest increase in short-term yields in more than 25 years, according to Bloomberg.
The greatest volatility could eventually happen in global equity markets. This is because a global monetary tightening cycle today would begin at record valuations in many countries. In some cases, price-to-sales ratios will be double the levels where prior tightening cycles have begun. To put the level of valuations into perspective, the chart below shows price-to-sales ratios for the MSCI U.S., World, and EAFE indexes.

The arrows in the chart above show where prior tightening cycles began in the U.S., including a series of rate increases beginning in 1999, 2004, and 2015. The current point also shows an arrow for the purpose of illustration, even though the Federal Reserve has only announced a tapering of its bond purchases for now. Yet even here, valuations are more than 50 percent higher than the valuation levels where prior tightening cycles began.
Price-to-sales-ratios are presented in the above chart, not only because of their strong correlation with actual subsequent market returns, but also because valuation estimates that are based on next year’s expected earnings may be particularly risky at this point. Profit margins currently estimated by Wall Street are a sight to behold. Global companies everywhere are projected to become even more profitable next year. In Europe, margins are projected to come in at about 80 percent above long-term levels. Canadian corporations are expected to report profit margins double long-term levels. If these profit margin forecasts don’t pan out, price-to-forward earnings ratios are strongly understated.
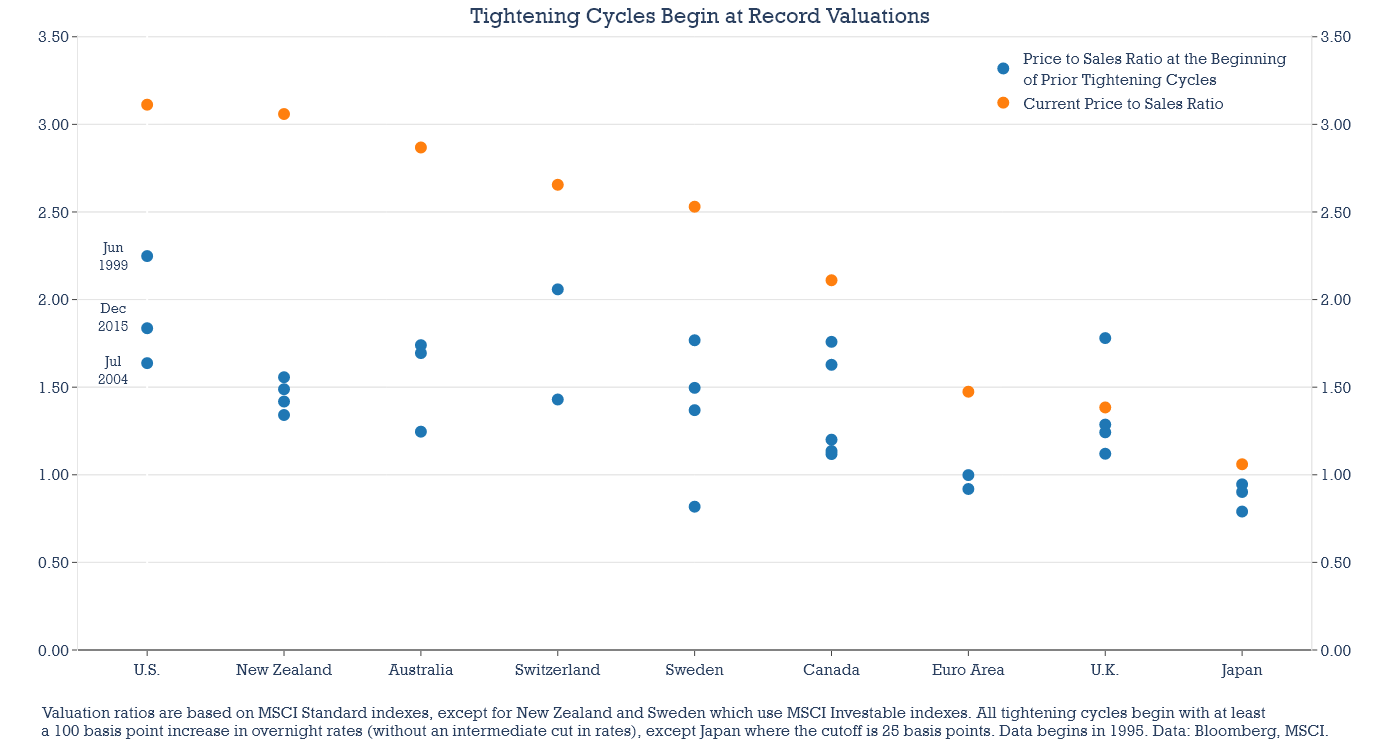
How do current valuations relative to prior tightening cycle start dates compare globally? Mostly the same. The chart below presents the current price-to-sales ratio for each country or region, comparing the current valuation levels with the levels that prevailed at the beginning of prior cycles. The starting dates for U.S. tightening cycles are labeled. But each central bank has its own tightening cycles, with different starting dates for each cycle. But the message is broadly the same: a global tightening cycle here would start amid record valuation levels relative to prior tightening cycles.
It’s a fascinating set of conditions. As central banks have shifted to almost purely discretionary monetary policies, investors have lost the anchor of observable economic data. Rising rates of inflation are already more persistent than nearly anyone would have guessed six months ago, and the first global monetary tightening cycle in more than five years is likely to begin, amid record market valuations. It seems unlikely that overnight interest rates in the U.S. could hit 3 percent next year. But that thinking is also rooted in a Do Whatever It Takes monetary policy that has been directed almost exclusively toward employment goals. It’s been a long time since investors had to withstand Do Whatever It Takes monetary policy directed at containing inflation. When they last did, markets weren’t nearly as expensive as they are today.
Keep Me Informed
Please enter your email address to be notified of new content, including market commentary and special updates.
Thank you for your interest in the Hussman Funds.
100% Spam-free. No list sharing. No solicitations. Opt-out anytime with one click.
By submitting this form, you consent to receive news and commentary, at no cost, from Hussman Strategic Advisors, News & Commentary, Cincinnati OH, 45246. https://www.hussmanfunds.com. You can revoke your consent to receive emails at any time by clicking the unsubscribe link at the bottom of every email. Emails are serviced by Constant Contact.
The foregoing comments represent the general investment analysis and economic views of the Advisor, and are provided solely for the purpose of information, instruction and discourse.
Prospectuses for the Hussman Strategic Growth Fund, the Hussman Strategic Total Return Fund, the Hussman Strategic International Fund, and the Hussman Strategic Allocation Fund, as well as Fund reports and other information, are available by clicking “The Funds” menu button from any page of this website.
Estimates of prospective return and risk for equities, bonds, and other financial markets are forward-looking statements based the analysis and reasonable beliefs of Hussman Strategic Advisors. They are not a guarantee of future performance, and are not indicative of the prospective returns of any of the Hussman Funds. Actual returns may differ substantially from the estimates provided. Estimates of prospective long-term returns for the S&P 500 reflect our standard valuation methodology, focusing on the relationship between current market prices and earnings, dividends and other fundamentals, adjusted for variability over the economic cycle.