
Price-to-Sales Ratio May Prove Valuable in the Next Profits Recession (Dec 2007 Encore)


William Hester, CFA
Senior Research Analyst
Hussman Strategic Advisors
Reprinted from December 2007
October 2017 Epilogue below by John P. Hussman, Ph.D.
Although the official earnings reporting season ended the week before last, it feels as if the important profits news is just beginning to arrive. This past week Lehman Brothers announced lower earnings, although the results were better than expected. Next week Morgan Stanley and Bear Stearns are expected to announce losses as a result of large write-downs. Goldman Sachs may prove the exception and show earnings gains partly as a result of sidestepping (or hedging) the worst of the collateralized debt that’s been hit so hard. In addition to earnings news last week, the Fed announced a cut in its target rate of 25 basis points.
I could have written that same paragraph exactly three months ago, when during the week of September 17th Lehman Brothers announced a decline in earnings, investors were preparing for bad news from Morgan Stanley and Bear Stearns, and the Fed cut interest rates for the first time. If this set of events can play out almost identically in back-to-back quarters, it’s worth allowing for it to play out in a few more quarters to come.
In fact, that was what Lehman Brothers suggested last week, as executives there forecast that losses on mortgages and collateralized debt securities will probably extend into next year. Lehman’s chief economist suggests that the economy is only half way through the housing shock. More will be learned this week when Morgan Stanley and Bear Stearns announce their results.
It’s certainly possible that bad news from financial firms will continue to be delivered in stages over the next few months, rather than having all their troubles wrapped up by year-end. Recent government-inspired plans increase the probability of a drawn-out adjustment. These include the plan for a Super Fund to buy up securities in structured investment vehicles (SIVs), and the plan to freeze the mortgage rates of certain homeowners. While both plans may postpone some near-term losses, they’ll likely just push eventual write-offs out further. The way to thaw frozen markets for complex securities is to allow for the process of price discovery to take place. The interventions could delay that process. (With Citigroup’s decision on Friday to bail out seven of its SIVs at a cost of more than $50 billion, it looks like the ‘SuperSIV’ planned may be losing steam).
While the potential for home prices to fall further in 2008 and the continued effects of the credit crisis have made their way into economist’s forecasts – Morgan Stanley this week became the first big investment bank to forecast a recession – research analysts have yet to adjust their numbers. Analyst estimates still reflect expected earnings growth of 14 percent next year, according to Bloomberg data.
Earnings risks
A discussion of expected profits and how they relate to market performance should always begin with the caveat that earnings and stock prices are not joined at the hip. There is virtually no historical correlation between changes in year-over-year earnings and stock prices. The main problem is that the prospect for long-term returns hinges on whether the earnings and profit margins used by investors to value stocks are normal and sustainable, or unsustainable. Unless current profit margins can be sustained indefinitely, P/E multiples may turn out to be very unreliable measures of value. In addition, most meaningful profit recessions have been preceded by stock market declines. Lower prices led both of the earnings declines beginning in 1991 and 2001. While the earnings slowdown in 1998 was mild, it was also preceded by a drop of almost 20 percent in the market.
There are two important risks to next year’s expected earnings. One is a recession, which could hit earnings broadly across a wide range of sectors. The second is the possibility that the large losses being experienced by financial firms are only in their early stages. In recent years, financial companies have contributed the largest and fastest growing portion of S&P 500 earnings. The chart below shows the cumulative change in operating earnings for the financial sector versus the cumulative change in S&P operating earnings without the contribution of financials (March 2000 = 1.0). While earnings growth has been broad-based during this profits rebound, larger gains were seen by the financials group, especially in the last few quarters. From 2000 through this year’s second quarter, the cumulative gain in earnings for financial companies was almost 25 percent higher than for the rest of the companies in the index.
Earnings estimates for financial firms have been dropping quickly. The earnings of financial companies may plunge 40 percent this quarter, and by another 10 percent or more during the first two quarters of next year. Higher earnings growth is expected from the Technology and Materials sectors.
Part of the explanation for the fast-paced growth of the financial sector during the last few years was the expansion of profit margins. Essentially, the financials group has required less revenue to contribute the same amount of profit. This is an important point to consider when evaluating next year’s earnings estimates and P/E multiples for the S&P 500. Analysts are forecasting S&P earnings of $91 for next year, according to Bloomberg data. With the S&P at 1467, that’s a forward P/E of 16.1.
We can break the forward P/E ratio down further to see the assumptions that underlie it by writing: P/E = Price/(Sales * Earnings/Sales), which simply says that earnings should equal sales multiplied by the expected profit margin. With analysts expecting S&P 500 revenues to be about $990 next year, the implied profit margin is 9.2 percent ($91/$990).
A 9.2 percent profit margin would not have been an aggressive forecast 3 or 6 months ago. It would have simply reflected recent data. Margins have been climbing since the bottom of the profits recession in 2002. Government data show that corporate profit margins are now 50 percent higher than their 40-year average, with most of the rise taking place in the last 4 years. Financial firms have made an important contribution to this trend. The graph below shows the margins of the S&P 500, with and without the contribution from financial firms. The blue line in the chart below shows the profit margin of the S&P 500 over the last four years, which is when profit margins have moved far above long-term averages. It shows that the profit margin of the largest U.S. stocks moved from below 5 percent in 2003, to 9.2 percent at their peak. The expansion in profit margins was enjoyed by a broad cross-section of companies.
The green line in the chart shows the profit margin of the S&P 500 excluding Financials. It’s clear that without the contribution of the financial sector’s wide profit margins, overall margins for the index wouldn’t be nearly as stretched as they currently are. Margins at financial companies climbed from 14 percent to 20 percent during the period shown.
Over the past 25 years, financial companies have earned a growing share of the total earnings in the U.S. economy, and the wide profit margins of the past few years has exaggerated that effect. At the bottom of the 1982 bear market, profits from the financial industry made up about 10 percent of GDP, while manufacturing earnings contributed more than 40 percent. The most recent data show that manufacturing’s contribution has fallen by half, while the percent of financial profits contributed to GDP has tripled.
The chart above also shows that the contribution from financial earnings to the overall S&P’s margin quickened over the last few quarters, up until the most recent quarter. The red line shows the spread between the two profit margins. Margins in the S&P 500 Ex-Financials had already begun to flatten out in recent quarters, while margins for the financial group continued to increase. With a flat yield curve since 2005 and a U.S. housing market in decline since 2006, it was difficult to explain the level of financial profit margins earlier this year. A bit more light has been shed on the subject since that time.
It will be important to watch the earnings results of the financial sector over the next few months. For next year’s earnings estimates to be met, either the profits of financial firms will need to rebound, or we will have to see major positive surprises in the level of sales earned by other lower margin sectors.
The Price to Sales Ratio
If a profits recession unfolds, and especially if it unfolds in a slow-motion manner, the market’s P/E ratio may turn out to be a poor measure of valuation. Using price/fundamental ratios is a shortcut method for estimating the value of a business, or a whole index full of businesses, in the S&P 500’s case. It works better when the denominator of the equation is relatively stable. Although the prices of publicly traded businesses fluctuate widely, the values of those businesses should move around much less. That’s why when valuing companies Ben Graham instructed his students to use average earnings – over a period of 7-10 years. Average earnings help smooth the ups and downs of the business cycle. And they help put late-stage peak earnings into better context.
P/Es can be poor valuation tools in a typical profits recession, when much of the bad news is delivered over a shorter period of time. The P/E of the S&P 500 looked unfavorably high when it reached 20 in 1991, as profits sunk and stocks were just entering a new bull market. Similarly, at the bottom of the bear market in October 2002, the P/E hit 33, the same level the bear market began at in March 2000. The P/E was still elevated because earnings had dropped by half. Stocks weren’t cheap on a historical basis in October 2002, but they were certainly better values than they were two and half years earlier.
During earnings recessions where bad news trickles out slowly, the risk is that stocks may look attractive before they represent real value. If the S&P were to decline to 1200, with current earnings unchanged, the P/E would be a misleadingly low 14. If earnings were to subsequently fall 30 percent (as John Hussman suggests) the P/E at S&P 1200 would be a misleadingly high 20.
This type of valuation trap wouldn’t be unprecedented. In 1966 earnings that had been propped up by high margins made valuations seem attractive as stock prices dropped. Even though the P/E fell to 14 in August of 1966, the market had registered only half of its eventual 22 percent loss during that period. The market’s decline foreshadowed the drop in earnings to come.
The ratio of price to sales per share may provide some guidance in these instances. It avoids the issue of which earnings measure to use by comparing the index price to the total amount of sales earned by the companies in the index. Sales are restated and written down far less often, so they provide a more stable value in the denominator of the price ratio. The S&P 500’s prices-to-sales ratio is graphed below. Early data (mainly prior to 1970) is fitted based on the historical relationship between S&P 500 revenues and other fundamentals such as dividends, earnings and the revenues of the S&P Industrials (for which longer history is available).
This chart is consistent with the valuation assessment of P/E ratios that are based on peak earnings, multi-year averages of earnings, or earnings that take into account the duration and extent of the earnings cycle. They all show that outside of the late 90’s bubble, stocks are more expensive than they’ve been at any time in history. While current and “forward” P/E ratios are much more popular valuation measures, their reliability hinges on whether the recent record profit margins underlying those earnings will be sustained over time.
Much like P/E ratios, markets have peaked and bottomed at different P/S levels. The table below shows the P/S sales ratio at the major peaks and troughs since 1955 using weekly data. Over the whole period, the median P/S ratio at market peaks has been 1.0. Only in 1998 and 2000 did the P/S ratio peak at a significantly higher level. Similarly, markets have bottomed at a median P/S ratio of .7 over the full period. Only the 1998 and 2003 troughs occurred at P/S ratios higher than 1.0. Even if we assume that the level of 1.0 that formerly marked bull market peaks is now the level that represents market troughs, a price-to-sales ratio of 1.0 has strong historical precedent, especially prior to the most recent decade. A price to sales ratio of 1.0 makes for simple math. The current revenue per share for the S&P 500 is $940; analysts expect that number to rise to $990 next year. The S&P closed at 1467 on Friday.
Attending to the S&P’s price to sales ratio doesn’t allow investors to ignore the profit margin debate. If there has been a permanent upward shift in the level of profitability in the economy, then the S&P 500 should be able to maintain a higher price to sales ratio. Of the ten companies in the S&P 500 with the lowest profit margins, the median P/S ratio is .25. For the most profitable companies it’s over 4. But it’s important to keep in mind that when the market fell to 1.3 times sales during the last bear market, the earnings of financial firms – and their attractive profit margins – held up better than the rest of the market. On a reported basis, the earnings of the S&P ex-Financial group fell by 50 percent, while profits at financial firms fell less than 15 percent, on average. This time it’s the financials that are leading the trend of slowing profit growth, which could pave the way for a lower P/S ratio in the next downturn.
Epilogue and Preview
– John P. Hussman, Ph.D., October 2017
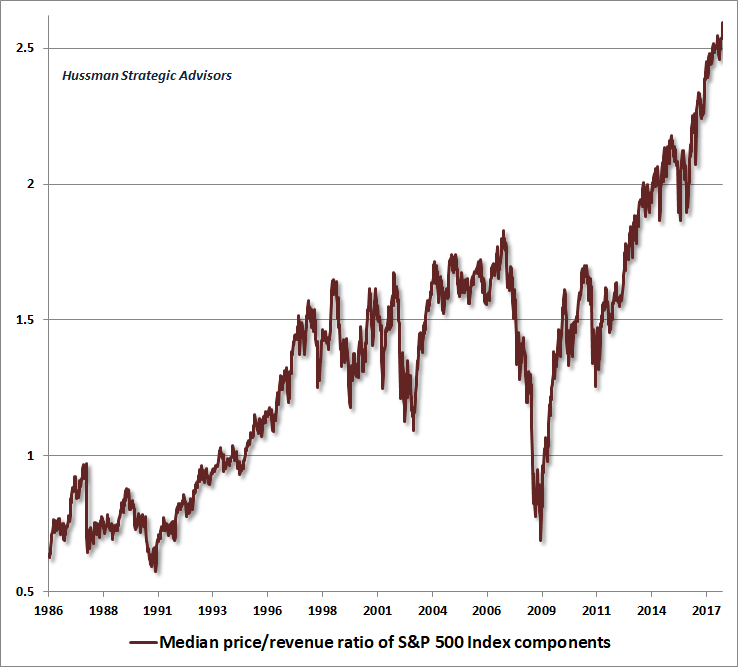
In the 15 months following Bill’s article above, the S&P 500 price/revenue ratio collapsed to 0.66, slightly below its historical norm, as the S&P 500 fell by more than 55% from its October 2007 peak. As of October 2017, encouraged by Fed-sponsored, yield-seeking speculation, the price/revenue ratio of the S&P 500 has climbed to 2.19, the highest extreme in history apart from the level of 2.22 set in the week of March 24, 2000, marking the pre-crash peak of the technology bubble. Similar margin-adjusted measures of valuation have pushed even beyond the 2000 peak, establishing the highest valuation extreme in history on the basis of the measures we find best-correlated with actual subsequent S&P 500 10-12 year total returns, and with the depth of prospective market losses over the completion of prior market cycles across history.
The median price/revenue ratio of S&P 500 component stocks has already reached what is easily the highest level in history, advancing far beyond the levels reached at both the 2000 and 2007 market peaks. The chart below presents valuations as of October 2017 (data: FactSet, Standard & Poors).
This extreme in median valuations may seem strange, given that the overall S&P 500 price/revenue ratio, as of October 2017, was still about 1% below the historic extreme it reached on March 24, 2000, the week of the final high. We can understand the difference between these valuation measures by breaking the component stocks of the S&P 500 into deciles based on their price/revenue ratios. Importantly, being in a high decile doesn’t necessarily imply that a given stock is overvalued, and being in a low decile doesn’t necessarily imply that a given stock is undervalued. For example, technology and medical companies will often dominate high price/revenue deciles, while retail and industrial stocks will often dominate the lower deciles, and it’s not necessarily true that lower deciles perform better than higher deciles, taken as a group. Rather, what matters most for the likely subsequent returns and downside risks of each decile is its level of valuation relative to its own respective history.
The chart below shows the price/revenue ratio of S&P 500 component stocks by deciles.
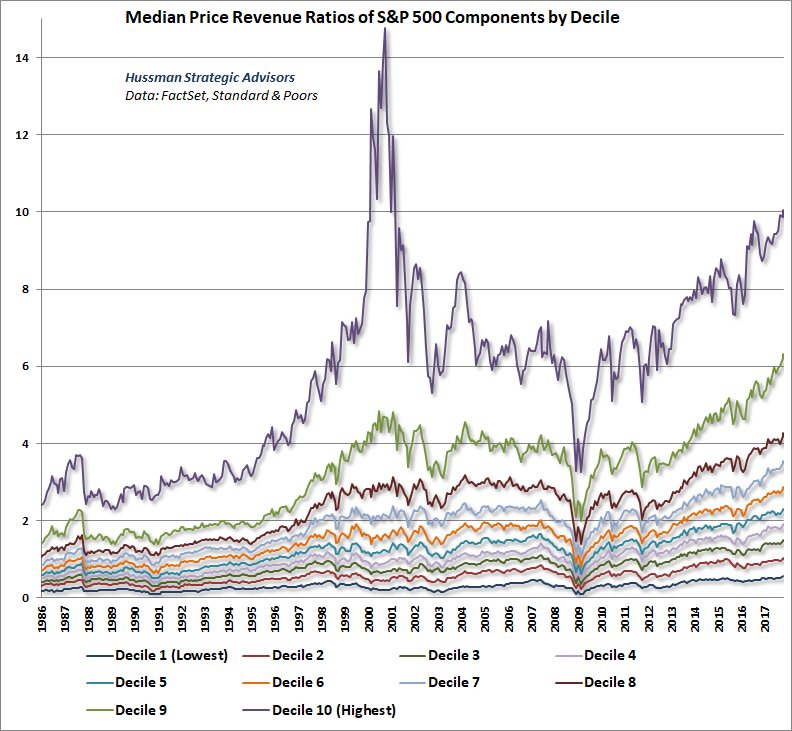
Notice that the distinction between today and the 2000 peak is in the breadth of overvaluation across individual stocks. Back in 2000, the most extreme speculation was centered on a fraction of all stocks, largely representing technology, and accounting for a large proportion of the total market capitalization of the S&P 500 Index.
Look at the valuation of each decile relative to its own history. With the exception of the richest decile of stocks, where median valuations were higher only during the January 2000-March 2001 period (followed by median losses exceeding -80% for those stocks), every decile of S&P 500 components is currently at its most extreme valuation in history.
At the March 2000 bubble peak, an understanding of market history (including the outcomes of prior speculative episodes) enabled my seemingly preposterous but accurate estimate that large-cap technology stocks faced potential losses of approximately -83% over the completion of the market cycle. At the same time, however, the prospective loss for the least expensive half of S&P 500 component stocks was only about -25%. That difference allowed investors to avoid much of the damage from the 2000-2002 market collapse, provided they were not heavily invested in technology stocks, and were willing to deviate considerably from a capitalization-weighted portfolio.
At the 2007 market peak, by contrast, stocks were generally overvalued enough to indicate prospective losses of about -55% for all but the very lowest price/revenue decile. That risk was realized in the form of widespread and indiscriminate losses across all sectors during the market collapse that followed, even though financial stocks were hardest hit. By the 2009 market low, all ten price/revenue deciles ended the cycle at multiples below their respective historical norms.
In our view (supported by a century of market cycles across history), investors are vastly underestimating the prospects for market losses over the completion of this cycle, are overestimating the availability of “safe” stocks or sectors that might avoid the damage, and are overestimating both the likelihood and the need for some recognizable “catalyst” to emerge before severe market losses unfold. We presently estimate median losses of about -63% in S&P 500 component stocks over the completion of the current market cycle. There is not a single decile of stocks for which we expect market losses of less than about -54% over the completion of the current market cycle, and we estimate that the richest deciles could lose about -67% to -69% of their market capitalization. As in 2000 and 2007, investors are mistaking a wildly reckless world for a permanently changed one, and their reeducation in the concept that valuations matter is likely to be predictably brutal.
Keep Me Informed
Please enter your email address to be notified of new content, including market commentary and special updates.
Thank you for your interest in the Hussman Funds.
100% Spam-free. No list sharing. No solicitations. Opt-out anytime with one click.
By submitting this form, you consent to receive news and commentary, at no cost, from Hussman Strategic Advisors, News & Commentary, Cincinnati OH, 45246. https://www.hussmanfunds.com. You can revoke your consent to receive emails at any time by clicking the unsubscribe link at the bottom of every email. Emails are serviced by Constant Contact.