

A Payroll Playbook to Gauge Recession Risk


Bill Hester, CFA, CMT
Senior Research Analyst
Hussman Strategic Advisors
November 2025
With the federal government open after its longest shutdown on record, we will soon get a clear indication of how payrolls fared in September and October. The most recent data, through August, already showed a marked slowdown in job growth, and much of the alternative data released during the shutdown suggests that this weakness has likely continued.
What’s unusual about this shutdown is that, because of when the closure began and how long it lasted, investors could end up getting three payroll reports in rapid succession — including November’s, if it arrives on the first Friday of December as scheduled. That’s a lot of data to absorb over a short period. So, after digesting the headline figures on jobs gained or lost during the shutdown, it will be worth paying close attention to several underlying trends beneath the top-line numbers. The discussion below highlights several of these trends that investors may want to watch to better gauge the risks of a cooling labor market — and what rising recession odds could mean for an already richly valued stock market.
Before diving into sector-level trends in the payrolls report, it’s helpful to understand the overall makeup of the U.S. workforce. How large are the cyclical sectors that tend to fluctuate the most around recessions? Which sectors typically account for the biggest job losses during downturns? And which ones employ the largest share of workers?
The chart below illustrates how employment has shifted since 1950 — and where it stands today. The most dramatic change has occurred in manufacturing, which accounted for nearly one-third of all jobs in the 1950’s but represents just 8 percent today. That decline has been offset by steady growth in education & health services, professional & business services, and leisure & hospitality. Construction, another cyclical sector like manufacturing, has remained relatively stable over time, consistently making up about 5 percent of total payrolls.
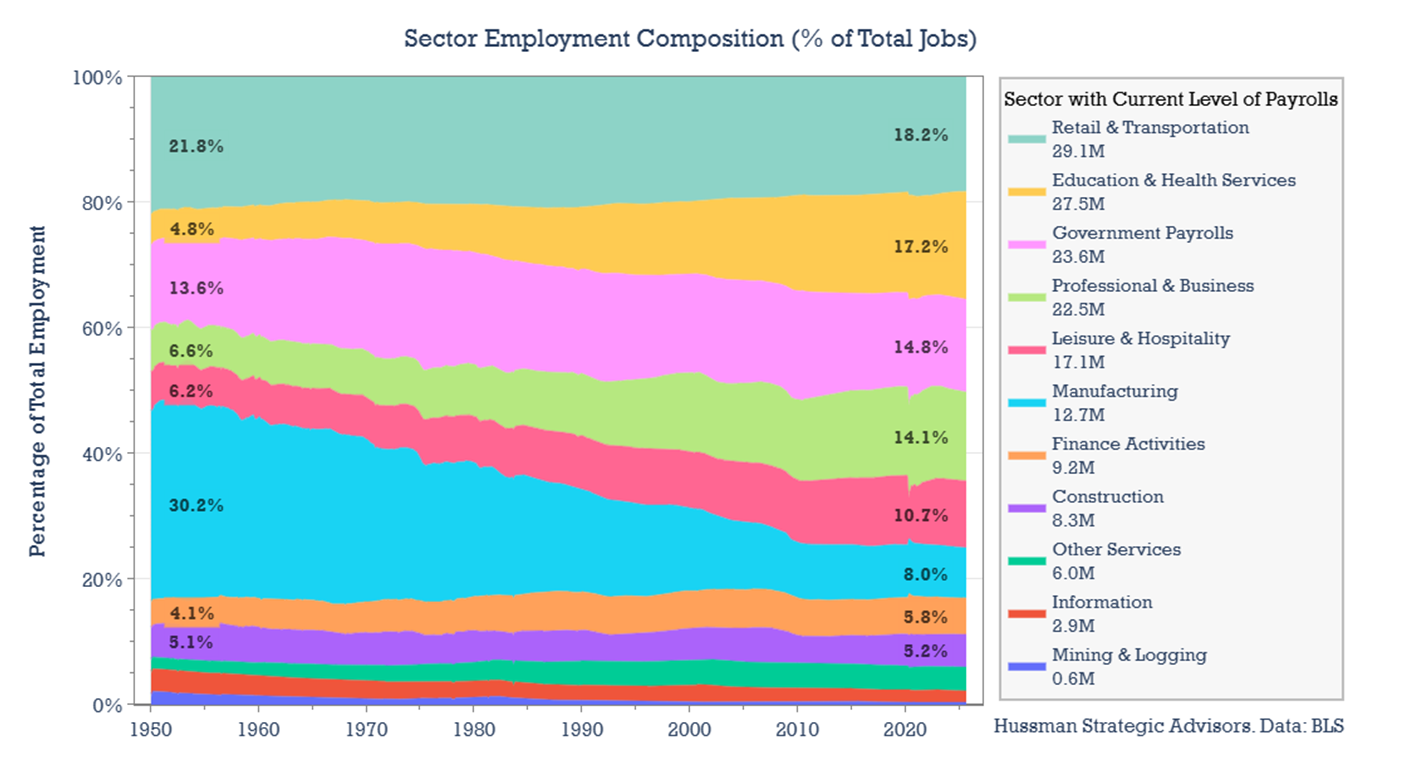
About 75 percent of jobs in the U.S. economy are in the five largest sectors: Trade, Transportation & Utilities (which I’ll refer to as Retail & Transportation in this discussion), Education & Health Services, Government, Professional & Business, and Leisure & Hospitality.
With this backdrop, here are some important trends to watch as the next few payroll reports are released.
Watch recession sensitive sectors
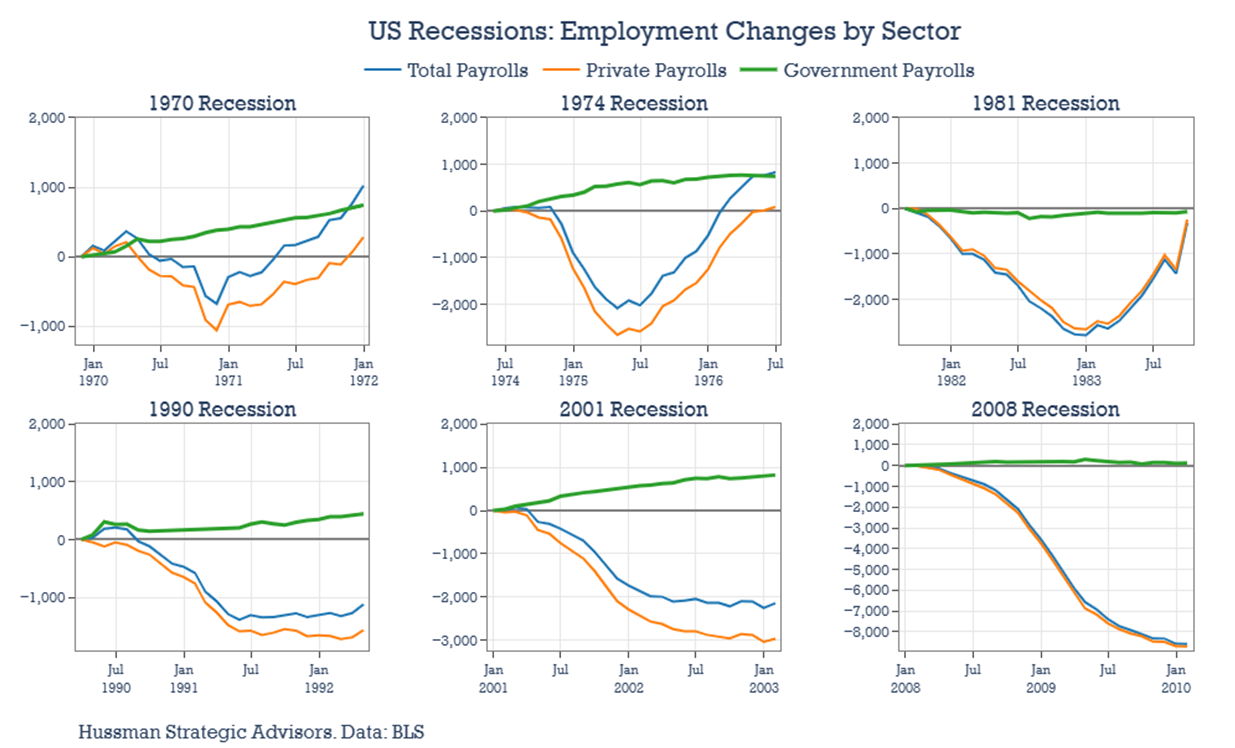
As the composition of the labor force has evolved, so too has the pattern of which sectors drive job losses during recessions. The charts below show the cumulative change in payrolls across the eight largest BLS sectors, including government jobs (federal, state, and local). Each line begins at zero at the peak of payrolls for each recession and tracks the change over the following two years, regardless of how long the downturn lasted. The 1980 recession is excluded because it was brief and closely followed by the 1981 downturn, as is the 2020 COVID-driven recession. The overall patterns in 1980 were very similar to those in 1981.
During the recessions of the 1970’s and 1980’s, the two sectors most responsible for overall job losses were manufacturing and construction (the red and blue lines, respectively). In those earlier downturns, these industries accounted for most of the decline in total employment. In later recessions — 1990, 2001, and 2008 — job losses were spread more broadly. Alongside manufacturing and construction, sectors such as retail & transportation, professional & business services, and leisure & hospitality also played significant roles in overall employment declines.
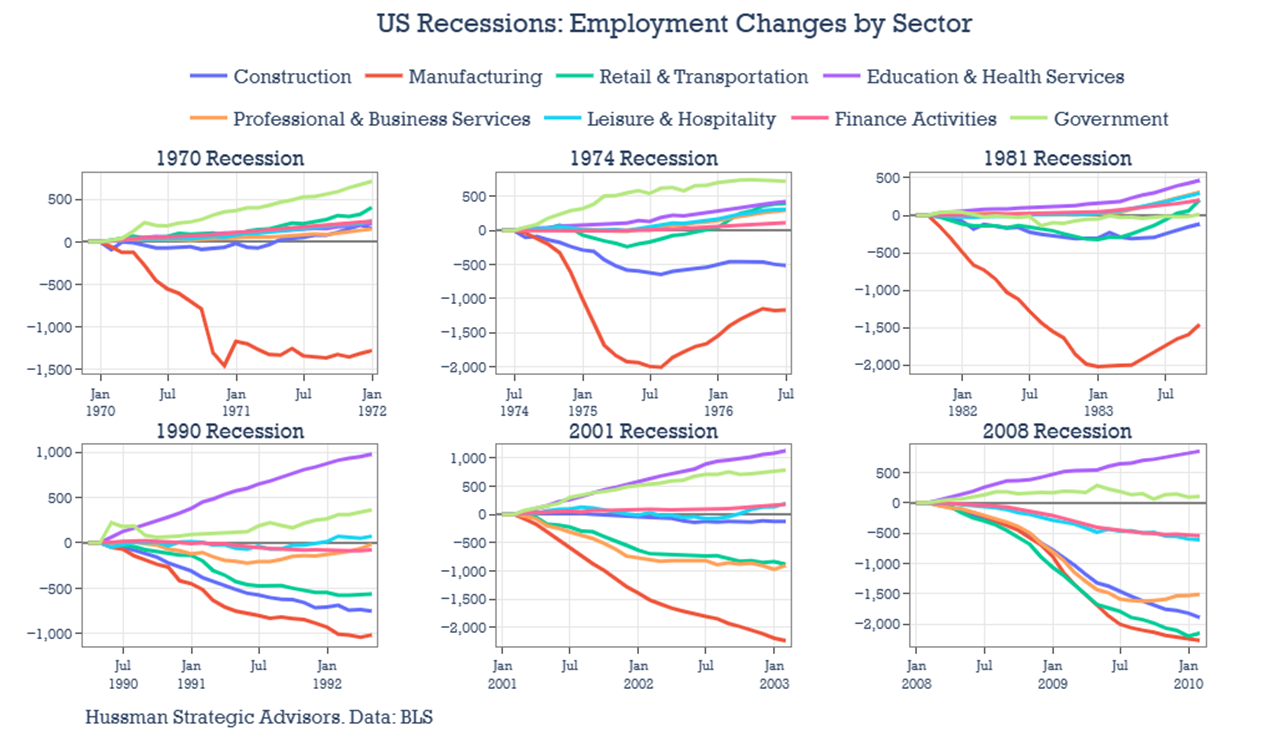
Just as certain cyclical sectors consistently contribute to job losses during recessions, others tend to expand even when the broader economy contracts. In the chart above, government employment (light green line) and education & health services (purple line) often rise through downturns, offsetting weakness elsewhere. Growth in these areas can sometimes mask early signs of labor-market softening. For clearer signals of emerging weakness, it’s important to separate these resilient sectors from those that are more sensitive to recessions and that typically drive overall job losses.
To do that, the chart below introduces a “recession-sensitive sector index” — a composite of the industries that have historically contributed the most to payroll declines during recent business-cycle recessions. In August, the six-month change in this index went negative for the first time since the 2020 recession. This calculation is worth watching closely: historically, this measure has never turned negative without the economy already being in, or just about to enter, a recession.
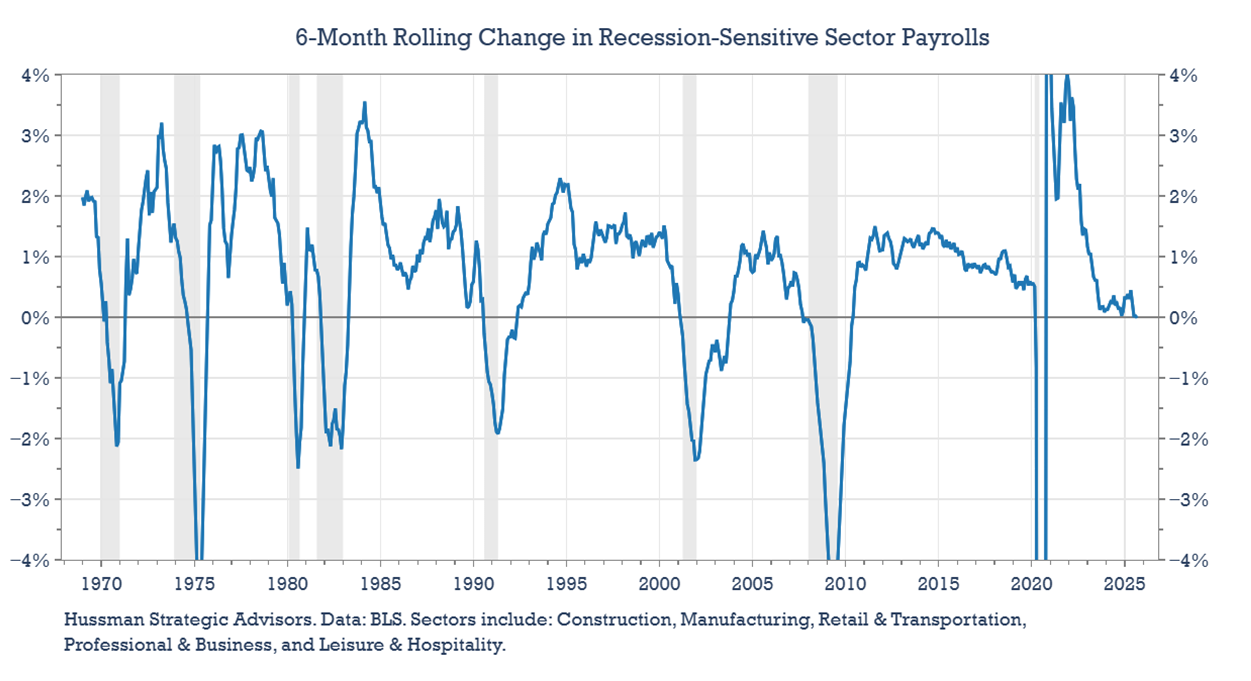
The chart also underscores how sharply the labor market has cooled since April. This trend will be important to monitor in the coming payroll reports — particularly whether growth in the typically recession-sensitive sectors continues to slow and if this index moves further into negative territory.
Unlike in 2022, cyclical payrolls are slowing
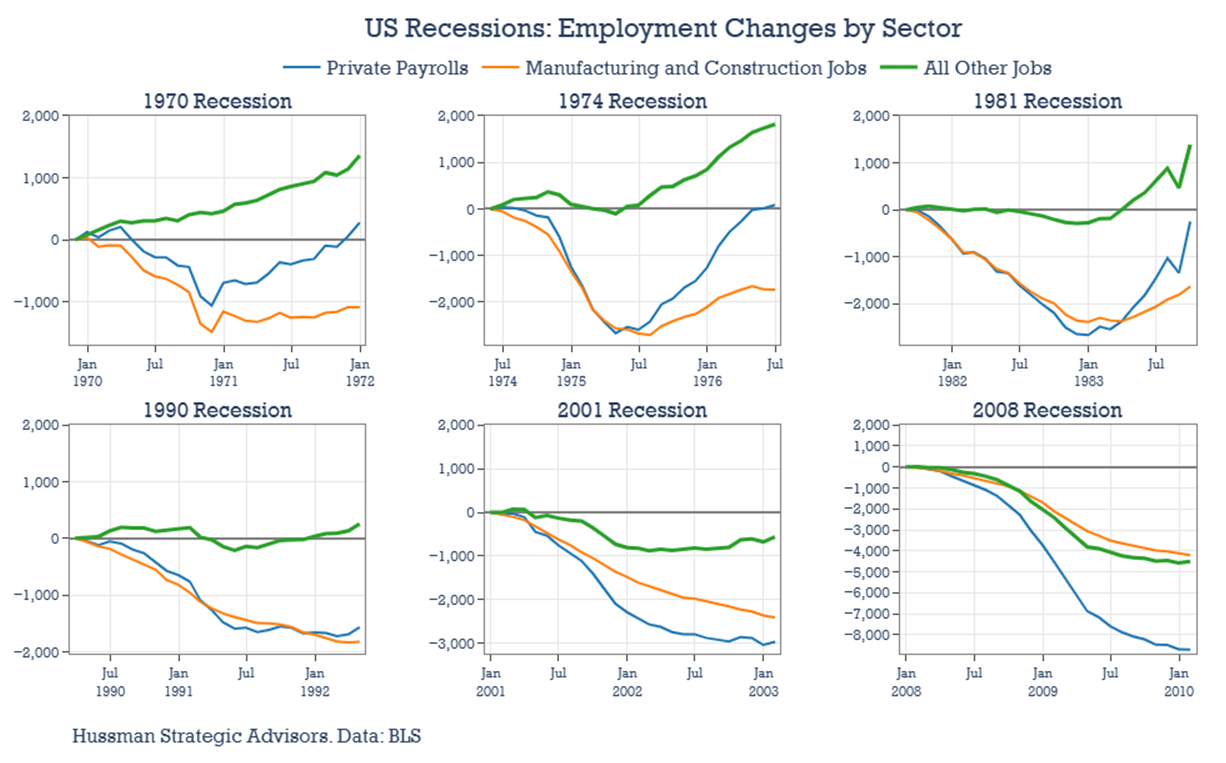
Although job losses have become more broadly distributed across sectors in recent recessions, cyclical industries remain important leading indicators for both overall payrolls and the broader economy. Even in the most recent downturns, manufacturing and construction together have accounted for at least roughly half of total job losses — despite making up only about 13 percent of U.S. employment. Their early declines have consistently signaled broader labor market weakness ahead.
The charts below show cumulative changes in payrolls for manufacturing and construction (orange), all other private-sector jobs (green), and total private payrolls (blue). As the data suggest, manufacturing and construction employment typically begin to contract before other sectors — even though those other sectors may later contribute significantly to total job losses.
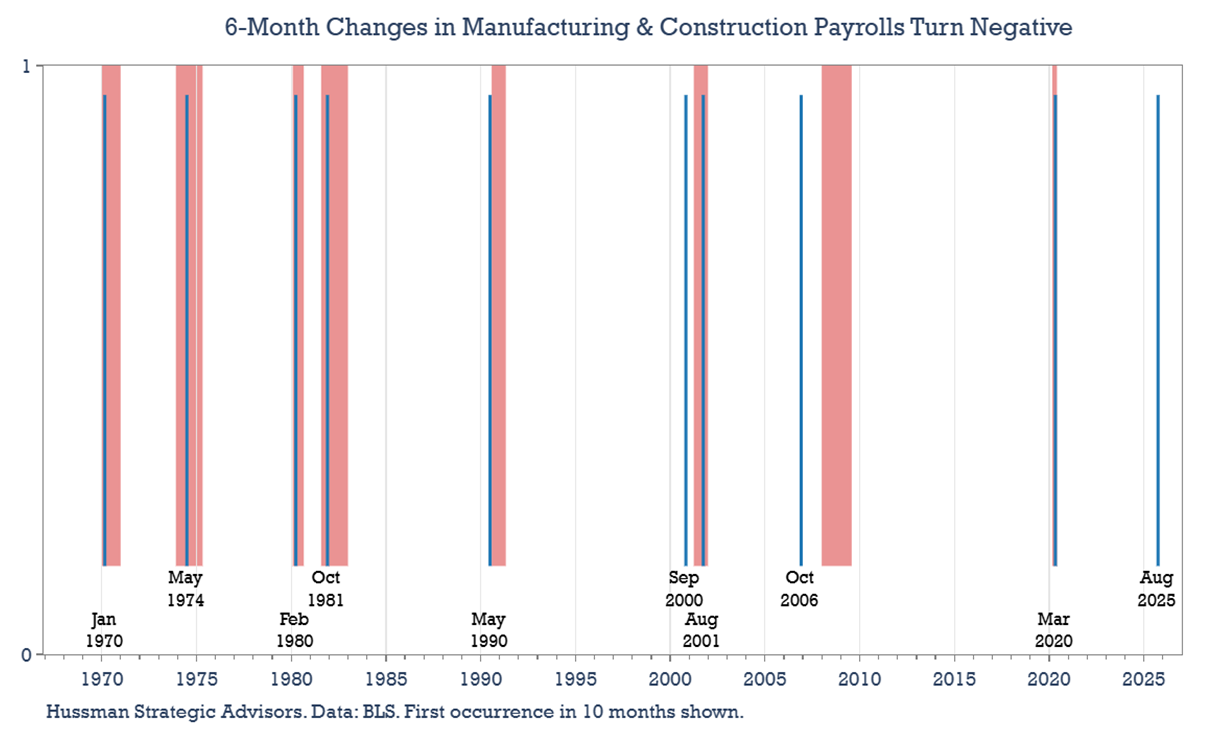
That’s why the most recent payroll data deserves close attention. On a six-month rolling basis, both construction and manufacturing payrolls have turned negative — a development not seen since before past recessions. This marks a sharp contrast with 2022 and early 2023, when recession concerns were elevated but cyclical jobs were still growing at a solid pace. During that period, construction payrolls were expanding at an annual rate of 4–5%, with manufacturing not far behind. This year, however, job growth in both sectors has slowed and slipped into negative territory. In the chart below, the blue vertical lines indicate the points when six-month changes in both cyclical sectors were first both negative.
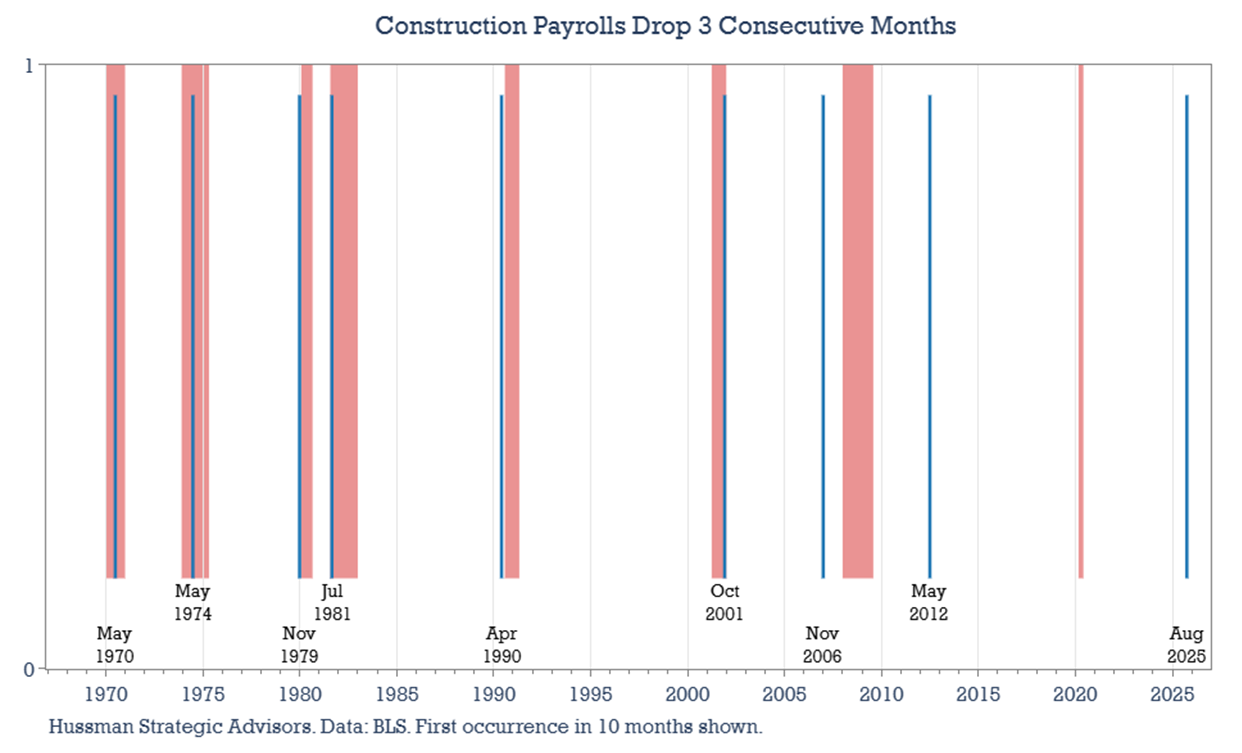
Construction payrolls can be particularly helpful as an indicator of whether the economy is entering into or already in recession. This sector hasn’t seen the long-term secular decline in payrolls as the manufacturing sector has. So, another red flag in the most recent data was that overall construction payrolls (which includes both residential and non-residential builders), fell for the third consecutive month. The blue lines in the chart below are the periods when construction payrolls have declined for 3 consecutive months. There’s one false positive in 2012. Otherwise, these occurrences typically are found around periods of recession.
There’s one more labor market trend worth watching — especially since investors may soon see up to three payroll reports released in quick succession. Since 1970, there hasn’t been a period with two consecutive monthly declines in total payrolls without a recession occurring nearby (two out of the last three months is also a good signal, and in some cases historically flagged 1 month earlier than two consecutive months did). The BLS reported a decline of 13,000 jobs in June, followed by only modest gains averaging 50,000 in July and August. Meanwhile, ADP data showed payroll declines in August and September before rebounding in October. With job growth slowing to such a modest pace, the likelihood of two back-to-back negative months is higher than usual.
Construction payrolls will likely stay weak
There’s little reason to expect a rebound in construction payrolls anytime soon. In fact, the data point to a greater likelihood of continued contraction. Large publicly traded homebuilders offer a glimpse into the pressures squeezing the broader residential construction industry — slower sales growth, shrinking profit margins, and declining profits that often pave the way for job cuts.
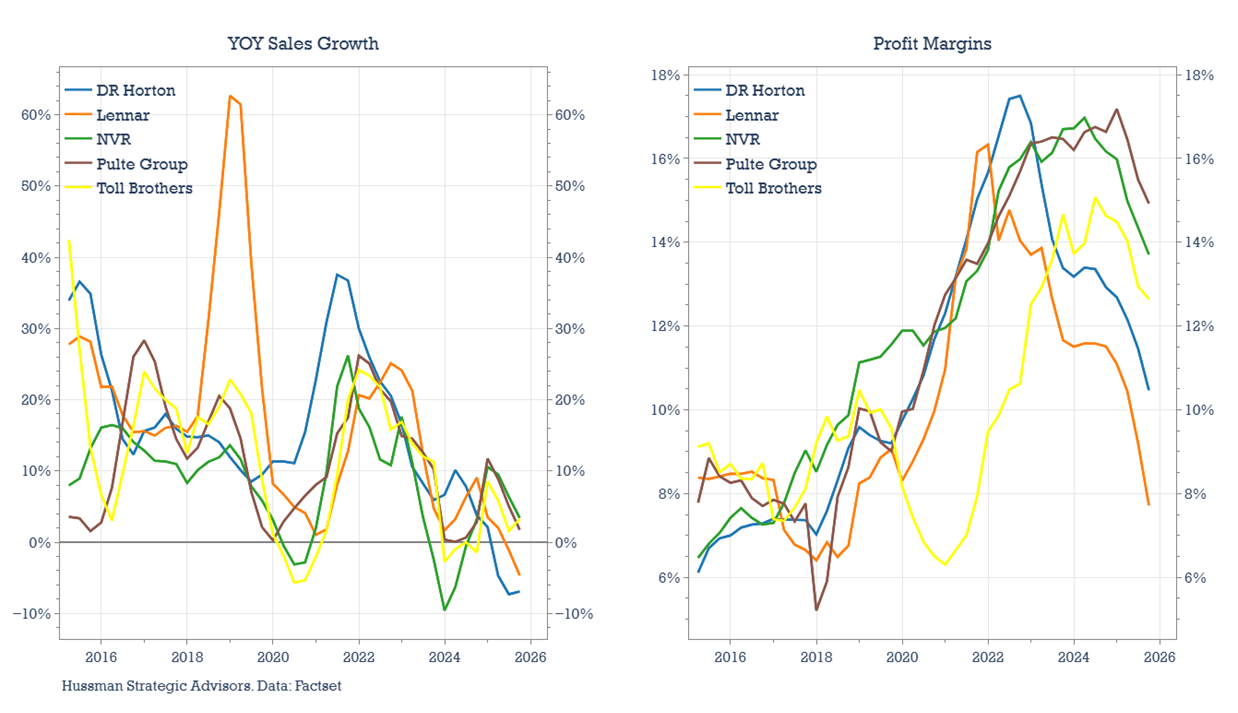
Following the pandemic, for example, new construction and home sales surged. Revenues among the top five publicly traded homebuilders grew between 20% and 30% annually, while profit margins climbed to 15–20%, record levels for many of them. But as interest rates rose and home prices jumped nearly 50% in just two and a half years, the new construction housing market entered a mini bust. Revenue growth for these builders has slowed to the low single digits — or turned negative — and margins have rolled over. For all five, earnings contracted on a year-over-year basis through the third quarter of this year. In recent earnings calls, all five companies cited similar challenges that are likely being felt across the broader construction sector: rising buyer incentives, elevated land costs, affordability constraints, and weakening consumer sentiment — all of which are further eroding profitability.
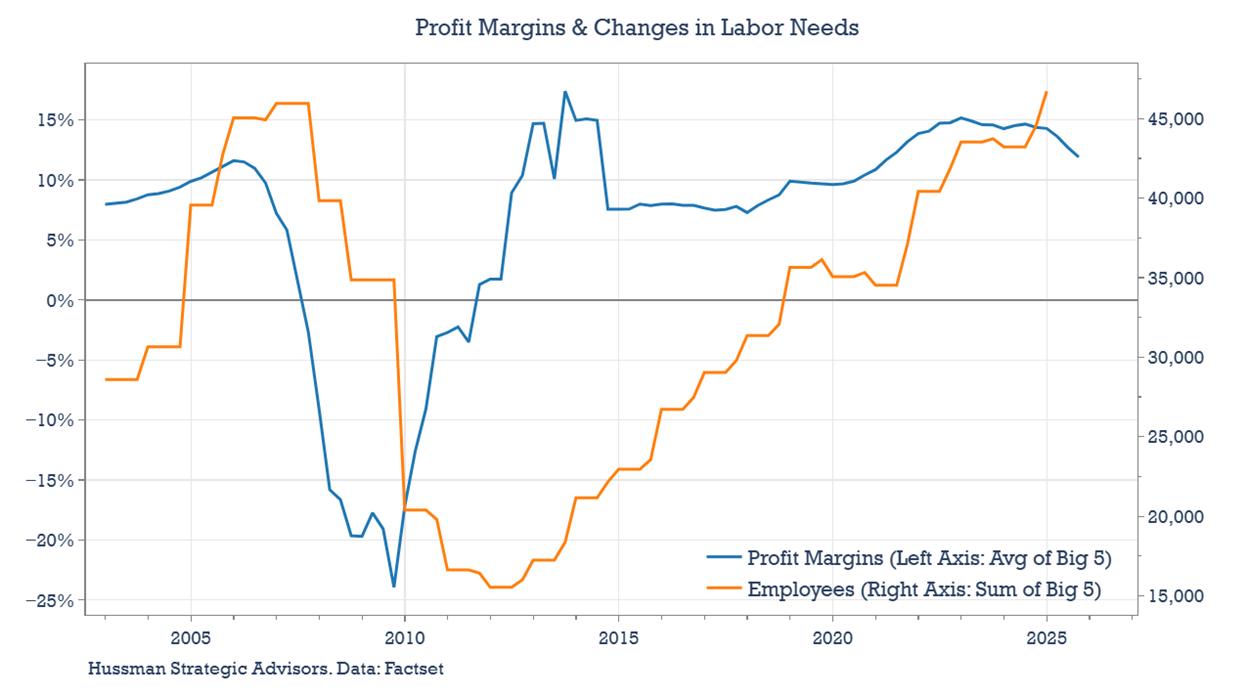
When we compare these firms’ profit margins with their employment levels, two clear patterns emerge. First, payroll changes tend to lag profitability — rising when margins and profits expand and falling when they contract. Second, the post-COVID construction boom drove employment among major homebuilders back to levels last seen in 2007, just before the financial crisis. This divergence between weakening margins and elevated payrolls is unlikely to persist. If margins continue to decline across the industry, payrolls will likely continue to follow them lower.
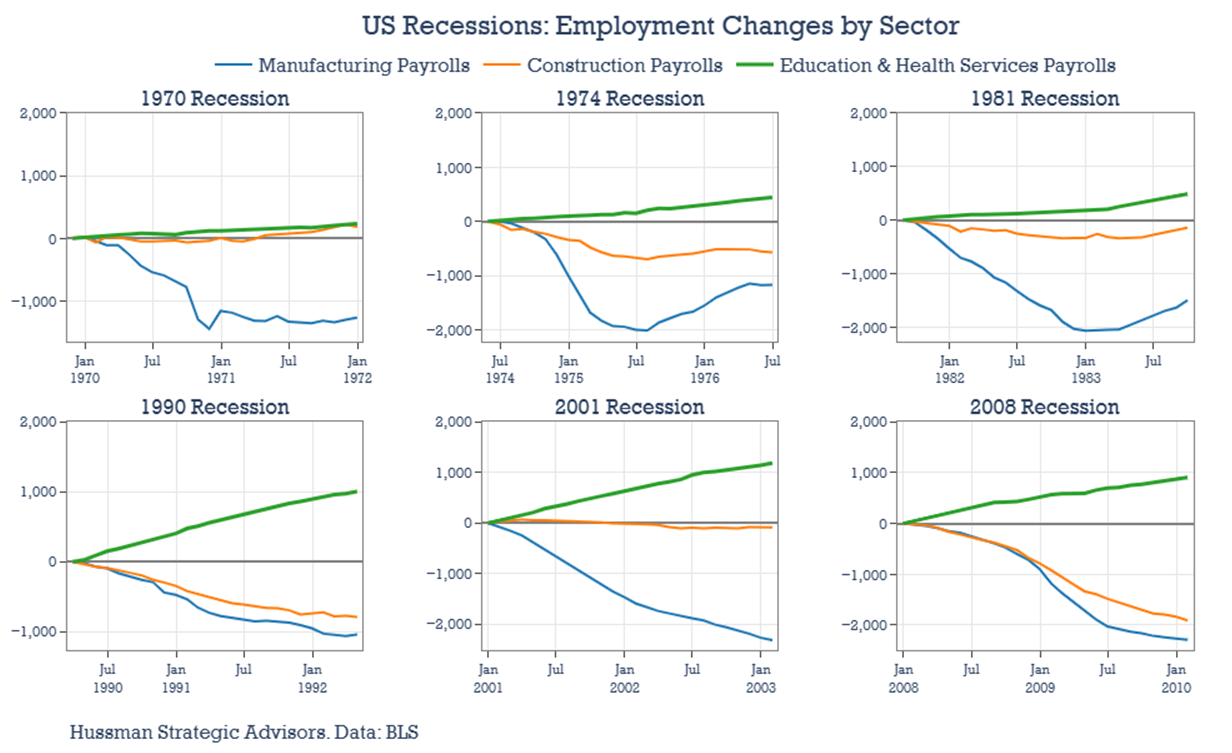
Education and Health Services, as usual, mask cyclical weakness
Continuing job growth in the Education and Health Services sectors has helped to mask weakness in cyclical sectors. That’s usually the case at the start of recessions.
Most of this year’s job growth has come from the education & health services sectors. Strength in these areas, together with gains in local government payrolls, has more than offset weakness in federal government, white-collar, and manufacturing employment. That’s not necessarily a bad thing — these jobs tend to be stable and well-paying. The chart below shows the cumulative changes this year in payrolls for education & health services compared with the more cyclical sectors of construction and manufacturing, as well as total private payrolls.

But we shouldn’t interpret continued growth in education and health services as evidence of a healthy labor market overall. Historically, these sectors have added jobs even during recessions. Their strength, therefore, often obscures early signs of weakness elsewhere. To gauge the true direction of the labor market, it’s more useful to focus on the sectors that typically shed jobs during downturns — the ones highlighted earlier in the Recession-Sensitive Sector Index.
In the chart below, you can see the cumulative changes in manufacturing and construction payrolls alongside education & health services during past recessions. The pattern is consistent: gains in education & health services often occur at the same time that payrolls in the more cyclical parts of the economy are contracting.
Watch AI-impacted payrolls
There’s now more than just anecdotal evidence of AI-related job losses — though those stories are piling up. Amazon recently announced corporate layoffs that could impact as many as 30,000 jobs, and CEO Andy Jassy has warned that corporate headcounts will likely continue to decline as the company increases its use of artificial intelligence. Target reported its largest corporate layoff in a decade. UPS, Charter Communications, Nestlé, and Applied Materials — among others — have also reported job cuts. The reasons vary, but AI and automation are increasingly cited as contributing factors.
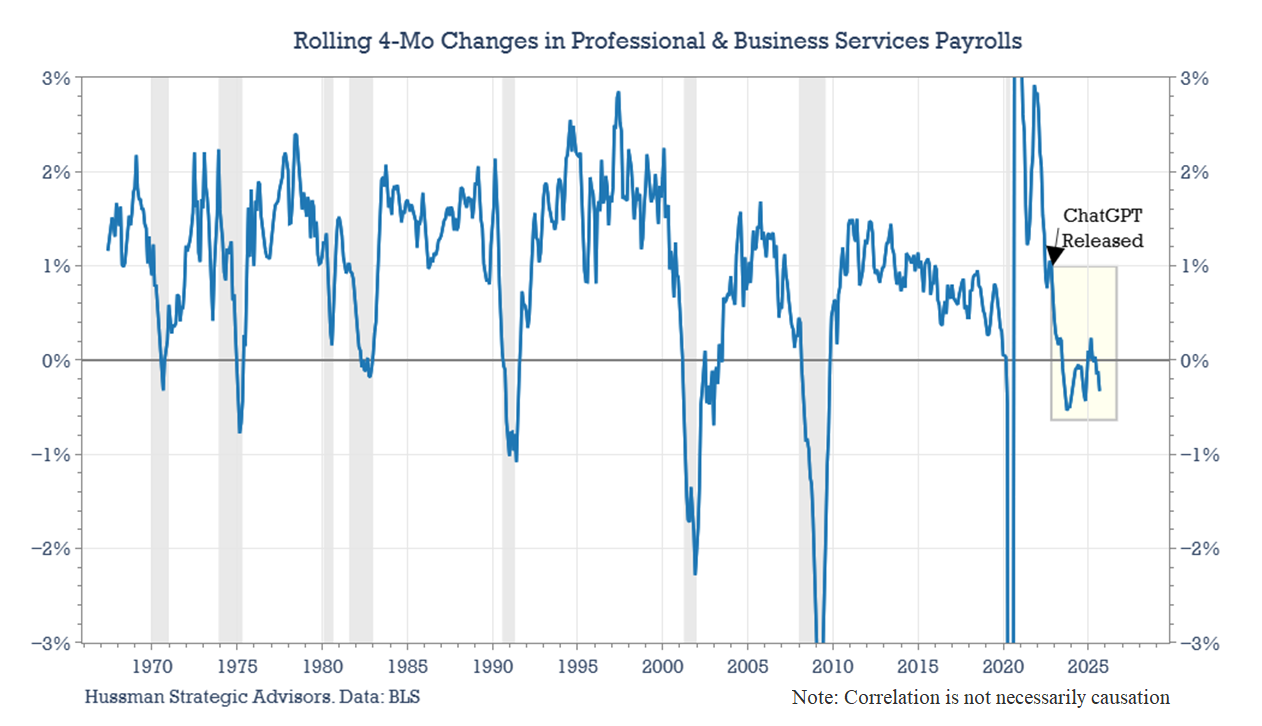
This is an important trend to watch for its medium- and long-term implications. The sector most exposed is professional & business services, which intuitively makes sense when considering the types of white-collar roles most susceptible to AI disruption. But we can quantify it as well. Over the summer, Microsoft published research identifying the 40 job titles most likely to be impacted by AI and the 40 least affected. The most exposed occupations included translators, sales representatives for services, and customer service representatives. Together, Microsoft estimated that these top 40 “at-risk” occupations account for roughly 8.5 million U.S. jobs. Mapping those titles to BLS sectors shows that about half would fall within the professional & business services category.
These impacts may already be showing up in national payroll data. Being careful to emphasize that correlation is not causation, the chart below tracks the four-month rolling change in professional & business services payrolls, with the launch of OpenAI’s ChatGPT highlighted for context. Given that this sector is the third largest category within private-sector employment — accounting for about 22.5 million jobs — the rate of its contraction bears close attention.
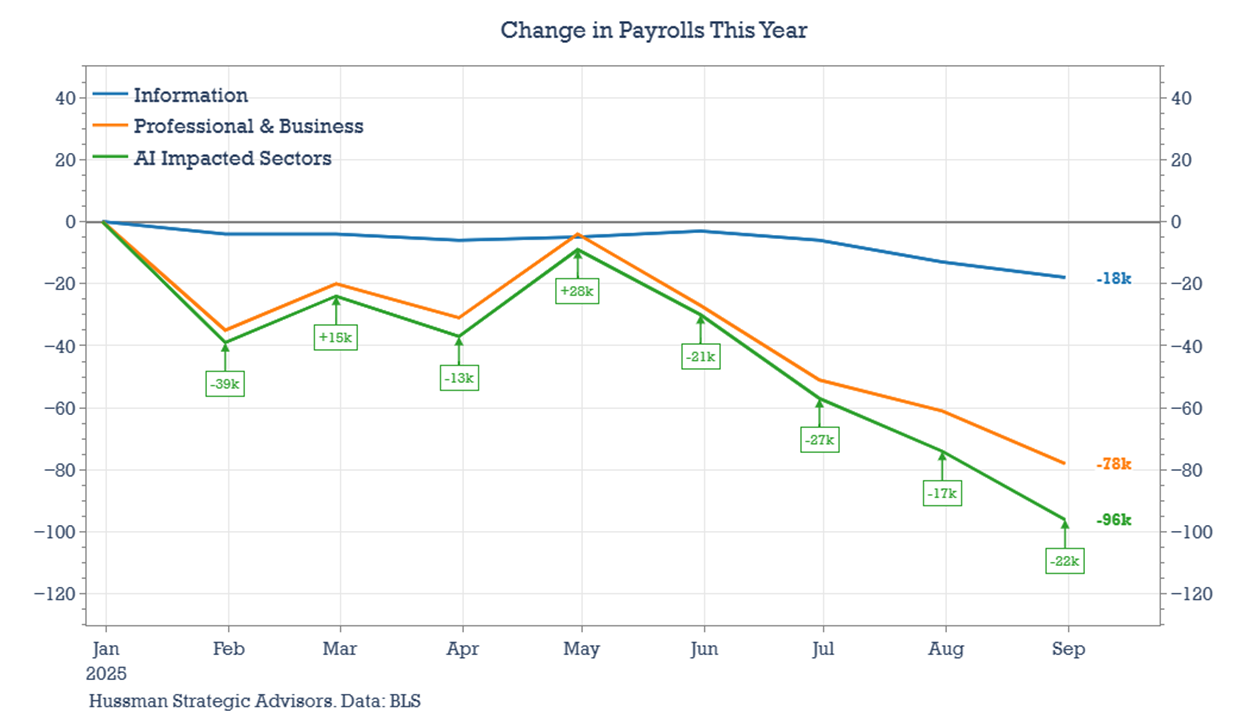
The chart below shows the cumulative change in payrolls this year across both the professional & business services and information sectors, where AI-related impacts are most likely to emerge first. The weakness in these sectors continued in the most recent ADP report. ADP reported that in October the professional & business services sector lost 15,000 jobs, and the information sector lost 17,000 jobs. Again, we should not be quick to conclude that AI is necessarily the driver of these losses, but it will be important to watch if this pattern continues.
Watch local government payrolls
There aren’t enough federal government jobs to significantly move overall employment trends. The 2.9 million Federal employees today amount to just 1.8% of total employment. Even at the end of 2024, this was the lowest share of the U.S. labor force in history. By comparison, there are roughly 5.5 million government workers at the state level and 14.5 million at the local level (mainly teachers and first-responders). Still, there tends to be a positive correlation among payroll trends across federal, state, and local governments. When federal government employment contracts, state and local payrolls often soften as well.
Historically, however, government jobs (shown in green in the charts below) have acted as a stabilizing force during recessions, providing ballast against job losses elsewhere in the economy. As the charts show, declines in total payrolls (in blue) are usually slightly smaller than in private-sector payrolls (in orange), a reflection of the support that expanding government employment often provides during downturns.
So far this year, expanding payrolls at the local level have offset the weakness seen in federal employment stemming from DOGE-related cuts and the recent government shutdown. State government payrolls, however, have begun to weaken — and because state and local employment are closely correlated, any further softening at the state level could be an early warning sign for broader weakness at the local government level. If local government payrolls start to decline, and federal and state payrolls continue their current weakening trend (as additional DOGE-related reductions appear in upcoming BLS reports), the public sector may not provide the cushion it typically has during past downturns. Historically, government employment has been one of the most resilient categories during recessions, rarely shedding jobs. The chart below shows how total government payrolls have changed year-to-date.

Watch initial and continuing claims for unemployment
As labor data returns, in addition to the nonfarm payroll report, investors will also be eager to start following the weekly initial and continuing jobless claims report again. Claims at the national level can be estimated from state claims, which continue to be collected. And as Fed Chairman Powell referenced (3 times) in his recent press conference, there hasn’t been much change in direction of initial claims during the shutdown. But he also stressed the importance of the release, so they’ll likely receive extra scrutiny by investors when they return.
Jobless claims are volatile, so they can trigger false positives when relying on them – by themselves – as recession signals. But, in addition to some of the other indicators discussed above, we can keep a level in mind. In every case that the 4-week average of jobless claims has climbed by 90,000 from a 52-week low, there’s been a recession. This level of increase has never missed flagging a recession since 1970, and incurred only one false positive (in a February 1977 report that was impacted by both weather related and reporting issues). Considering the current 52-week low in claims of 212,000, that would put the current threshold at about 300,000 on a 4-week average basis. The current 4-week average sits at 238,000 (using the officially released data prior to the government’s closure).
Also keep an eye on Continuing Claims. They’ve been persistently higher this year than the last few years, as the No-Hire trend in labor markets have kept the out-of-work from finding new employment. In a new indicator created by researchers at the Richmond Fed, continued weakness in this indicator could highlight if the economy is heading toward recession. The authors of the indicator call it the SOS Recession Indicator, and it flags a recession when the 26-week moving average of the insured unemployment rate (those filing continuing claims as a percent of total workers insured) rises by more than 0.2 percentage points from its 52-week low. It’s almost halfway to its threshold. It’s worth watching because historically it has flagged recessions slightly earlier than the Sahm Rule (without any false positives).
All of these indicators need to be viewed in the context of a changing labor force. To keep the unemployment rate steady, employment growth must at least match the expansion of the labor force — which in turn depends on labor force participation and population growth. Both components have undergone major shifts since the pandemic, driven first by changes in participation rates following COVID and more recently by shifts in immigration policy. Researchers at the Dallas Fed estimate that the new break-even pace of job growth needed to hold the unemployment rate constant is now roughly 30,000 jobs per month. This makes direct comparisons between today’s employment changes and historical levels more difficult. That’s why composite measures that combine multiple indicators tend to provide a more reliable signal of recession risk than any single data point.
Taken together, the data suggest that this is an especially important time to be vigilant about recession risk. While many of the indicators discussed above suggest that the likelihood of a downturn is rising, expectations for one remain unusually low. This contrasts sharply with 2022, when Bloomberg’s survey of economists put the probability of a recession within the next year at 65%. Today, that estimate has fallen to just 30% — roughly the long-term average since the survey began in 2008. In other words, economists don’t currently view recession risk as elevated, even though many labor market indicators point to growing risks.
To put the current gap between perception and reality into perspective, the last time the SOS Recession Indicator reached its present level, Bloomberg’s recession probability was more than twice as high as it currently is. If the U.S. economy were to slip into recession in the coming months, it would catch far more investors surprised than it would have in 2022 or early 2023.
Recession-induced stock market declines are different
It’s important to keep in mind that the financial markets tend to lose substantial ground well before there’s overwhelming proof that the economy has entered into recession. Stocks typically decline as the probability of recession rises, as they did in 2022. And since recession risk appears more likely than survey expectations indicate, and valuations are at record levels, it’s probably worth revisiting how stock market declines that occur near recessions differ from those that happen outside of economic contractions.
There are three key characteristics that tend to set recession-related declines apart:
1. They typically last longer.
2. They tend to be significantly more volatile, both in terms of overall drawdowns and the degree to which stocks become oversold during the decline.
3. They often present more opportunities for risk management, as the market experiences a series of sharp rallies and pullbacks rather than a straight-line decline.
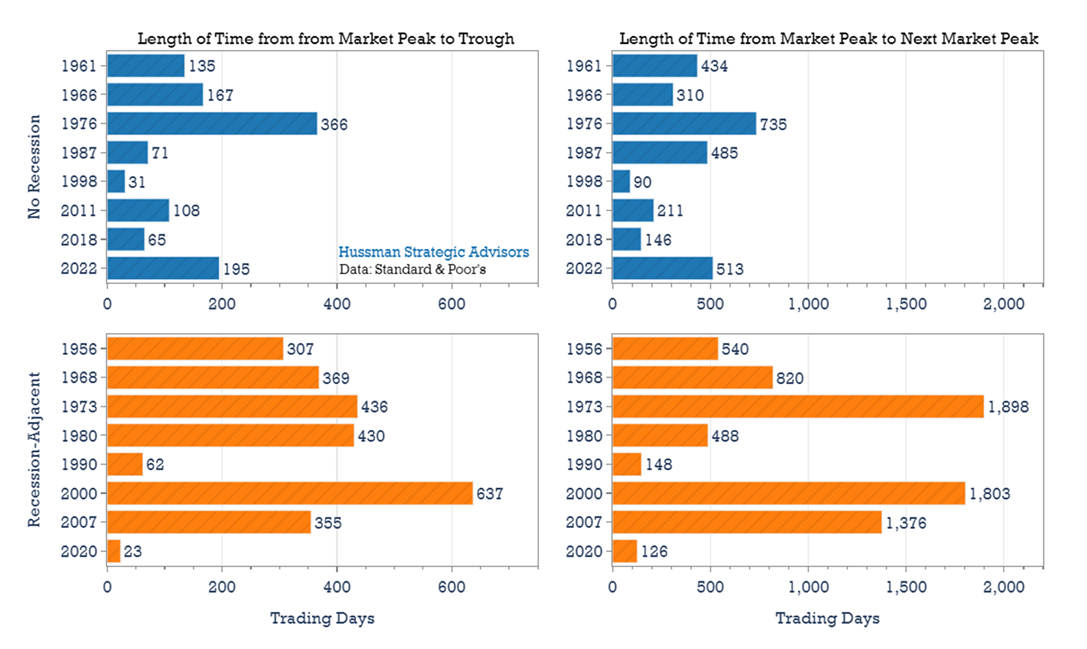
In each of the bar charts below, the blue bars represent stock market declines of at least 19% that occurred outside the vicinity of a recession. Since 1950, there have been eight such declines — coincidentally, the same number as recession-adjacent declines. The most well-known of these is the 1987 crash, when the market fell 33% over an 8-week span. Other notable examples include the nearly 20% pullbacks in 1998, 2011, and 2018, as well as the more recent 25% decline in 2022.
The orange bars highlight stock market declines that took place around the time of recessions. While it’s tempting to assume these declines were caused by the nearby recessions (and many probably were), the 2001 recession offers a counter example – a mild economic downturn within a larger stock market correction related to the dot-com bubble bursting and valuations normalizing. To be careful not to suggest causation in every case, we will use the term recession-adjacent for these types of stock market declines.
The first set of charts compares the duration of the two types of stock market declines — both in terms of the peak-to-trough decline and the total time it took for the market to recover to its previous high. On average, non-recession declines lasted about 7 months from peak to trough, while recession-adjacent declines averaged 16 months.
The difference in how long investors remained underwater relative to the prior peak is particularly noteworthy. Recession-adjacent declines tend to take much longer to recover from. The COVID-related decline, with a recovery period of just 6 months, was mostly an outlier, especially considering the extent of the decline. In contrast, investors waited more than five years after the 2007 market top, and more than seven years to break even after the market peaks of 1973 and 2000.
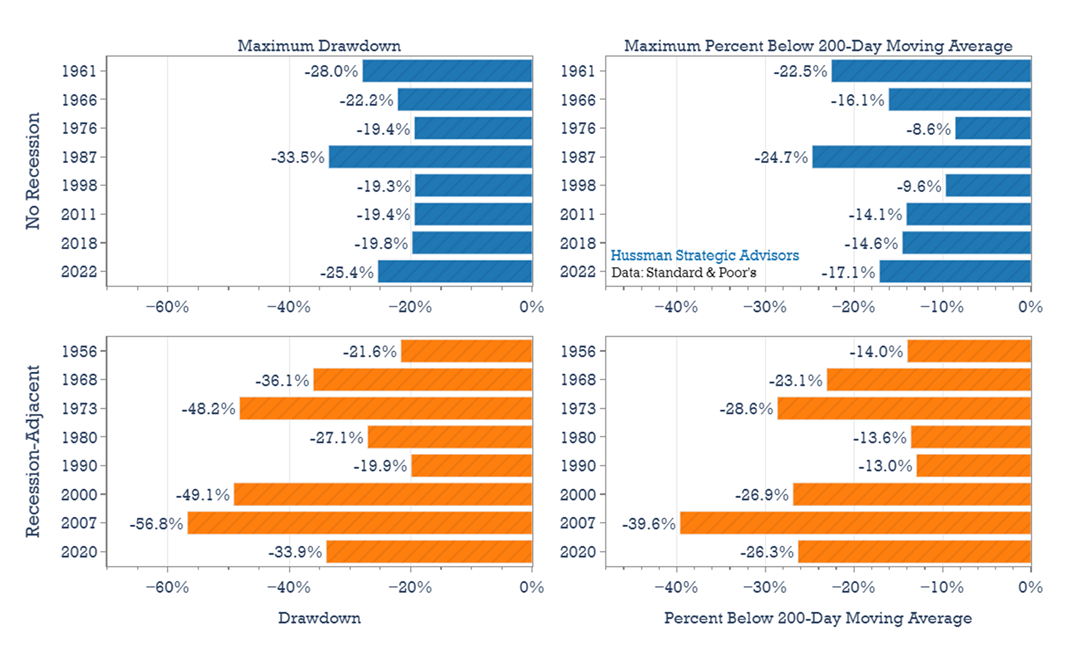
Recession-adjacent declines also tend to produce deeper overall drawdowns, as shown in the chart below on the left. They are often more volatile as well. The chart on the right captures the maximum distance the market fell below its 200-day moving average during each decline — offering a sense of the speed and severity of the steepest descent within each drawdown. In many cases, these sharp drops resemble standalone market crashes embedded within broader, prolonged downturns.
Finally, recession-adjacent stock market declines tend to offer significantly more opportunities to adjust risk exposures, particularly during counter-trend rallies. For example, there have been nearly twice as many 5–10% rallies during recession-related declines compared to non-recession declines (26 vs. 14). Rallies of 10–15% have occurred seven times in recession-adjacent periods, but only twice during non-recession declines. And there have been six rallies of more than 15% during recession-adjacent declines, compared to just one in non-recession declines. Both small and large rallies have been more common during the typically longer-lasting, recession-linked downturns.
The labor market stands at an important crossroads. Labor reports released through the end of summer revealed three key trends — none supportive of sustained payroll growth. First, cyclical sector employment is slowing, and the pressures weighing on the construction industry suggest that weakness in this key sector could persist. Second, payrolls in AI-related industries are also contracting — and because these sectors together are larger in size than traditional cyclical ones, their slowdown carries implications for the broader economy. Third, government employment may not provide the stabilizing offset it typically has during past recessions. There are already a handful of labor market characteristics that are typically only seen around recessions. None, taken individually, is reliable enough to be confident that the U.S. economy faces a recession. But they will be important to monitor as new payroll data is released. In the event the economy does slip into contraction, today’s elevated stock valuations could leave markets especially vulnerable to the kind of prolonged, volatile declines that have characterized previous recession-adjacent downturns.
Keep Me Informed
Please enter your email address to be notified of new content, including market commentary and special updates.
Thank you for your interest in the Hussman Funds.
100% Spam-free. No list sharing. No solicitations. Opt-out anytime with one click.
By submitting this form, you consent to receive news and commentary, at no cost, from Hussman Strategic Advisors, News & Commentary, Cincinnati OH, 45246. https://www.hussmanfunds.com. You can revoke your consent to receive emails at any time by clicking the unsubscribe link at the bottom of every email. Emails are serviced by Constant Contact.
Prospectuses for the Hussman Strategic Market Cycle Fund, the Hussman Strategic Total Return Fund, and the Hussman Strategic Allocation Fund, as well as Fund reports and other information, are available by clicking Prospectus & Reports under “The Funds” menu button on any page of this website.
The S&P 500 Index is a commonly recognized, capitalization-weighted index of 500 widely-held equity securities, designed to measure broad U.S. equity performance. The Bloomberg U.S. Aggregate Bond Index is made up of the Bloomberg U.S. Government/Corporate Bond Index, Mortgage-Backed Securities Index, and Asset-Backed Securities Index, including securities that are of investment grade quality or better, have at least one year to maturity, and have an outstanding par value of at least $100 million. The Bloomberg US EQ:FI 60:40 Index is designed to measure cross-asset market performance in the U.S. The index rebalances monthly to 60% equities and 40% fixed income. The equity and fixed income allocation is represented by Bloomberg U.S. Large Cap Index and Bloomberg U.S. Aggregate Index. You cannot invest directly in an index.
Estimates of prospective return and risk for equities, bonds, and other financial markets are forward-looking statements based the analysis and reasonable beliefs of Hussman Strategic Advisors. They are not a guarantee of future performance, and are not indicative of the prospective returns of any of the Hussman Funds. Actual returns may differ substantially from the estimates provided. Estimates of prospective long-term returns for the S&P 500 reflect our standard valuation methodology, focusing on the relationship between current market prices and earnings, dividends and other fundamentals, adjusted for variability over the economic cycle. Further details relating to MarketCap/GVA (the ratio of nonfinancial market capitalization to gross-value added, including estimated foreign revenues) and our Margin-Adjusted P/E (MAPE) can be found in the Market Comment Archive under the Knowledge Center tab of this website. MarketCap/GVA: Hussman 05/18/15. MAPE: Hussman 05/05/14, Hussman 09/04/17.