

Warning: Federal Reserve Easing Ahead


John P. Hussman, Ph.D.
President, Hussman Investment Trust
July 2019
So we have to make a distinction. If the Fed launches a fresh policy of extraordinary easing in the next downturn, the appropriate response will depend on whether market internals indicate that investors are inclined toward speculation, or whether they are inclined toward risk aversion. The central consideration here is what I call ‘uniformity’ – when investors are inclined to speculate, they tend to be indiscriminate about it. It’s difficult to get extended market advances without recruiting that kind of uniformity, but it will be important to avoid being sucked into the market in response to Fed easing alone. Historically, initial Fed rate cuts in response to a market downturn have been followed by very negative consequences (after the initial obligatory market pop), because they generally indicate that something has gone wrong.
– John P. Hussman, Ph.D., November 28, 2018
Of all the distinctions that investors might make in the coming few years, one that I expect will serve investors particularly well is the distinction between how the market responds to monetary policy when investors are inclined toward speculation, versus how the market responds when investors are inclined toward risk-aversion.
Though these inclinations are psychological, we can infer them from observable market behavior, because when investors are inclined toward speculation, they tend to be indiscriminate about it. As a result, our best measure of investor psychology is the uniformity or divergence of market action across thousands of stocks, industries, sectors, and security-types, including debt securities of varying creditworthiness. I refer to that broad uniformity or divergence using the word “internals.”
Unlike valuations, where we are extremely open about our methods, our measure of internals is one of the few things I keep “proprietary.” That’s because shifts in internals are very discrete, and one doesn’t want to respond to market behavior at the exact moment everyone else does. That said, I’m very open about the underlying principle: speculation tends to be indiscriminate. Our own methods involve a very broad signal-extraction from market behavior, but the general features can be captured by examining multiple concepts of “uniformity” – breadth (advancing/declining issues), participation (% of stocks moving jointly), leadership (new highs/lows), price-volume behavior (sponsorship), trend and momentum-related indicators, credit spreads, and similar measures.
The chart below presents the cumulative total return of the S&P 500 in periods where our measures of market internals have been favorable, accruing Treasury bill interest otherwise. The chart is historical, does not represent any investment portfolio, does not reflect valuations or other features of our investment approach, and is not an assurance of future outcomes.
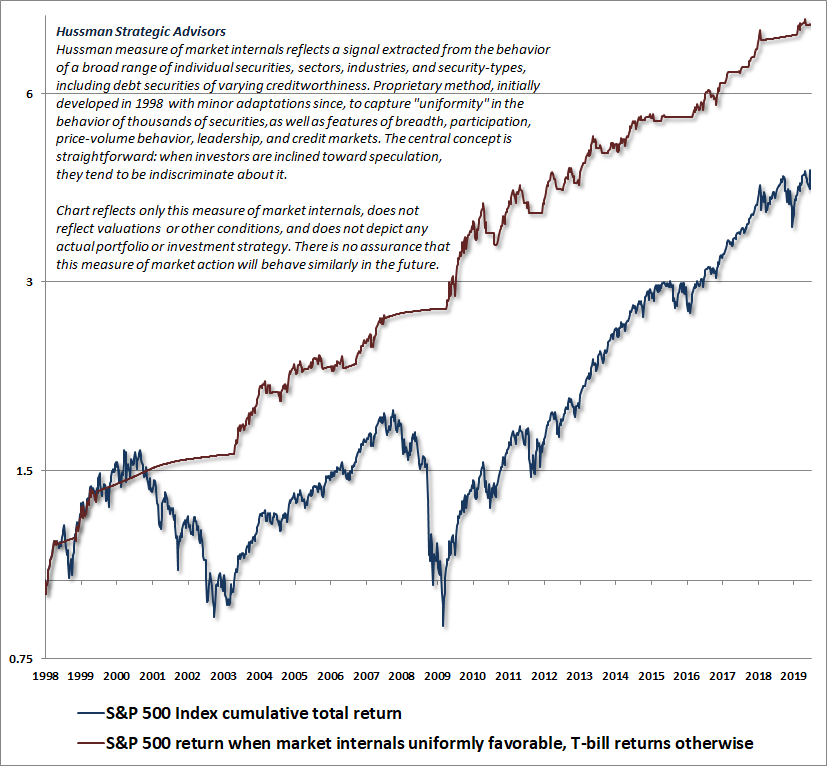
Notice that our measures of market internals were unfavorable for over a year following a negative shift on February 2, 2018. After a brief positive whipsaw, they have turned negative again in recent weeks. The fresh market highs following the latest Federal Reserve meeting have not, at least yet, been associated with a fresh positive shift in internals. In the context of hypervalued extremes, these poor internals suggest that a “trap door” remains open here. That may change, but rather than trying to predict internals, we respond to shifts when we actually observe them.
As I’ve detailed extensively, both valuations and market internals performed beautifully in the recent complete market cycle, as they have historically. My error in recent years was due to a different consideration: my pre-emptive bearish response to “overvalued, overbought, overbullish” syndromes that had generally signaled a “limit” to speculation in prior market cycles across history. Because of their reliability across history, we prioritized those syndromes following our 2009-2010 stress-testing exercise against Depression-era data. In hindsight, amid the novelty of quantitative easing and zero-interest rate policy, our pre-emptive bearish response to those “overvalued, overbought, overbullish” syndromes turned out to be detrimental. No incremental adaptation was enough until I threw my hands up in late-2017 and completely abandoned the notion that it was still possible to define any “limit” to speculation.
Since then, our requirement has been straightforward: Regardless of how extreme valuations or other conditions might become, we will defer adopting or amplifying a “bearish” investment outlook unless our measures of internals have explicitly deteriorated. Some conditions may be extreme enough to justify a neutral outlook, but a bearish outlook requires deterioration in internals, signaling that investors have shifted toward risk-aversion. That single requirement would have dramatically improved our experience in this half-cycle. It allows us to pursue a historically-informed, value-conscious, full-cycle investment discipline, while fully embracing the likelihood of future episodes of zero interest rates and quantitative easing, and even the possibility of negative interest rates, helicopter money, and other extraordinary policies.
Monetary policy and market internals
Remarkably, while the Federal Reserve’s policy of quantitative easing and zero interest rates disabled historical “limits” to speculation in recent years, market internals have remained an essential guide in judging whether easy money is likely to be favorable or unfavorable for the market. We know that in recent years, as long as our measures of market internals were favorable, Federal Reserve easing continued to amplify speculation regardless of how extreme conditions became. Conversely, the deepest market declines, both historically and in recent years, have been during periods where market internals were unfavorable.
Recall also that the Federal Reserve began cutting interest rates at the very beginning of both the 2000-2002 and 2007-2009 market collapses. The combination of rich valuations and unfavorable market internals allowed us to anticipate both declines in real time. Yet because investors remained persistently inclined toward risk-aversion, monetary easing failed to support stocks. The Fed eased persistently and aggressively the whole way down, to no avail.
So be very careful not to assume that “easy money” means “rising market.” Rather, monetary policy always has to be placed in the context of prevailing investor psychology. See, what Fed easing actually does is to replace interest-bearing Treasury securities held by investors with zero-interest rate cash, which somebody has to hold at every point in time until it’s retired. If investors are inclined toward speculation, holding zero-interest cash drives them absolutely crazy, so those low-interest reserves become hot-potatoes that each holder tries to exchange for riskier and more speculative securities.
In short, easy money amplifies speculation, provided that investors are already inclined to speculate. But if investors are inclined toward risk-aversion, safe, low-interest rate liquidity isn’t an “inferior” asset at all; it’s a preferred one. As a result, as we saw in 2000-2002 and 2007-2009, creating more of the stuff simply doesn’t promote speculation.
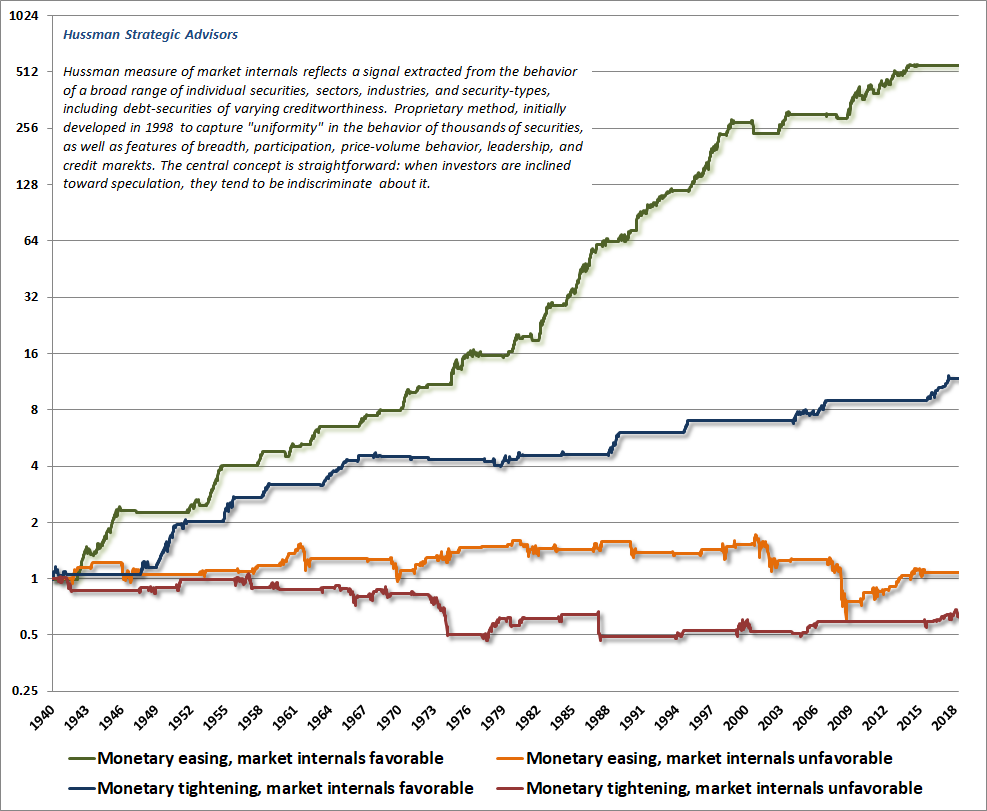
The chart below is a reminder of this distinction. Here, I’ve defined “easing” as periods where the most recent move in the Federal Funds rate or the Discount Rate was downward, or where Treasury bill yields decline by at least 0.50% from their high of the previous 6-month period. The opposite criteria are used for tightening. This classifies about 63% of periods as easing, and 37% as tightening. The monetary policy stance is then partitioned based whether the condition of market internals (our proxy for whether investors are inclined toward speculation or risk-aversion) was favorable or unfavorable. Each line shows the cumulative total return of the S&P 500 under the associated set of conditions.
Notice, in particular, that it is much better for the Fed to be tightening in an environment of favorable internals and speculative psychology than it is for the Fed to be easing in an environment of unfavorable internals and risk-averse psychology.
Be very careful not to assume that ‘easy money’ means ‘rising market.’ Easy money amplifies speculation, provided that investors are already inclined to speculate. But if investors are inclined toward risk-aversion, safe, low-interest rate liquidity isn’t an ‘inferior’ asset at all; it’s a preferred one. As a result, creating more of the stuff simply doesn’t promote speculation.
Warning: Federal Reserve easing ahead
It may seem inconceivable to investors that easing by the Federal Reserve could possibly be anything but positive for the financial markets, but that is simply evidence of what Galbraith once called “the extreme brevity of the financial memory.”
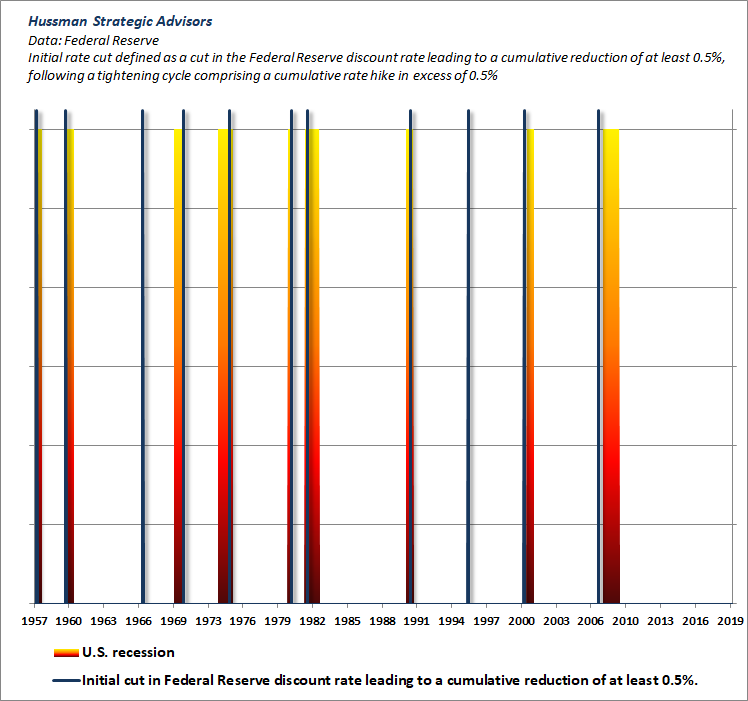
The fact is that with the exception of 1967 and 1996, every initial easing of monetary policy by the Federal Reserve has been associated with an oncoming or ongoing recession. In the chart below, an initial easing is defined as a cut in the Federal Reserve discount rate amounting to a cumulative reduction of at least 0.5%, following a tightening cycle comprising a cumulative rate hike in excess of 0.5%.
My use of the word “warning” here is slightly facetious. I’ve previously demonstrated that there’s virtually zero correlation between the “activist” or “unsystematic” component of Fed policy and subsequent economic outcomes, and I certainly don’t believe that initial Federal Reserve rate cuts somehow cause the associated recessions. But investors should recognize that there is a certain amount of information content in those initial rate cuts. Specifically, when the Federal Reserve shifts from tightening (or normalizing) monetary policy and instead begins a fresh round of rate cuts, it’s a clear indication that something in the economy has gone wrong.
In many prior economic cycles, inflation was often a problem until a recession was well underway, so rate cuts often began after the stock market had lost considerable value. Yet the Fed initiated rate cuts at the very beginning of the 2000-2002 and 2007-2009 bear markets, and persistent easing did absolutely nothing to stop the collapses. Risk-aversion and ragged market internals matter.
Investors should recognize that there is a certain amount of information content in those initial rate cuts. Specifically, when the Federal Reserve shifts from tightening (or normalizing) monetary policy and instead begins a fresh round of rate cuts, it’s a clear indication that something in the economy has gone wrong.
Again, one of the most useful distinctions investors can make is to recognize that the market responds differently to monetary policy, depending on whether investors are inclined toward speculation or risk-aversion. For that reason, it will be essential in the coming years to base our response to monetary policy changes on the prevailing condition of market internals.
We learned the hard way in the recent cycle that we can’t assume that there is any “limit” to speculation. All we can do is to measure those speculative tendencies through market internals, and respond accordingly. On the other hand, when divergence and internal deterioration suggests that investors are inclined toward risk aversion, it’s dangerous to blindly assume that monetary easing has some magical power to support the market.
Blind faith in monetary easing is likely to be the surest path to disappointment over the completion of this market cycle. It bears repeating that even if market valuations retreat to their 2002 levels, the highest valuations levels ever observed at the end of any market cycle, the S&P 500 would plunge by 50%, wiping out every bit of total return that the S&P 500 has enjoyed, over and above Treasury bill yields, all the way back to 2000.
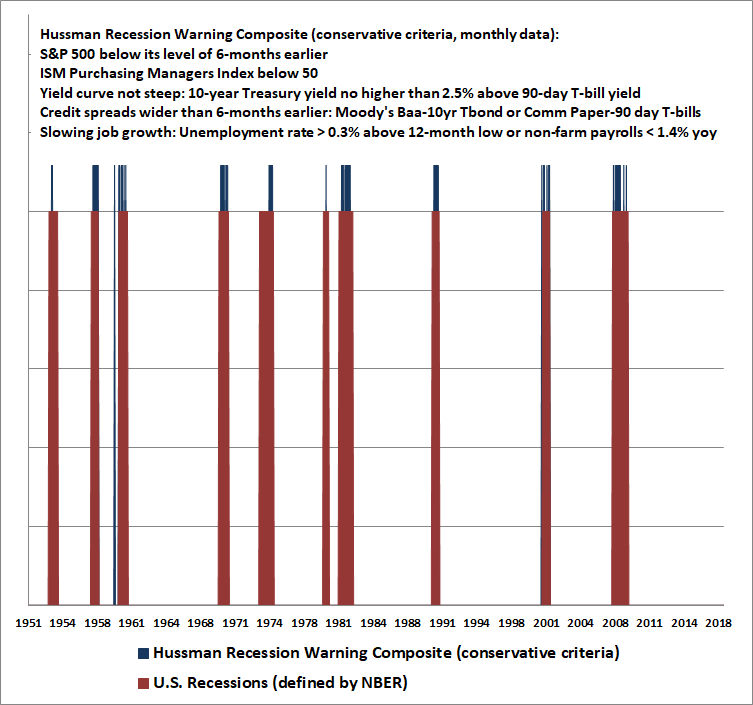
With regard to our own Recession Warning Composite, I noted last month that because employment data tends to lag other economic information, a 10-month decline in regional Federal Reserve and Purchasing Manager surveys tends to be a good indication of an imminent shortfall in job growth from its own 10-month average. On that basis, we projected a steep drop in job creation figures, down to only about 36,000 jobs per month. The May payroll report came in at only 75,000 jobs, versus expectations of over 200,000, and with downward revisions of prior figures, net job growth came to zero. That’s also our rough expectation for the coming two months, which would be enough to drive the year-over-year pace of payroll job growth below 1.4%.
With that, very little other deterioration would be required in order to kick off our Recession Warning Composite, even on conservative criteria that are resistant to false signals. All that would be required at that point would be a decline in the ISM Purchasing Manager Index below 50, from the current level of 52.1, along with a retreat in the S&P 500 below roughly 2700. Suffice it to say that we’re already in the neighborhood of a recession warning, but are not officially expressing that expectation just yet.
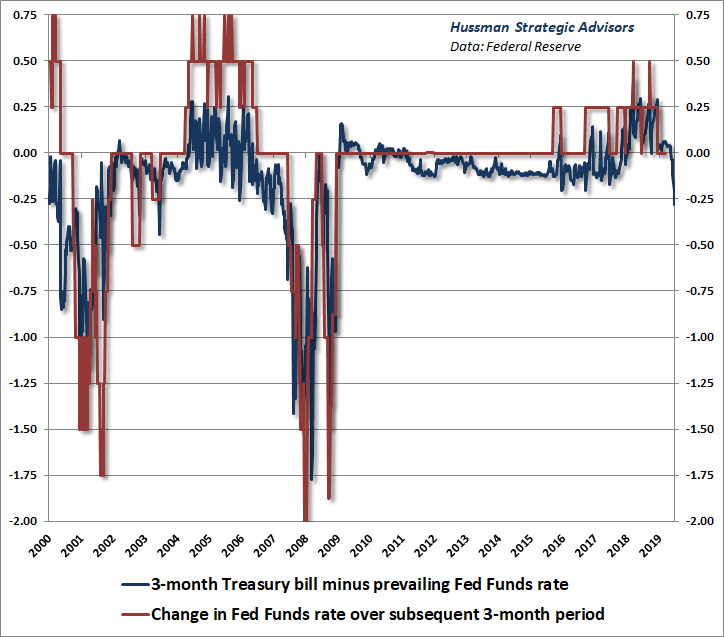
Should investors actually expect a rate cut from the Federal Reserve in the months ahead? In my view, the answer is yes. One of the easiest ways to see this is to compare the prevailing level of Treasury bill yields with the prevailing level of the Federal Funds rate. Notably, Treasury yields are now below the Fed Funds rate by more than 0.25%, and there’s good evidence to indicate that those differences are typically followed by commensurate changes in Fed policy rates over the subsequent 3-month period.
In the short run, investors are celebrating the likelihood of Federal Reserve rate cuts – producing a knee-jerk, obligatory pop in the market. Historically however, initial rate cuts usually mean that something has gone wrong. The misplaced exuberance of investors is something my friend Danielle DiMartino Booth calls a “Recession Party.” We doubt this party will end well. Blind faith that rate cuts are always positive for the stock market is a mistake. This assumption is likely to be the hook that keeps investors holding on through a 60-65% market collapse over the completion of this market cycle.
On the mechanics of monetary easing
A recent Bloomberg article described central bank easing with the phrase “pumping money into the economy.” That’s a misconception. Monetary easing is actually an asset swap. The public was holding savings in one form, and now it holds it in another. The Fed buys Treasury securities from the public, and replaces them with currency and bank reserves (base money) that someone has to hold, at every point in time, until the Fed sells its bonds and retires the cash. All monetary policy does is to change the mix of government obligations held by the public. Only fiscal policy – specifically deficit spending – changes the total amount of those obligations.
Historically, base money has earned zero interest. Forcing people to hold more zero-interest money makes them more eager to chase interest-bearing alternatives. That response made for a very pretty relationship between the ratio of base money / nominal GDP and the level of Treasury bill rates at any point in time. In recent years, the Fed created such a huge pile of zero-interest money that the only way it could raise interest rates, without slashing the size of that pile, was to explicitly pay interest on excess reserves (IOER).
Without IOER, short-term interest rates would only be about 12 basis points here because the Fed’s balance sheet (of Treasury bonds purchased from the public), and the corresponding pile of base money (held by the public instead) is still ridiculously large. If the Fed lowers interest rates today, it won’t be by “pumping money into the economy.” It will simply be by lowering the interest rate it pays on excess reserves. It may even create more reserves by buying more Treasury securities (QE), but again, even that is an asset swap.
Now, if you’re saving for retirement or some other purpose, the fact that you hold bank reserves rather than bonds doesn’t make you suddenly abandon your retirement plans. Nor does all of this unconventional money have much effect on spending in the economy. As I’ve shown before, the trajectory of real GDP growth during every U.S. economic recovery, regardless of the stance of monetary policy, is well described by simple mean-reversion where the “output gap” at the recession low gradually contracts at a rate of about 8% per quarter. It’s not monetary policy that gives you a recovery. It’s time and mean-reversion.
Even boosting the price of financial assets as a result of yield-seeking speculation doesn’t give you much of a wealth effect at all. In fact, except for the early part of an economic recovery or recession, where changes in the S&P 500 are generally just leading indicators of actual economic data (rather than driving economic changes), fluctuations in the S&P 500 have no correlation with subsequent economic activity at all. Economists have known from the time of Modigliani and Friedman that changes in the prices of volatile assets don’t materially affect people’s spending.
Tinkering with security valuations doesn’t create aggregate “wealth” – it simply takes future returns and embeds them into current prices. Long-term “wealth” is largely unchanged, because the actual wealth is in the future cash flows that will be delivered to investors over time, and once a security is issued, somebody has to hold it at every point in time until that security is retired. The only thing elevated investment valuations do is provide an opportunity for current holders to receive a transfer of wealth by selling out to some poor schlub who pays an excessive price for the privilege of holding the bag of low future returns over time.
Tinkering with security valuations doesn’t create aggregate ‘wealth’ – it simply takes future returns and embeds them into current prices. Long-term ‘wealth’ is largely unchanged, because the actual wealth is in the future cash flows that will be delivered to investors over time.
Valuation review
The next few charts offer some long-term perspective on the current hypervaluation of the financial markets. It’s important to emphasize at the outset that valuations are not a timing tool, and that elevated valuations can persist for years, provided that investors remain inclined to speculate. If overvaluation was always immediately resolved by market losses, the market could never have established the hypervaluations of 1929, 2000 and today. So we can’t assume that “overvaluation” means “falling market.” It’s when investors shift toward risk aversion, which we infer from deterioration in the uniformity of market internals, that a trap door often opens, and previously irrelevant hypervaluation suddenly permits a market collapse.
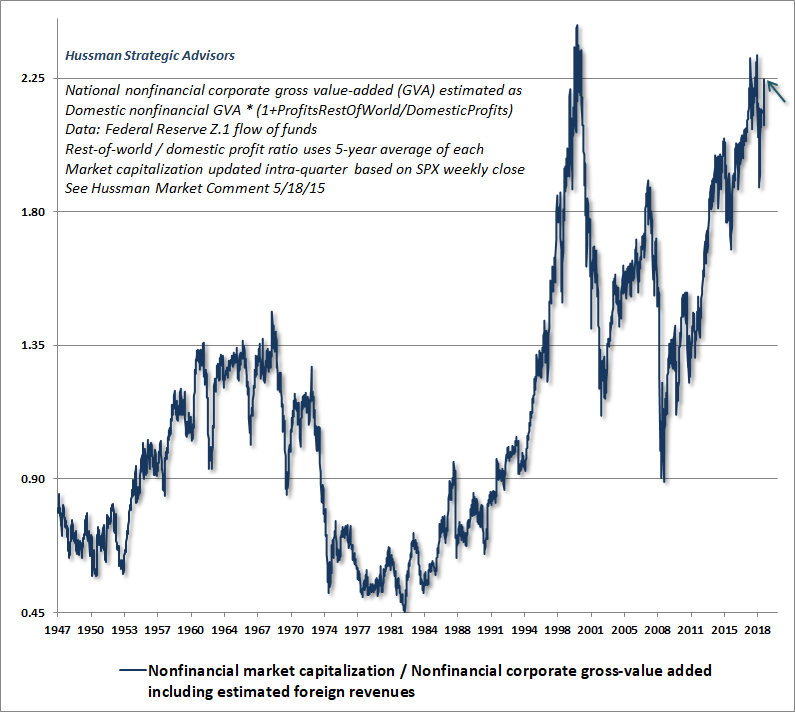
The first two charts show the most reliable valuation measures we follow, based on their correlation with actual subsequent 10-12 year S&P 500 total returns, in market cycles across history. Notably, both measures are substantially more reliable than alternatives such as price/forward operating earnings, the Shiller cyclically-adjusted P/E, and the Fed Model. The chart below shows the ratio of non-financial market capitalization to corporate gross value-added, including estimated foreign revenues, which I introduced in 2015. This measure has a correlation of about 93% with actual subsequent market returns, and behaves essentially as an economy-wide, applies-to-apples price/revenue ratio.
You’ll notice that despite record highs in the S&P 500, the current valuation level of the market is about 3% lower than the valuation level we observed at the September 20, 2018 market peak. That’s both because the broad market has slightly lagged the S&P 500, and also because corporate gross-value added has grown by a few percent over the past year. Still, the 2002 market low was the very highest valuation level ever observed at the end of any market cycle in history, and even that level remains about 50% below present extremes. In order to reach that level of valuation through growth in fundamentals alone (averaging about 4% nominal over the past couple of decades), the market would have to remain unchanged for about 18 years.
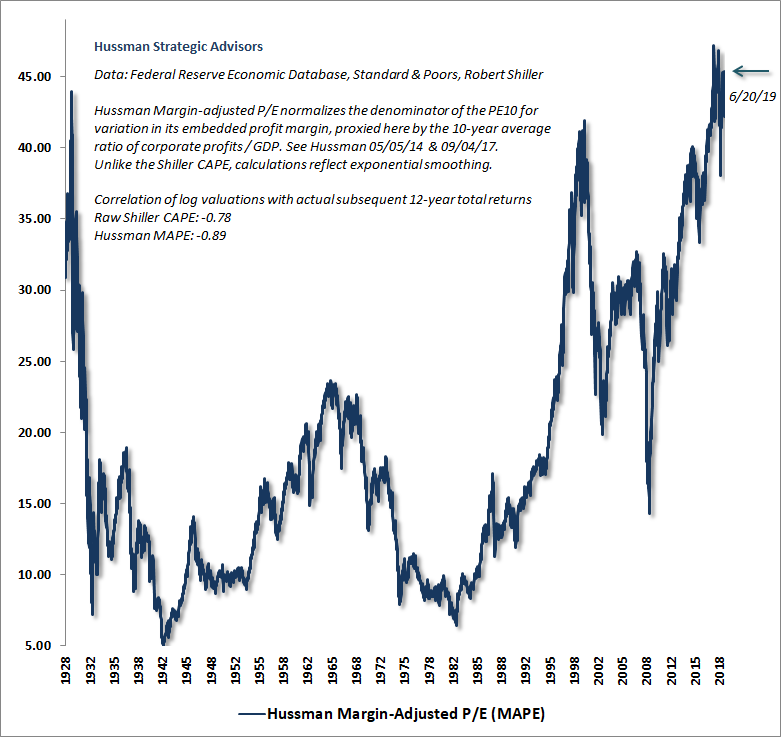
The next chart shows the Hussman Margin-Adjusted P/E, which is just slightly less reliable than MarketCap/GVA, but has the advantage of a data history back to the 1920’s. Note that on this measure, current valuations exceed both the 1929 and 2000 market peaks. Again, it’s possible that we’ll see periodic episodes of speculation that allow hypervaluation to persist without consequence – which is why we constantly have to monitor the condition of market internals. But it’s a mistake to ignore these valuation extremes, or to underestimate the potential market losses that could emerge from these extremes, particularly under present conditions when internals remain divergent and unfavorable.
It’s understandable why investors would want to rule out the possibility of a market decline on the order of 60-65%, simply to restore pedestrian, run-of-the-mill historical valuations. But history has never been kind to the assumption that hypervaluation will be followed by a “permanently high plateau.”
We can’t assume that ‘overvaluation’ means ‘falling market.’ It’s when investors shift toward risk aversion, which we infer from deterioration in the uniformity of market internals, that a trap door often opens, and previously irrelevant hypervaluation suddenly permits a market collapse.
One of the other assumptions that investors are tempted to make is that, because Treasury bond yields are so depressed, stocks must naturally be desirable alternatives. Unfortunately, this belief is based on the quiet assumption that stock market returns are independent of valuations. The reality is that whatever investors have done to drive the bond market higher and bond yields lower, they have already done that, and more, to the stock market.
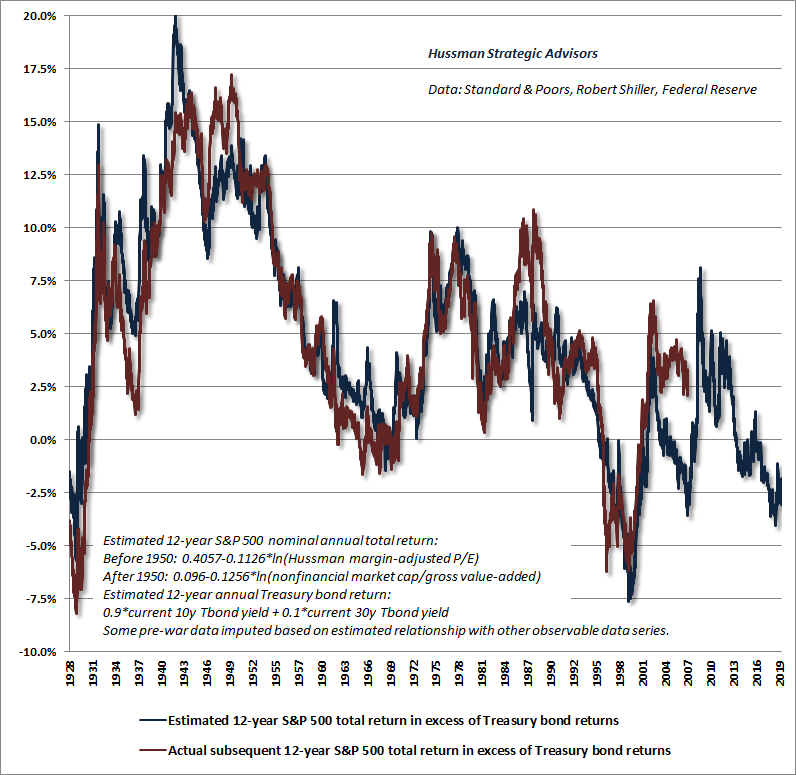
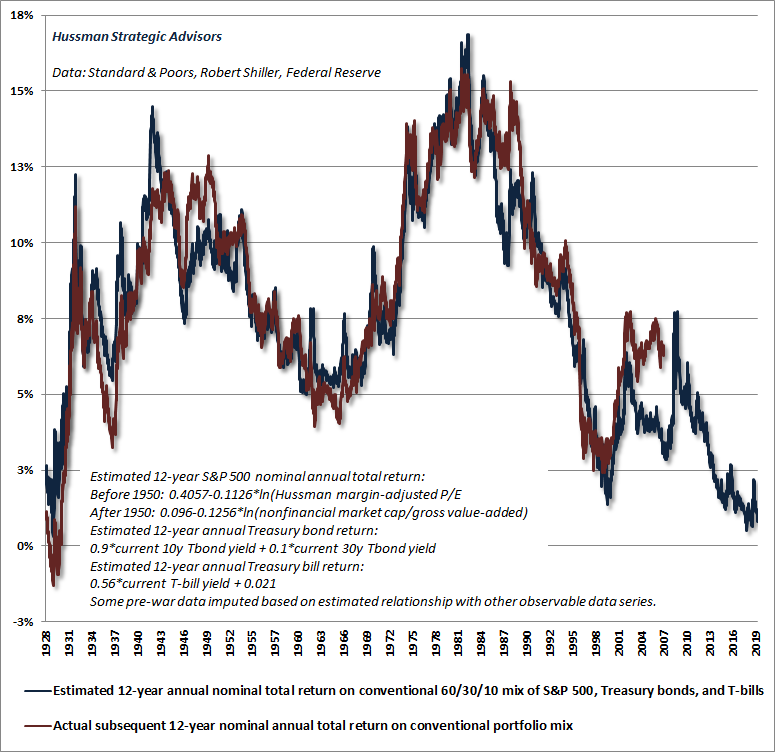
To offer a sense of this reality, the chart below shows our estimate of 12-year S&P 500 total returns in excess of Treasury bond yields. This is sometimes called the “equity risk premium.” While investors seem to assume this is positive, we actually estimate that total returns for the S&P 500 will lag Treasury bond returns by -2.5% annually over the coming 12-year period. That, of course, also implies that on an absolute basis, we expect stocks to post negative total returns over that horizon.
So rather than imagining that bond yields are low, yet stocks are somehow desirable as a result, it’s important to recognize that the combination of low bond yields and record equity valuations is a situation that adds insult to injury for passive investors. Specifically, we currently estimate that a conventional portfolio mix invested 60% in the S&P 500, 30% in Treasury bonds, and 10% in Treasury bills is likely to post a total return averaging only about 0.8% annually over the coming 12-year period. This is the lowest level of prospective returns in history for a conventional asset mix, outside of the lows we observed at the September 20, 2018 market peak, and the weeks immediately surrounding the 1929 market extreme.
Inflation, wage growth, and the Phillips Curve
A striking feature of the recent economic recovery is the tendency to confuse cyclical phenomena with permanent changes in the economy. For example, Wall Street has broadly embraced the proposition that amorphous forces like “technology,” “innovation,” and “harnessing collective intelligence” have somehow produced a world of permanently high profit margins.
The truth is that U.S. profit margins continue to be tightly related to real unit labor costs. In turn, the depressed growth in real wages of recent years has been tightly related to the fact that we had a global financial crisis that drove unemployment to 10%. Now that this employment slack has been taken up, we are finally seeing upward pressure on real wages (that is, wage growth in excess of inflation in overall prices).
This relationship between unemployment and real wages is actually what the Phillips Curve was intended to describe. Yes, I know that economists and central bankers describe the Phillips Curve as a relationship between unemployment and general price inflation. I also know that this “inflation-unemployment tradeoff” is what most of your economics professors taught you in Econ 101, and even in higher level economics classes. That purported tradeoff also underlies the so-called “dual-mandate” of the Federal Reserve. Yet all of that is evidence of only one thing: profound intellectual laziness.
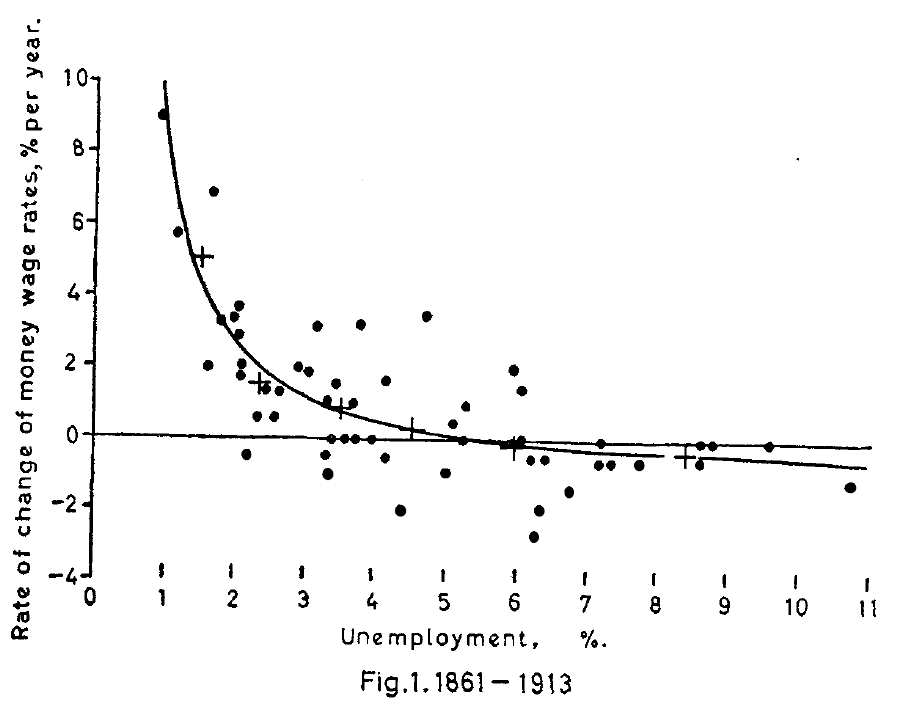
To recognize that the Phillips Curve deals with wage inflation rather than general price inflation, one needs only enough intellectual capacity to read the title of Phillips’ 1958 paper: “The relation between unemployment and the rate of change of money wage rates in the United Kingdom, 1861-1957.”
Realizing that this paper actually deals with real wage inflation, not just “money wage” (nominal) inflation, requires only enough additional intellectual capacity to think critically about the data that Phillips presents. See, Phillips analyzed British data on unemployment and wages, drawn mainly from a period during which Britain was on the gold standard, when general price inflation was relatively muted. That alone should tip one off that Phillips was actually looking at real wages.
But Phillips goes further, and makes the point explicit. Specifically, he observes:
“A third factor which may affect the rate of money wage rates is the rate of change of retail prices, operating through cost of living adjustments in wage rates. It will be argued here, however, that cost-of-living adjustments will have little or no effect on the rate of change of money wage rates except at times when retail prices are forced up by a very rapid rise in import prices.
“The purpose of the present study is to see whether statistical evidence supports the hypothesis that the rate of change of money wages in the United Kingdom can be explained by the level of unemployment and the rate of change of unemployment, except in or immediately after those years in which there was a very rapid rise in import prices.”
Read those words again. Phillips explicitly excludes periods of general price inflation (those associated with a rise in import prices) from his analysis. The result is to effectively ensure that changes in “money wages” are also changes in “real wages.”
What Phillips found was a very fundamental “scarcity relationship.” When unemployment is low, and labor is scarce, the price of labor tends to rise relative to the prices of other things. Conversely, when unemployment is high, and labor is plentiful, the price of labor tends to stagnate or fall relative to the prices of other things. It honestly eludes me how modern economic discourse has become so intellectually lazy that virtually everyone on the planet accepts that the Phillips Curve is a relationship between unemployment and general price inflation, when that misconception can be disabused simply by reading the title of Phillips’ paper, and the legend on his graphs.
The notion that the Phillips Curve describes an ‘inflation-unemployment tradeoff’ is evidence of only one thing: profound intellectual laziness.
Given that the Phillips Curve has nothing to do with a “tradeoff” between unemployment and general price inflation, it’s no surprise that economists have had enormous difficulty identifying a stable relationship between those two objects. In order to patch things up, they’ve resorted to things like “expectations augmented” Phillips Curves and the like, straining to make something defensible out of their original misconceptions.
The fact is that the true Phillips Curve – the scarcity relationship between unemployment and real wage growth – has continued to describe reality perfectly well. The chart below illustrates what I view as a proper interpretation of Phillips’ work, plotting the rate of unemployment versus subsequent real wage inflation (average hourly earnings growth over and above inflation in the GDP deflator).
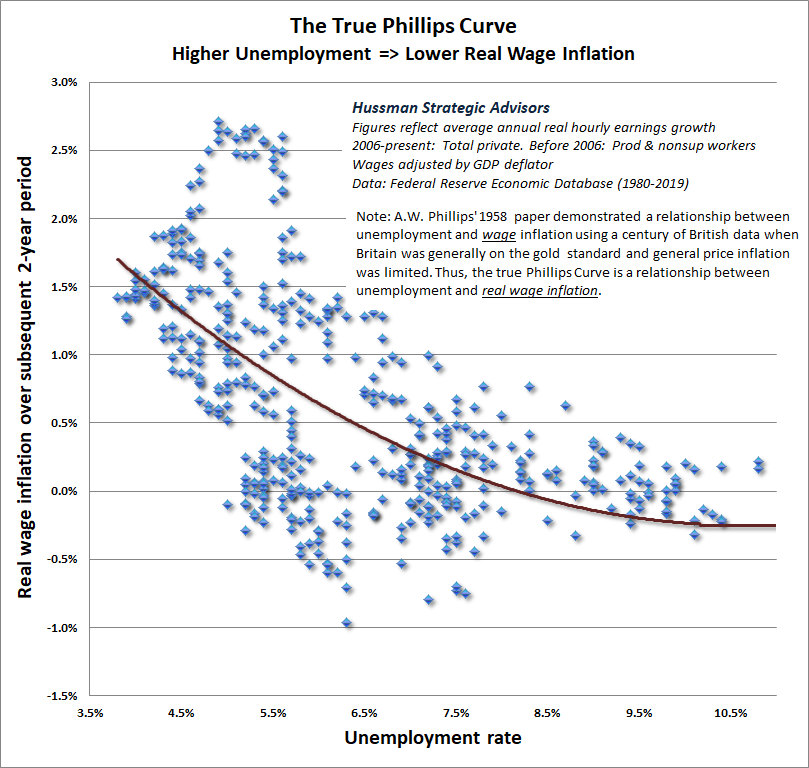
The upshot is that the depressed growth of real wages in recent years has been exactly what one would have expected from a correct interpretation of the Phillips Curve. Low real wage growth was largely a reflection of the high unemployment that emerged during the global financial crisis. With little remaining slack, it’s not surprising that wage growth has begun to outpace general inflation. That’s likely to continue even if general price inflation remains muted a while longer.
The fact is that the true Phillips Curve – the scarcity relationship between unemployment and real wage growth – has continued to describe reality perfectly well.
Having placed real wages in proper perspective, the next question is what the outlook might be for general price inflation. This is another area where investors seem to be confusing cyclical phenomena with permanent changes in the economy. As I’ve noted before, inflation is not simply the result of “money creation.” The reason that quantitative easing didn’t create inflation is because QE itself was just an asset swap – replacing interest-bearing Treasury bonds held by the public with zero-interest base money.
If someone is holding their savings using one asset, and then holds it using a different asset, it doesn’t prompt them to suddenly run to the Best Buy to blow it all on electronics and appliances. QE can certainly encourage financial speculation and “carry trades,” where interest expense is the main cost of doing business, but there’s no reason for that asset swap to produce either real economic activity or inflation.
Instead, inflation emerges when people begin to expect that the currency they are holding will not be accepted by others in the future for the same amount of real goods and services available in exchange for that currency today. The main consideration there, across history and across countries, has been the rate at which the government is creating unbacked liabilities, including both bonds and money, in aggregate. Deficit spending, particularly deficit spending that persistently exceeds sustainable levels, ultimately produces a kind of “revulsion” to accumulating the paper liabilities printed by the government.
There has never occurred a hyperinflation in history which was not caused by a huge budget deficit of the state. Deficits amounting to 40 per cent or more of expenditures cannot be maintained. The examples of both Germany and Bolivia suggest that at least deficits of about 30 per cent or more of gross domestic product are not maintainable since they imply hyperinflation. In all cases of hyperinflation deficits amounting to more than 20 per cent of public expenditures are present.
– Peter Bernholz, Monetary Regimes and Inflation
That’s not to suggest any kind of simple, linear relationship between inflation and deficits or money creation. Just like the pricing of other long-term securities like stocks, the pricing of these pieces of paper we call currency has an enormous psychological component that depends on very long-term expectations. Still, inflation effectively represents a loss of confidence among holders of money that others will ultimately give up their future goods and services for that currency at a rate anywhere close to the current rate of exchange. Mounting government deficits are a key feature of that process, because inordinately large deficits shatter public confidence that the supply of those pieces of paper will be kept in check, relative to the size of the real economy.
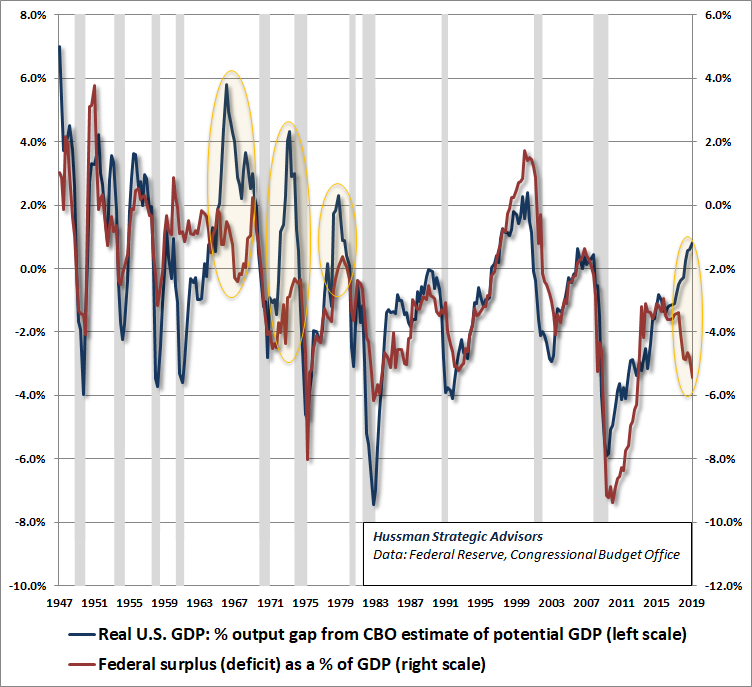
A slight wrinkle here is that one has to think about deficits from the standpoint of the economic cycle. See, government deficits have a fairly consistent relationship with the amount of slack in the economy. When the economy is running far below potential, deficits predictably expand. When the economy is running closer to full capacity, deficits tend to contract or move into surplus. As long as the public is confident about that relationship, large deficits don’t necessarily provoke revulsion. So it’s not just the size of the deficit that matters – it’s the size of the deficit in relation to what one would expect based on the economy’s position in its cycle.
Notably, the points where we’ve observed rapid increases in U.S. inflation – the late 1960’s, the early 1970’s, and again in the late-1970’s, overlap those periods where the U.S. economy was running near full capacity yet government deficits were expanding. Those “cyclically excessive deficits” provoked revulsion by the public and by foreigners, who became unwilling to accumulate an endlessly expanding pile of unbacked government liabilities.
In the late-1960’s, this revulsion was exemplified by the objections of France, which criticized the “exorbitant privilege” that allowed the U.S. to foist dollar liabilities on the rest of the world under the Bretton Woods pegged exchange rate system. Foreign countries insisted on converting their dollars into gold, and by 1971, Nixon closed the gold window, launching an era of floating exchange rates and runaway inflation.
With the U.S. budget deficit pushing deep in the red despite an economy operating at full employment, we’re approaching a similar situation at present.
It’s not just the size of the deficit that matters – it’s the size of the deficit in relation to what one would expect based on the economy’s position in its cycle.
So contrary to the idea that inflation is somehow “dead,” and that government deficits can be endlessly funded by printing pieces of paper that everyone will passively accumulate, my impression is that the coming few years are likely to produce “revulsion” toward an increasing stock of unbacked government liabilities. To some extent, you can see that emerging revulsion in the recent behavior of gold. It’s not something that’s fully taken hold yet, but it will be important to closely monitor the prices of inflation-sensitive assets, including commodities, inflation-protected securities, the U.S. dollar, and other alternative ways of holding purchasing power.
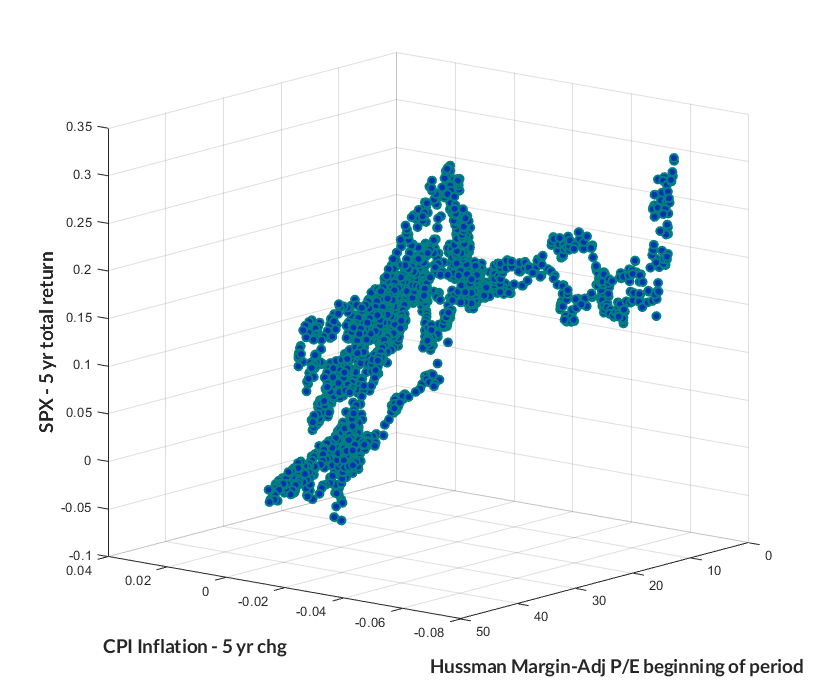
One might expect stocks to be among those alternatives, but the fact is that U.S. stocks rarely do well during periods of rising inflation, largely because inflation causes valuations to collapse even if nominal growth rates increase somewhat. It’s true that hyperinflation of the type observed in developing countries eventually results in rising nominal stock prices too, but that typically doesn’t occur until general prices have already advanced considerably. Given the current valuation of the U.S. stock market, one would need the consumer price index to nearly triple before the positive effects of nominal growth were to overcome the negative effects of normalizing valuations.
That said, asking whether it’s best to hedge inflation with stocks or gold assumes that one investment is always preferred, without considering valuations or market conditions at all. The correct answer is that stocks tend to be an ideal investment when initial valuations are depressed and inflation is falling (as we observed during most of the 1980’s). Conversely, stocks tend to be a dismal investment when initial valuations are elevated and inflation is rising (as we observed repeatedly during the 1970’s). The scatterplot below illustrates this regularity.
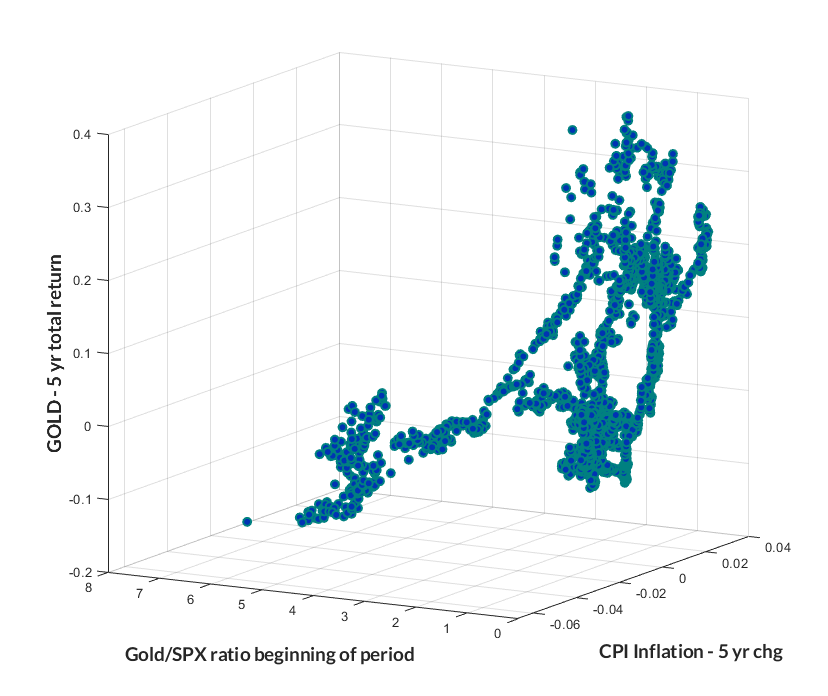
On the other hand, gold tends to be an ideal investment when initial valuations are depressed (for example, when the ratio of gold to the S&P 500 is relatively low) and inflation is rising. Gold tends to be a dismal investment when initial valuations are elevated and inflation is falling. The scatterplot below illustrates this regularity. Presently, the ratio of gold prices to stock prices is the lowest in about 15 years, and is in the lowest quartile of historical data. Given the hypervaluation we observe in the equity market, we would certainly expect gold to perform better than stocks in response to any inflation shock in the next few years.
Points to remember
In summary, several key points will be worth bearing in mind over the completion of this cycle. First, the impact of Federal Reserve monetary policy is wholly dependent on whether investors are inclined toward speculation or risk-aversion, and that inclination is best inferred from market internals. It is incorrect to assume that Fed easing is always “good” for stocks. In fact, with the exception of 1967 and 1996, every initial easing by the Fed has been associated with a U.S. recession. Indeed, the Fed eased at the very beginning of the 2000-2002 and 2007-2009 collapses, and continued to ease the whole way down without effect. Monitoring the status of market internals will be critical in responding to these changes.
Likewise, the impact of hypervaluation on market prospects is also wholly dependent on whether investors are inclined toward speculation or risk-aversion. Hypervaluation can persist for years if investors remain inclined toward speculation, but when deterioration in market internals suggests that investor psychology has shifted toward risk-aversion, a “trap door” can open below the market, and conditions suddenly become permissive of waterfall declines and market collapses.
Our own Recession Warning Composite is not yet active, but we are in the neighborhood. Only modest further deterioration would be required even in conservative criteria that have historically been resistant to false-signals. Given the deterioration we already observe in regional Fed and Purchasing Manager’s surveys, we expect job creation to slow sharply in the coming months, and that may help to contribute to an abrupt shift in investor sentiment. I’ll emphasize again that it is very difficult, psychologically, to sell stocks after they have already had a significant decline. So investors who recognize the current hypervaluation of the market, coupled with already unfavorable market internals, may have little remaining time to align their portfolios with prevailing risks.
Finally, we observe a number of “cyclical” phenomena that have been misinterpreted as permanent features of the economy. One is low real wage growth, and another is low inflation amid aggressively expanding fiscal deficits. A proper understanding of the true Phillips Curve – the relationship between unemployment and real wage growth – fully explains why real wages were stagnant as the economy recovered from 10% unemployment in the financial crisis. With unemployment down to 3.6%, upward pressure on real wages and unit labor costs is likely to weigh on profit margins in the quarters ahead, even in an otherwise slowing economy.
Likewise, the perception that investors will remain willing to accumulate an increasing stock of government liabilities and paper, without inflation pressure, is also an artifact the economic slack that followed the global financial crisis. Recently, we’ve observed much larger government deficits than are consistent with the position of the economy in its cycle, and historically, those “cyclically excessive deficits” have meaningfully provoked inflation pressures. The best indications to watch on this front are generally financial measures that are responsive to inflation, including gold, the U.S. dollar, yields on inflation-protected securities, commodity prices, and related instruments. We don’t see strong pressures quite yet – though gold has perked up considerably – but I do see it as a mistake to assume that inflation is merely a thing of the past.
Keep Me Informed
Please enter your email address to be notified of new content, including market commentary and special updates.
Thank you for your interest in the Hussman Funds.
100% Spam-free. No list sharing. No solicitations. Opt-out anytime with one click.
By submitting this form, you consent to receive news and commentary, at no cost, from Hussman Strategic Advisors, News & Commentary, Cincinnati OH, 45246. https://www.hussmanfunds.com. You can revoke your consent to receive emails at any time by clicking the unsubscribe link at the bottom of every email. Emails are serviced by Constant Contact.
The foregoing comments represent the general investment analysis and economic views of the Advisor, and are provided solely for the purpose of information, instruction and discourse.
Prospectuses for the Hussman Strategic Growth Fund, the Hussman Strategic Total Return Fund, the Hussman Strategic International Fund, and the Hussman Strategic Dividend Value Fund, as well as Fund reports and other information, are available by clicking “The Funds” menu button from any page of this website.
Estimates of prospective return and risk for equities, bonds, and other financial markets are forward-looking statements based the analysis and reasonable beliefs of Hussman Strategic Advisors. They are not a guarantee of future performance, and are not indicative of the prospective returns of any of the Hussman Funds. Actual returns may differ substantially from the estimates provided. Estimates of prospective long-term returns for the S&P 500 reflect our standard valuation methodology, focusing on the relationship between current market prices and earnings, dividends and other fundamentals, adjusted for variability over the economic cycle.