

Navigating Turbulence


John P. Hussman, Ph.D.
President, Hussman Investment Trust
April 2020
As of March 1, 2020, the growth rate of COVID-19 cases in countries other than China is running at 25% daily. The expansion in the number of locations is also problematic, because the first person in each new location is local ‘patient zero.’ Unless serious containment efforts reduce this growth rate substantially, a continuation would produce a 1000-fold increase in cases over the coming month. Even that might not seem so bad, until the end of April, when the same rate of growth would push the number of COVID-19 cases beyond the 45 million U.S. flu cases observed in 2017-2018. That is exactly how this little coronavirus with twice the R0 of the seasonal flu, and a mortality rate that is evidently an order of magnitude higher, will produce utter chaos if containment efforts are not taken seriously.
– John P. Hussman, Ph.D., March 1, 2020
Public health notes
I want to begin with an update and extension of observations and analysis relating to SARS-CoV-2 (COVID-19) that I’ve included in these commentaries since January. As usual, I’ll try to separate my comments about this epidemic from investment discussion as much as possible.
As March began, there were 68 U.S. cases of SARS-CoV-2 (COVID-19). At present, less than a month later, there are over 68,000. Though containment efforts were broadly dismissed early in the month, they have become more pointed in the past two weeks, particularly in certain states like New York. Even with a 1000-fold increase in cases during March, several corners of the media characterize containment efforts as an overreaction, and describe this epidemic as “like the flu.”
We still have a chance of limiting the number of fatalities that result, but not with dismissive approaches to containment, which I view as menacing to public health.
A few observations regarding the public health implications surrounding the novel coronavirus may be helpful (see some of my research papers, this article in Nature for example, to assure yourself that I’m not shooting wildly from the hip).
First, this is not influenza (the “flu”). It’s actually a novel variant of SARS. The proper name of this virus is SARS-CoV-2 (severe acute respiratory syndrome coronavirus 2), and the associated disease is called COVID-19 (coronavirus disease 2019). As the name implies, SARS-CoV-2 can, in its severe cases, produce acute inflammation of the respiratory system, which is the typical cause of fatalities.
Outside of China, daily case growth has eased to 15% since January, down from 25% in early-March as a result of strong global containment efforts. In the U.S., case growth has averaged over 30% per day during March, but shorter-term compound growth has recently dipped to 29% a day.
With over 68,000 U.S. cases already, even if present containment efforts were to immediately crush the growth rate to just 10% per day, the U.S. will exceed one million cases during April. Needless to say, that’s a narrow window to boost equipment, personnel and capacity. Reducing case growth to a 15% rate would put U.S. cases over 4.5 million in 30 days, potentially with hundreds of thousands of fatalities. We need these numbers to be wrong, and that’s exactly why containment is critical. Lack of containment is exactly what produces 30 million U.S. influenza cases every year, though with a far lower fatality rate than SARS-CoV-2.
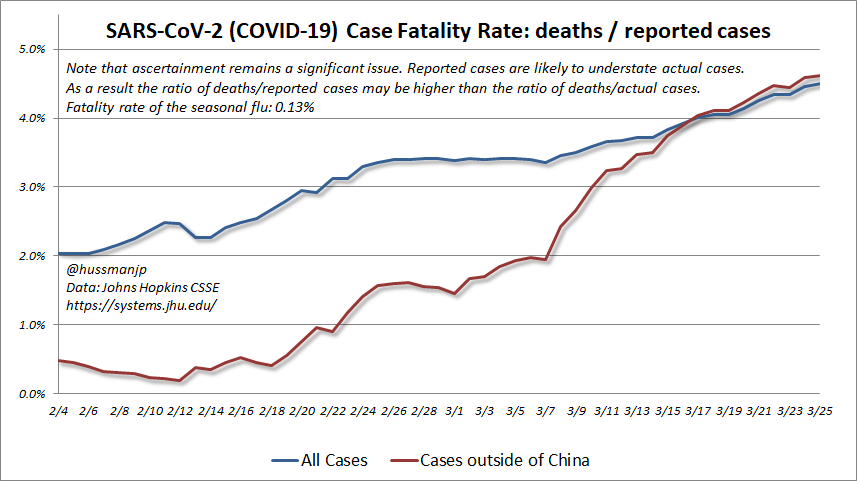
It’s common to quote a 2% fatality rate, but the observed case fatality rate (CFR) of SARS-CoV-2 is actually now 4.5% (fatalities/reported cases). By comparison, the fatality rate of the seasonal flu is just 0.13%.
While I strongly believe that the true fatality rate of SARS-CoV-2 is many times the rate for influenza, I don’t believe that 4.5% is the actual number because there are clearly lots of cases that are unreported, and many are likely to be “sub-clinical,” meaning that they may not show symptoms. The problem is that regardless of whether you’ve got a high fatality rate and a smaller number of cases, or a small fatality rate with a larger number of cases, the number of fatalities is exactly the same. Emphatically, the “ascertainment rate” (reported cases/true cases) cancels out in that calculation.
So while reported cases depend on ascertainment, fatalities are “sufficient statistics” in themselves. Indeed, my impression is that the CFR has been trending higher precisely because reported cases are increasingly lagging actual cases. That’s good in the sense that the true fatality rate is probably much lower than the observed CFR, but it’s bad in the sense that true cases are probably growing much faster than we think. In any case, to dismiss the growing number of fatalities based on the idea of “unreported cases” is to lack an understanding of this arithmetic.
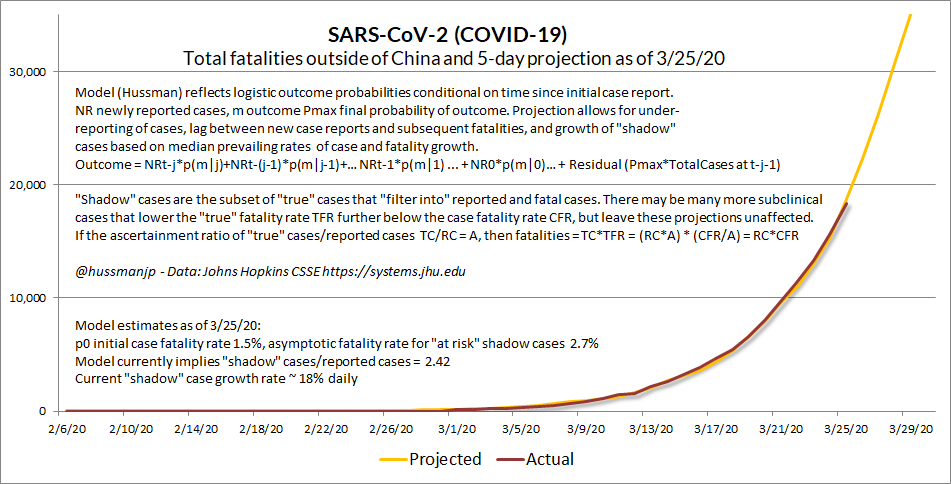
The chart below shows the best model I’ve developed to project near-term risks here, and help to gauge whether we’re successful in “flattening the curve.” This a bit do-it-yourself, because there seem to be more unobserved confounding factors in this real-life situation than deterministic models (e.g. SIR) include.
In my view, the most reasonable interpretation of the data is that the uptrend in the case fatality rate largely reflects an increasing ratio of unreported “shadow” cases/reported cases. Part is also due to lags – fatalities typically lag new case reports by several days.
My hope is that we’ll see a sharp flattening of this curve. Specifically, it would be encouraging to see both a flattening of the “projected” curve, and a divergence where “actual” fatalities begin to fall increasingly short of projected ones (which could occur, for example, if alternative therapies were working, or acute care was becoming more successful). Again, however, even a substantial reduction in growth will still produce a challenge for the U.S. health system, and it’s best to do everything possible on the equipment, therapeutic (including antibiotics for secondary infection), and personnel front.
The seasonal flu produces so many fatalities primarily because it emerges in constantly varying strains, each which tends to be poorly contained. In a given year, a median of 30 million Americans are infected by the seasonal flu, with a median of about 38,000 fatalities. The worst episode in the past decade, according to data from the Centers for Disease Control and Prevention (CDC), was the 2017-2018 season, with an estimated 45 million cases, and 61,000 fatalities.
COVID-19 differs from the seasonal flu not only in its mode of infection (ACE2 binding) and fatality rate, but in its relatively high reproductive rate R0, estimated to be about 2.6. That figure represents the average number of people that contract the virus through contact with someone who already has it. By comparison, the R0 value for seasonal flu is only about half that rate.
To put R0 into perspective, in order for the number of cases to stabilize, approximately 1-1/2.6 = 62% of potential contacts (I prefer not to use “herd”) must either be immune or contained once a new transmission “hub” emerges. That’s why containment efforts need to be taken so seriously.
Provided that containment efforts are strong, the total number of cases can be expected to follow a “logistic” growth trajectory, where the growth rate of new cases progressively declines toward zero as the total number of cases stabilizes. Without strong containment, the total number of cases would follow an “exponential” growth trajectory more closely.
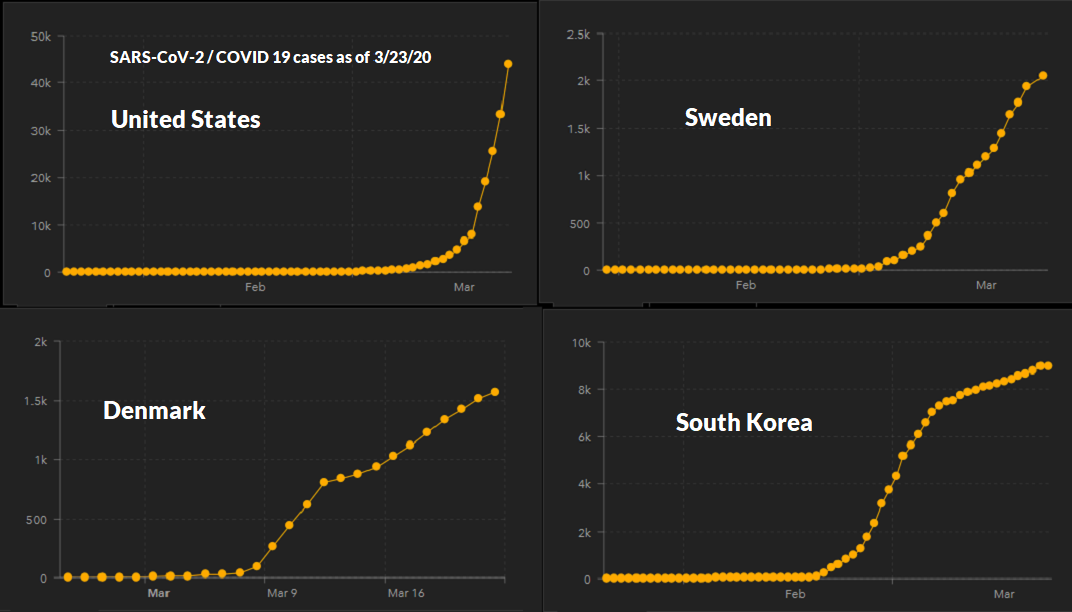
I detailed the difference between these trajectories in prior comments. We’re now at the point where we have numerous real-life examples. In South Korea, for example, our son Mike has been working from his apartment for nearly two months. By March 9, the country had processed nearly 200,000 tests – the highest level of testing per-capita in the world. By comparison, The U.S. had run just 1700 tests by that time, and because the idea of purchasing tests from foreign countries was rejected in preference for creating our own (other remarks withheld), these tests did not yet work. Meanwhile, Sweden and Denmark were among the first countries to suspend large gatherings.
The panel below shows the effect of these varying levels of containment effort.
The challenge is that SARS-CoV-2 is not a thunderstorm that will just pass overhead and go away in a couple of weeks. There was far too much unmonitored and untested seeding of individual nodes all across the country before containment was taken seriously, and case transmission remains loosely monitored. In contrast, to quote the American Association for the Advancement of Science:
China “rolled out perhaps the most ambitious, agile, and aggressive disease containment effort in history. The most dramatic—and controversial—measure was the lockdown of Wuhan and nearby cities in Hubei province, which has put at least 50 million people under a mandatory quarantine since 23 January. There’s uncertainty about what the virus, dubbed SARS-CoV-2, will do in China after the country inevitably lifts some of its strictest control measures and restarts its economy. COVID-19 cases may well increase again.”
Wuhan will lift its lockdown on April 8, on the tentative assumption that all of the 67,800 cases identified there, if not fatal, have recovered – leaving no active cases to be transmitted. Needless to say, this move will need to be coupled with continued monitoring and testing of any new cases and their contacts.
It’s worth repeating that every case in a separate location is local “patient zero.” The initial immunity of each of their contacts is also zero. In order to stop transmission more than temporarily, and without allowing 1-1/R0 ~ 62% of the population to become infected and then either die or become immune, we need to a) wait until currently affected cases fully resolve to an outcome, which takes ~40 days (see my SARS-CoV-2 Twitter thread on this) and; b) build our public health capacity to the point that we can test, monitor, and contain every new U.S. case, as well as the contacts of each.
For now, what we’re really doing is buying time to prevent a catastrophic burden on our health care system, and to allow sufficient knowledge discovery to repurpose existing pharmaceuticals (a vaccine isn’t likely to complete safety and efficacy testing for nearly a year).
It’s also worth repeating that SARS-CoV-2 is not “the flu.” We don’t know when or even if the virus will have any seasonal dip in contagiousness, but the Harvard Center for Communicable Disease Dynamics suggests “it is not reasonable to expect these declines alone to slow transmission enough to make a big dent.” Regarding the first variant of SARS, Marc Lipsitch, the Center’s Director adds, “SARS did not die of natural causes. It was killed by extremely intense public health interventions in mainland Chinese cities, Hong Kong, Vietnam, Thailand, Canada and elsewhere. These involved isolating cases, quarantining their contacts, a measure of ‘social distancing,’ and other intensive efforts.”
Unless SARS-CoV-2 suddenly goes dormant, we’re not all going back to work in April. Not without immediately rekindling the growth rate of cases, with hundreds of thousands of U.S. fatalities and – if we’re not serious about this – substantially more than that.
Because the rate of change in all of this is too rapid for monthly updates, and because nearly every waking hour outside of investment work is spent in research and correspondence on the public health, biological, and public policy aspects of this crisis, I’ve taken to posting most of my brief day-to-day observations on my personal Twitter feed (https://twitter.com/hussmanjp). I’ve also posted my notes relating to the biological pathway and potential risk-genotypes for the benefit of the research community.
Please note that a) this is my personal feed, so there’s a wide range of topics (including finance, charitable work, and the occasional celebration of 70’s pop music); b) I can’t discuss our investment funds; and c) unkindness to others (including cheap shots at me) will just block the account.
Understanding market volatility
A market crash is simply a low risk-premium spiking higher. That’s not hyperbole, and it’s not a market call. It’s just a fact. As I’ve noted in previous market cycles, every market crash is always driven first and foremost by a spike in risk premiums. During the 2000-2002 market collapse, I wrote: ‘Remember that favorable trend uniformity is essentially a signal that investors have a robust preference for taking risk. Right now, there is no evidence of the sort. In a market with razor thin risk premiums, any increase in risk aversion can lead to spectacular price declines.’
– John P. Hussman, Ph.D., February 25, 2000
A share of stock is nothing but a claim on a very long-term stream of expected future cash flows that will be delivered into the hands of investors over time. If a security is expected to deliver a single $100 payment, a decade from today, the return that investors can expect is directly related to the price they pay.
If investors pay $27 today for an expected future payment of $100 a decade from now, they can expect an average return of about 14% annually on their investment, provided that the $100 future cash flow is actually delivered.
If investors pay $39 today, they can expect an average return of about 10% annually.
If investors pay $56 today, they can expect an average return of about 6% annually.
If investors pay $82 today, they can expect an average return of about 2% annually.
If investors pay $100 today, they can expect an average return of zero.
If investors pay more than $100 today, they can expect to lose money for more than a decade.
The basic arithmetic that relates future cash flows, long-term returns, and current prices together is called “discounting.” For example, show me a security that will provide a $100 payment in 10 years, and tell me you need an expected return of 8%, and I can calculate the price: $100/(1.08)^10 = $46.32.
Conversely, tell me that the security is currently priced at $46.32, and I can estimate that the 10-year expected annual return is ($100/$46.32)^(1/10)-1 = 8%. Again, all of this assumes that the future cash flow will actually be delivered. Since there’s some uncertainty there, investors usually demand a “risk premium” well above the interest rate on Treasury bonds.
If investors drive valuations high enough to “price in” zero or negative returns, any substantial increase in the expected return demanded by investors will result in a price collapse. Value a security for extremely high returns, and any decline in the expected return demanded by investors will result in a price advance.
Here’s the thing. Given that a share of stock is a claim on decades and decades of discounted future cash flows, even entirely wiping the first year or two of cash flows does very little to the value of all those remaining cash flows.
But value that very long-term stream of future cash flows at extreme prices that imply zero returns, and even a modest increase in the expected return demanded by investors will trigger breathtaking losses.
That’s exactly what happened last month. When it comes to the financial markets, we don’t even need to talk our public health crisis, or build scenarios around it. We all just need to understand what the word “investment” actually means.
As I noted in February, “I continue to expect the S&P 500 to lose about two-thirds of its value over the coming years. Avoiding profound market losses over the completion of this cycle would require a permanently high plateau in valuations, at their present hypervalued extremes, and the absence of even one episode of significant risk-aversion in the future.”
What we’re seeing today in the financial markets is just an initial episode of significant risk aversion.
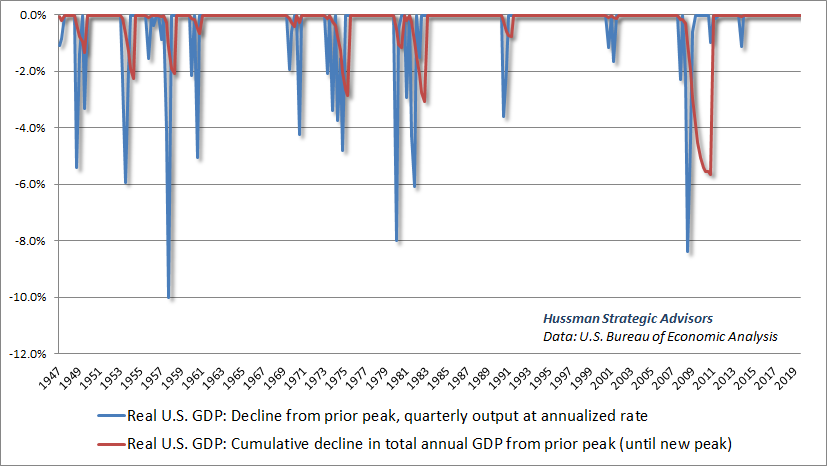
It’s worth noting that the deepest economic decline since the Great Depression involved a cumulative decline of 5.6% of annual real GDP. It’s difficult to imagine that this downturn will be smaller. Still, stocks are claims on decades and decades of future expected cash flows. Even if earnings are clobbered over the coming year, that’s a very small fraction of the entire stream.
What’s likely to do harm to investors over the completion of this market cycle isn’t the impact of a year or two of lost cash flows. The likely source of actual damage is the roughly 65% loss in value (from the February high) that would be required simply to bring the most reliable valuation measures to their run-of-the-mill historical norms. The extreme financial valuations that preceded this crisis have made substantial additional stock market losses likely.
The other source of potential disruption will be a certain amount of bankruptcy that was largely baked in the cake, as years of Fed-induced yield-seeking speculation enabled companies to issue a mountain of junky paper in the form of BBB bonds, leveraged loans, and covenant-lite debt.
Though I was never a fan of recapitalizing the banking system after the global financial crisis by starving investors of safe yield, the bright spot is that the March 2009 accounting change to FAS 157 (mark-to-market) – which was really what ended the Global Financial Crisis – may reduce the likelihood of similar bank failures during the present crisis. That’s because even if the bond markets become distressed, banks will not have to mark their securitized loans to prevailing market prices if they reasonably expect the underlying borrowers to be solvent on the other side. In a crisis like this one, it’s good to have a bright spot.
Three considerations to know
The more glorious this bubble becomes in hindsight, the more dismal future investment returns become in foresight. The higher the price investors pay for a set of future cash flows, the lower the return they will enjoy over time. Investment is not independent of price. Whatever they’re doing, it’s not ‘investment.’ Presently, we observe the combination of hypervaluation and negative market internals, which I view as a ‘trap door’ situation.
– John P. Hussman, Ph.D., January 30, 2020
I’ve often observed that while we consider a very broad range of market conditions, a few factors have a particularly strong place in our investment discipline, particularly 1) valuations, and 2) market internals. To a lesser degree (especially since late-2017) we can also add 3) overextension.
Valuations
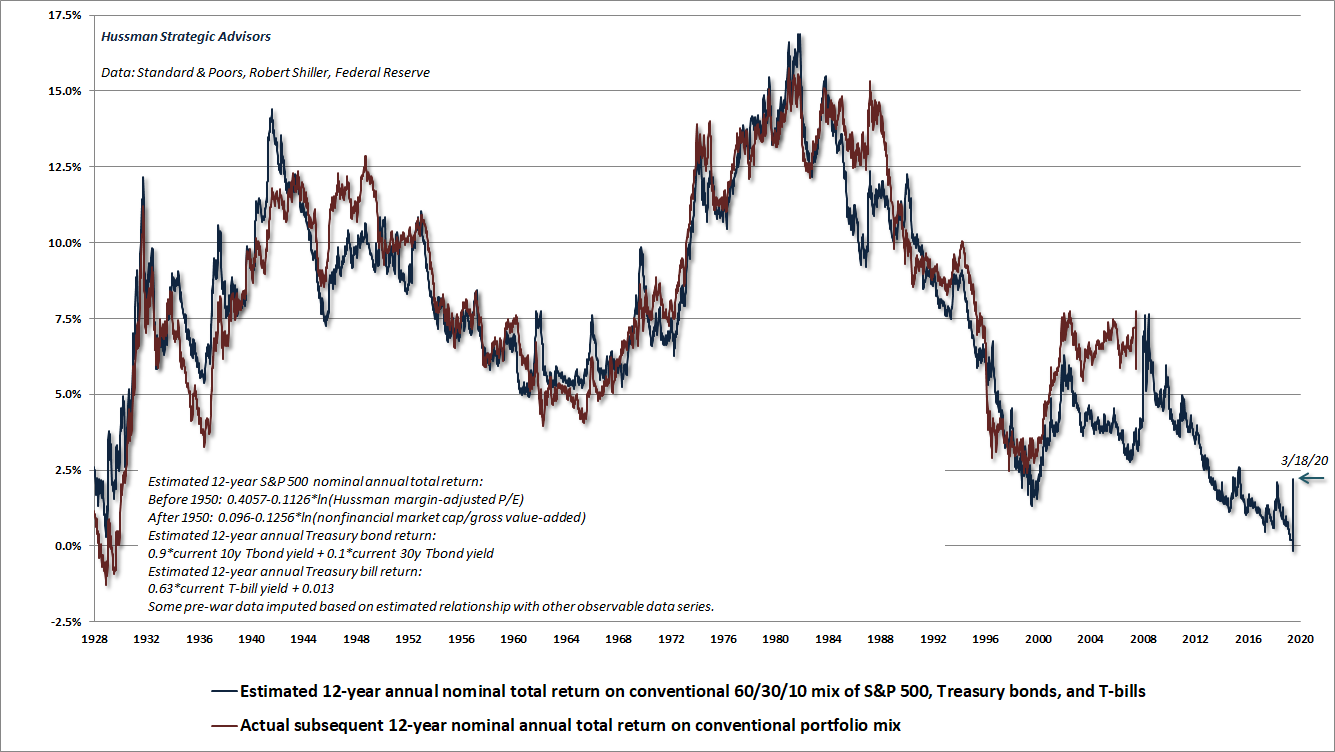
Valuations provide a great deal of information about long-term investment prospects, as well as the extent of potential market losses over the completion of a given market cycle. The chart below, for example, shows our estimate of likely 12-year average annual nominal total returns for a conventional portfolio mix invested 60% in the S&P 500, 30% in Treasury bond, and 10% in Treasury bills. I noted in mid-February that this estimate had declined below zero for the first time in history. Even the September 1929 market extreme did not do that. The little arrow at the right side of the chart shows the impact of the recent market selloff on these return prospects (as of 3/18/20 at about 2400 on the S&P 500).
Market internals
Of course, if overvaluation alone was enough to drag prices lower, we would never observe hypervaluation like 1929, 2000, and February 2020, because those market advances would have been weighted down at much lesser extremes. Likewise, if undervaluation was enough to drive prices higher, we would never observe secular valuation lows like 1949, 1974 or 1982.
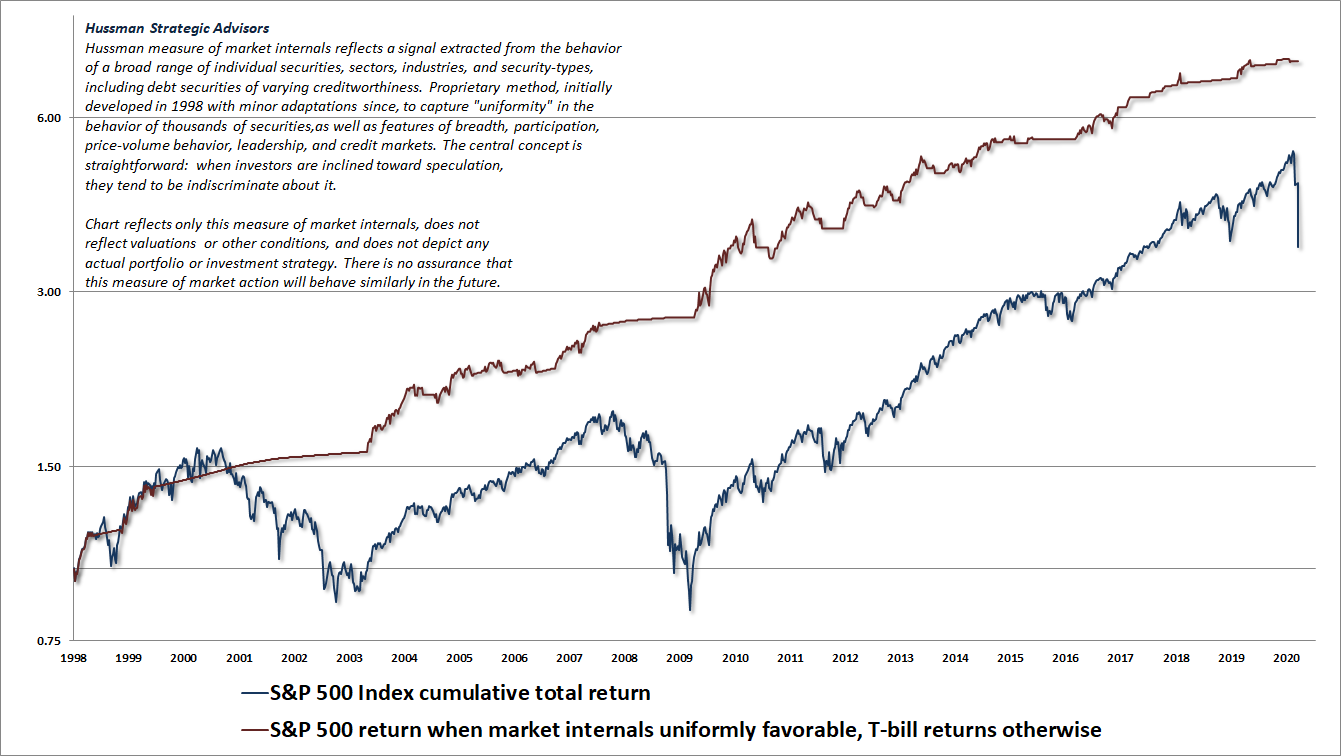
Instead, what drives market returns over shorter segments of the market cycle is the extent to which investor psychology is inclined toward speculation or risk-aversion. Since speculation tends to be indiscriminate, and risk-aversion tends to be selective, we find that the best gauge of investor psychology is the uniformity or divergence of prices across thousands of individual securities, industries, sectors, and security-types, including debt of varying creditworthiness. I describe this sort of uniformity with the term “market internals.”
The chart below presents the cumulative total return of the S&P 500 in periods where our measures of market internals have been favorable, accruing Treasury bill interest otherwise. The chart is historical, does not represent any investment portfolio, does not reflect valuations or other features of our investment approach, and is not an assurance of future outcomes.
Overextension
A third consideration is the extent to which market action is “overextended” in one direction or another. These measures include gauges of overbought/oversold conditions, as well as broad syndromes that combine extremes in valuation, investor sentiment, and price action. In other market cycles across history, for example, extreme combinations of “overvalued, overbought, overbullish” conditions were usually followed by abrupt air-pockets, panics, or market crashes.
Several instances of severe compression have emerged in recent weeks, one which prompted my March 1 interim comment Clearing Rallies and Crashes (Buckle Up) and was immediately followed by a scorching “fast, furious, prone-to-failure” clearing rally. Because investment conditions have been more volatile and time-consuming than more frequent market commentaries allow, I’ve tried to post general short-term financial market observations to my personal Twitter feed (https://twitter.com/hussmanjp). Again, I cannot respond to questions about our investment funds on that platform.
Though measures of “overextension” can be useful, we’ve abandoned our willingness to place these overextended “limits” above the condition of market internals – regardless of whether the market is overextended on the upside, or the downside. The main feature of the recent bull market that was truly “different” from history was this: once the Federal Reserve drove interest rates to zero, investors became willing to speculate regardless of overextended conditions, however extreme.
In late-2017, I finally threw up my hands and abandoned the idea that there was any reliable “limit” to speculation at all, and we adapted our investment strategy accordingly. While sufficiently extreme conditions can still justify a neutral market outlook, we no longer adopt or amplify a bearish outlook unless our measures of market internals are explicitly unfavorable.
Navigating turbulence
I expect that the most valuable aspect of our investment discipline over the completion of this cycle will be our ability and willingness to flexibly respond to changes in observable market conditions as they emerge. While my impression is that passive investment strategies will become nearly excruciating over the completion of this cycle, there’s no need to worry about various scenarios, to project targets, to predict market movements, or to become tied to any particular forecast about future economic or financial events. This is not about prediction, and projection, and forecasting. What’s needed is the ability and willingness to flexibly respond to changes in observable market conditions as they emerge.
Those changes will take several forms, and because they often compete, several principles are essential. What follows isn’t so much investment advice – investors can do what they wish – but a general description of how I think about our investment discipline.
First, neither valuations nor overextended conditions create “floors” or “ceilings” for the market. Our investment discipline has admirably navigated decades of market cycles, but my belief in overextended speculative “limits” was very detrimental in this one. Learn what we learned.
It’s true that lower valuations are better, in the sense that investors can have more confidence (but not assurance) that any near-term losses will recovered. Extreme valuations – like those we observed at the February highs – mean that investors might have to wait more than a decade to break even after a substantial market loss (see Going Nowhere in an Interesting Way for a detailed historical analysis of this point). In either case, it’s best to operate on the idea that there is no such thing as a floor or a ceiling.
Second, the condition of market internals helps to set the “boundaries” of our investment stance. If internals are unfavorable, it’s best to avoid a fully-unhedged position, much less a leveraged one. Some conditions might warrant a generally constructive outlook with a “safety net.” But to use current market conditions as an example, I would consider it terribly imprudent to step into an unhedged position, in a still-overvalued market with unfavorable market internals, just because short-term market action is highly oversold.
Conversely, the central adaptation to our investment discipline in recent years (late-2017) rules out adopting or amplifying a bearish market outlook – regardless of overbought extremes – when our measures of market internals are still favorable.
Finally, extremely overbought conditions can warrant a neutral market outlook even when market internals are positive, and oversold conditions can warrant a constructive outlook (with a safety net) even when market internals are negative. Again, however, just as I rule out adopting a bearish outlook when market internals are positive, I would also rule out adopting a leveraged or fully-unhedged outlook when market internals are still negative.
While my impression is that passive investment strategies will become nearly excruciating over the completion of this cycle, there’s no need to worry about various scenarios, to project targets, to predict market movements, or to become tied to any particular forecast about future economic or financial events. This is not about prediction, and projection, and forecasting. What’s needed is the ability and willingness to flexibly respond to changes in observable market conditions as they emerge.
The most positive and the most negative market conditions we identify typically occur when all of these components are aligned. For example, as I noted in February, the combination of a hypervalued market with divergent internals and extreme overextension increasingly suggested the likelihood of what I described as “trap door” market losses. Conversely, the combination of depressed valuations with fresh improvement in market actions following oversold conditions is typically what we observe at the beginning of a new bull market. Despite my mislabeled identity as a “permabear” (largely as a result of my admitted and addressed error in the recent bull market), the fact is that I’ve adopted a constructive or leveraged market outlook after every bear market collapse in over three decades.
What now?
A good way to place market fluctuations into perspective, is to think about them from the standpoint of long-term, intermediate-term, and short-term conditions. Those considerations are nicely captured by the central components of our investment discipline. Valuations are extremely informative about long-term returns and full-cycle risks. The condition of market internals is an essential gauge of speculation vs. risk-aversion across shorter segments of the market cycle. And extremely compressed “oversold” conditions or extremely overextended “overbought” conditions are often helpful in gauging the potential for short-term clearing rallies or air-pockets (again, the condition of internals should limit one’s bullish or bearish response to these).
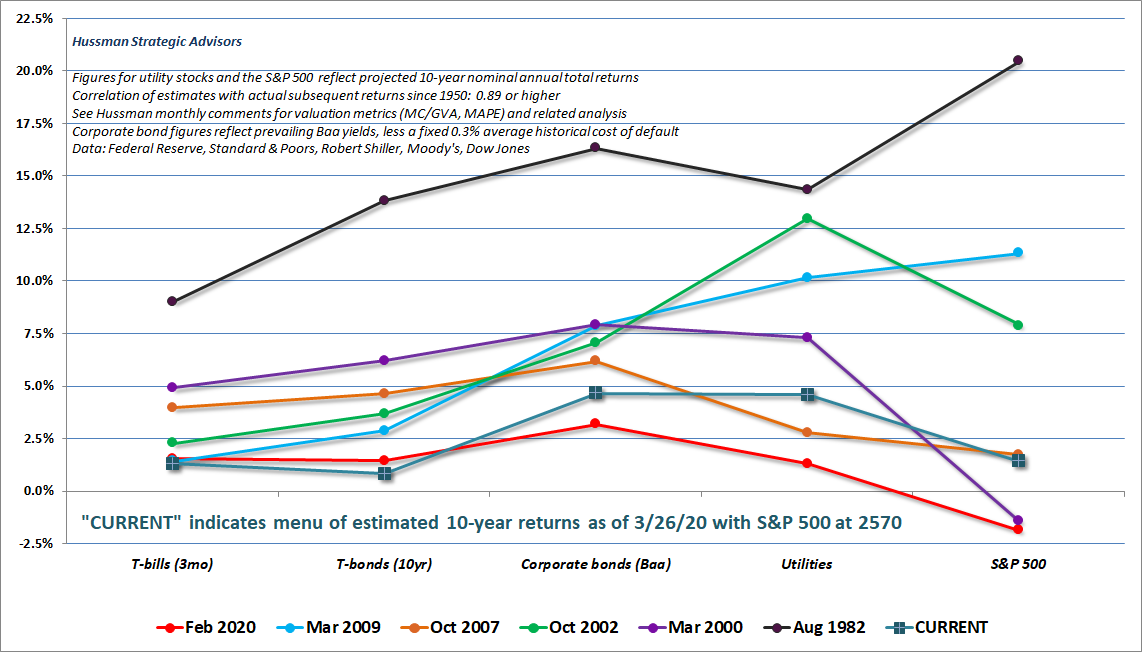
If you’re a long-term investor, the recent decline has pushed likely 10-12 year S&P 500 total returns back above zero (they were negative in Feb). The “CURRENT” line is based on prevailing valuations as of 3/26/20, with the S&P 500 at 2570 intraday. For investors who are comfortable with estimated 10-year SPX returns of about 1.4% annually, we’re here. While this estimate is better that the S&P 500 prospects we estimated, in real-time, at both the 2000 and recent February market extremes, S&P 500 valuations are presently similar to those at the 2007 market peak, and still far from what we’ve typically observed at cyclical lows.
From an intermediate standpoint, when investors are inclined to speculate they tend to be indiscriminate about it. Ragged, divergent action here reflects risk aversion. At present, our measures of internals remain unfavorable on this front. That may change, but given still rich valuations from a historical perspective, an improvement in internals would most probably encourage an investment outlook that might best be described as “constructive with a safety net.” Opportunities to embrace market exposure without hedges, or even using leverage, will likely arrive at substantially lower valuations.
From a short-term perspective, we’ve observed several instances of “short-term compression” in recent weeks, which are often permissive of fast, furious, “clearing rallies” to reduce that compression. I say “permissive” because while compression often permits scorching rallies, there’s absolutely no assurance that an oversold market will not become decidedly more oversold. I’m concerned and frankly distressed here that the current drivers of risk aversion continue to increase exponentially. It’s not at all clear to me that investors have fully accounted for what this is likely to mean for the economy or life as they know it, particularly over the coming months (not weeks). For my part, I’m encouraged when my work is helpful to others, but anyone who imagines that I take joy in this environment has utterly no concept of who I am.
Review all investment exposures
I’ve been asked whether it is “too late” to adopt a defensive stance. That’s a difficult question, but it’s also one that’s worth addressing.
First, “panic selling into a decline” is typically an action that ignores valuations and likely future returns.
Nobody should do that.
However, to the extent that an investor has more exposure than appropriate (for example, as the result of holding an investment position that could not actually tolerate a further 50% market loss without devastating one’s retirement plans), and provided that an investor fully considers the prevailing level of valuations and the associated level of estimated future returns, then yes – my view is that any inappropriate exposure should be corrected – ideally on strength – sooner rather than later.
That doesn’t mean “sell.” That means examine your risk exposure based on your own risk-tolerance, your own investment plans, and the potential market loss that would be required to draw valuations to run-of-the-mill historical norms. See my recent monthly market commentaries for more detail on those estimates.
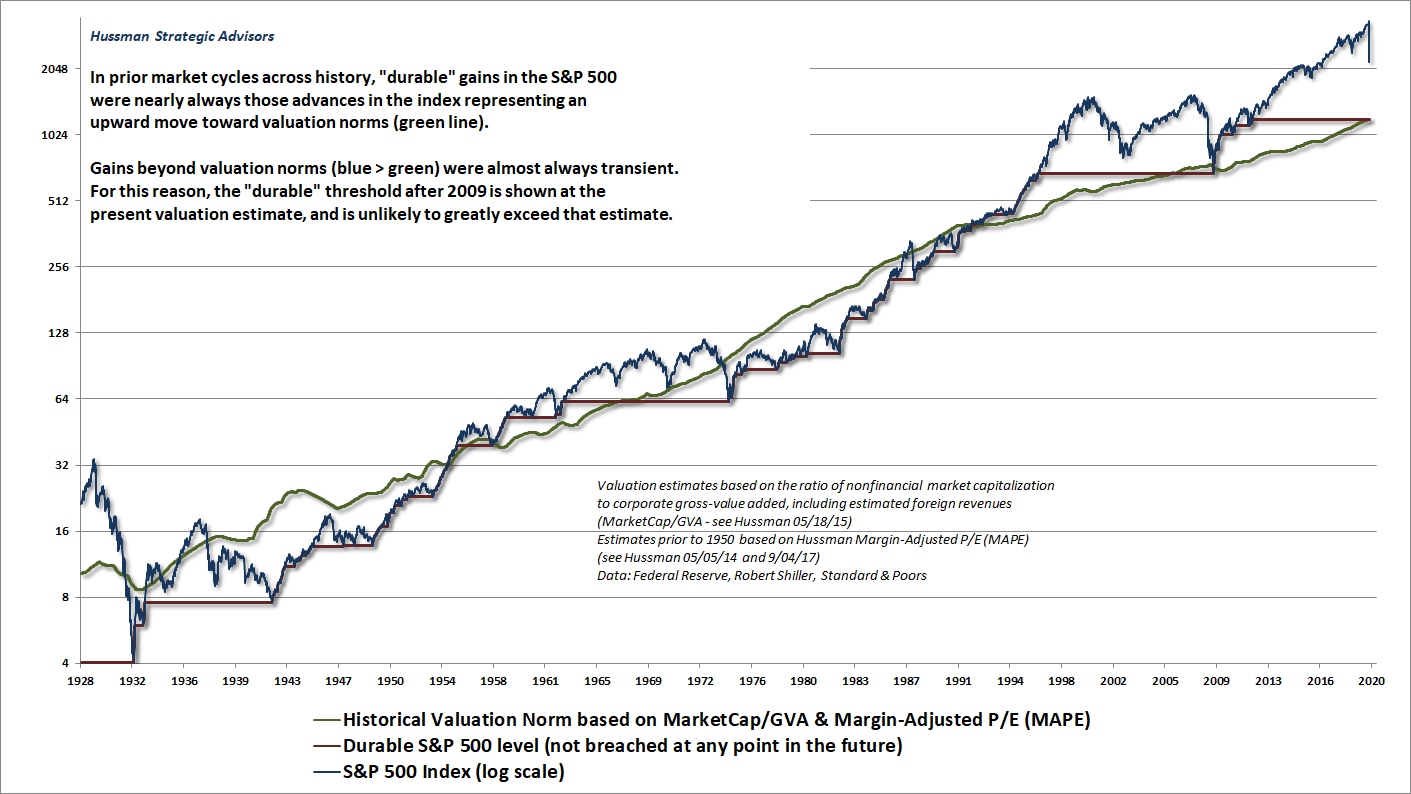
The chart below offers some context regarding market cycles. Specifically, we can think of long-term market returns as having a “durable” component and a “transient” component. The durable component is the market gain that is not surrendered at some later date. If you examine the data, you’ll find that the durable component typically represents market advances that bring valuations up to historical norms. In contrast, the transient component is the market gain that is typically surrendered by some later date, often several years into the future. You’ll find that the transient component typically represents market advances that bring valuations far beyond historical norms.
Probably needless to say, I view the speculative market gains of recent years as almost wholly transient.
The quick calculation is to consider the possibility that we actually see just 1.4% S&P 500 total returns over the coming 10-year period, from current valuation levels, with a potential (not “predicted” or inevitable) interim loss on the equity component of the portfolio on the order of about 50% from here, which would be gradually recovered. Consider what that would mean in dollars. If that outcome would be unfortunate, but tolerable, there may be no need to adjust your exposure to market risk. If it would not be tolerable, review your exposure.
Of course, my preference is to ask these questions when the markets are elevated, and I hope that I’ve succeeded in prompting these considerations already. As I wrote in early-October 2018 (just before the Q4 plunge), “The initial decline of a bear market tends to be rather violent. Once prices have dropped sharply, it becomes extremely uncomfortable for investors to reduce their exposure to risk by selling into a decline, even when the prospect of additional losses remains very high. Instead, they often ride out the entire bear market and eventually abandon stocks in a final panic. If investors don’t get out at the highs, they end up getting out at the lows.”
The S&P 500 is currently at about the same level it was in January 2019. Though market valuations are about 24% lower than they were at the 2000 and February 2020 highs, they’re actually about the same level we saw at the October 2007 market peak, and still about double the historical norm.
This is not the best time for investors to be examining and right-sizing their investment exposure, but it’s certainly not the worst.
One bit of advice that friends have often found helpful: Anytime you make a portfolio change, start by accepting that you are guaranteed to have regret. If you sell some of your holdings and the market goes up, you’ll regret having sold anything. If you sell and the market goes down, you’ll regret not having sold more. If you don’t sell and the market goes up, you’ll regret not having bought. The key is to balance a careful consideration of valuations, expected returns, potential risks, and prevailing market conditions, along with all of those potential regrets. If you begin by accepting that there will be regret of one form or another, you won’t feel paralyzed, and you’ll consider more possibilities than you might otherwise.
On gold, interest rates and inflation
Inflation has an enormous psychological component: it reflects a loss of confidence that the liabilities issued by the government will retain their ability to purchase the same amount of real goods and services that they can purchase today. The key uncertainty about inflation is that it is largely a psychological event, and depends heavily on the confidence, or loss of confidence, by the public that government liabilities (bonds and base money) can be held without deterioration in their value. Large shifts in inflation are typically linked to discrete events that provoke a loss of confidence in price stability itself – like the trifecta of Great Society deficits, Nixon closing the gold window, and an oil embargo, or the combination of money printing and a supply shock, like using deficit finance to pay striking workers in the Ruhr.
– John P. Hussman, Ph.D.
One of the knee-jerk responses to the current crisis is that investors have quickly responded as if we are facing the same deflationary conditions that emerged during the global financial crisis. While we can’t rule out contagion to the banking system, my impression – as I noted earlier – is that the ability of banks to mark certain assets “to model” rather than “to market” substantially lessens the risk of deflationary contagion.
Instead, my impression is that there’s a growing risk that we’ll see an extremely large issuance of government liabilities, both in the form of Treasury debt and in the form of monetary base (currency and bank reserves, resulting from Federal Reserve purchases of government-backed securities). The problem is that this issuance is also likely to be accompanied by a “supply shock” in the quantity of output produced by the economy.
Rapidly increasing government liabilities, coupled with supply shocks, form exactly the sort of combination that has historically provoked destabilization of confidence in the ability of government liabilities to hold their value in terms of real goods and services.
Again, it’s possible that a sufficient amount of financial stress and credit losses will encourage investors to chase cash as a safe haven (which would support the value of cash despite its increased quantity, and defer inflationary pressures). But given already large deficits coupled with the likelihood of constrained output, my impression is that inflation hedges may be useful for some portion of a diversified portfolio. Still, be careful to observe that some inflation hedges, like precious metals stocks, can also be quite volatile.
Meanwhile, I’m not at all convinced that a 0.86% yield on a 10-year Treasury bond can really be considered an “investment.” Rather, it seems to reflect speculation about zero or negative long-term rates, and the ability of the government to create liabilities in nearly unlimited quantities despite reduced economic output.
I’ll take the over.
Wishing you, your family, and your loved ones health and peace. With gratitude to all of you who make our work part of your life. Best – John
Keep Me Informed
Please enter your email address to be notified of new content, including market commentary and special updates.
Thank you for your interest in the Hussman Funds.
100% Spam-free. No list sharing. No solicitations. Opt-out anytime with one click.
By submitting this form, you consent to receive news and commentary, at no cost, from Hussman Strategic Advisors, News & Commentary, Cincinnati OH, 45246. https://www.hussmanfunds.com. You can revoke your consent to receive emails at any time by clicking the unsubscribe link at the bottom of every email. Emails are serviced by Constant Contact.
The foregoing comments represent the general investment analysis and economic views of the Advisor, and are provided solely for the purpose of information, instruction and discourse.
Prospectuses for the Hussman Strategic Growth Fund, the Hussman Strategic Total Return Fund, the Hussman Strategic International Fund, and the Hussman Strategic Allocation Fund, as well as Fund reports and other information, are available by clicking “The Funds” menu button from any page of this website.
Estimates of prospective return and risk for equities, bonds, and other financial markets are forward-looking statements based the analysis and reasonable beliefs of Hussman Strategic Advisors. They are not a guarantee of future performance, and are not indicative of the prospective returns of any of the Hussman Funds. Actual returns may differ substantially from the estimates provided. Estimates of prospective long-term returns for the S&P 500 reflect our standard valuation methodology, focusing on the relationship between current market prices and earnings, dividends and other fundamentals, adjusted for variability over the economic cycle.