

Clearing Rallies and Crashes (Buckle Up)


John P. Hussman, Ph.D.
President, Hussman Investment Trust
Interim Comment: March 1, 2020
Brief Observations
While we don’t presently observe conditions to indicate a ‘buying opportunity’ or a ‘bottom’ from a full-cycle standpoint, we do observe conditions that are permissive of a scorching market rebound, even if it only turns out to be the ‘fast, furious, prone to failure’ variety. I say ‘permissive’ because there is no certainty about a rebound, and we wouldn’t dream of removing our safety nets against a market decline that I continue to expect to draw the S&P 500 toward the 1000 level by the completion of this cycle. Still, we’ve prepared for the possibility of unusual volatility here, most likely including one or more daily moves in the range of 4-6%, potentially to the upside. Yes, that means one or more daily moves on the order of 100-150 points on the S&P 500 and 900-1300 points on the Dow. You think I’m kidding.
– John P. Hussman, Ph.D., December 26, 2018 (pre-open)
Three considerations: valuations, internals, and overextension
At the market close on Friday February 28, the cumulative total return of the S&P 500 Index, since its September 20, 2018 pre-correction peak, stood just 0.61% ahead of the total return on risk-free 3-month Treasury bills for the same period. Everything else – the market correction in the fourth quarter of 2018, the 2019 market advance, the speculative run to record highs in mid-February, and last week’s “trap door” market plunge – has essentially been a long, volatile trip to nowhere. Risk-aversion wreaks havoc on a market that’s priced for zero risk.
From a full-cycle perspective, the decline in the U.S. stock market from its recent high remains something of a non-event, compared with the probable market loss over the completion of this cycle.
I continue to expect the S&P 500 to lose about two-thirds of its value from its recent high to the trough of the next bear market. As I’ve regularly observed, a decline of that magnitude would not be a worst-case scenario. Rather, it would merely draw S&P 500 valuations to historically run-of-the-mill valuation norms that have been observed over the completion of nearly every market cycle in history, with the exception of the 2002 low (which was later breached in 2009). Based on the valuation measures we find best-correlated with actual subsequent market returns across history, even a retreat to October 2002 valuations would require a market loss of over -50% from the recent peak.
To put run-of-the-mill historical valuation norms into perspective, a two-thirds loss in the S&P 500 Index from its February 19 high of 3386 would place the index at roughly 1129, still about -62% below where the index closed at the end of last week.
A detailed discussion of our full-cycle concerns, as well as a review of broad market conditions, is provided in my February 25 comment Make Good Choices!.
Still, remember that while valuations are extremely informative about long-term returns and full-cycle risks, the condition of market internals is an essential gauge of speculation vs. risk-aversion across shorter segments of the market cycle. A third important consideration – at least in prior market cycles across history – has been the emergence of extremely compressed “oversold” conditions or extremely overextended “overbought” conditions.
The main caveat is that in recent years, even the most extreme overvalued, overbought, overbullish “limits” did nothing to restrain yield-seeking speculation, and our bearish response to those historically-reliable “limits” proved to be detrimental. For that reason, we adapted our investment discipline in late-2017 to give priority to our measures of market internals, even when market conditions are extremely overextended. With that change, we do not adopt a “bearish” market outlook unless we also observe deterioration in our measures of market internals, and we do not adopt an aggressively “bullish” outlook without an improvement in those measures.
Presently, we continue to observe extreme valuations, coupled with ragged and divergent market internals. Yet we also observe very compressed short-term market action that has historically been permissive of “fast, furious” clearing rallies to relieve that compression. We are not “bullish” from a full-cycle perspective, and we continue to view safety nets as essential, but this compression does encourage us to have a more “two-sided” view about very near-term volatility.
Valuations remain extreme
To illustrate the relative insignificance of last week’s market loss from a full-cycle perspective, the chart below updates our estimate of prospective 12-year average annual nominal total returns for a conventional, passive asset mix invested 60% in the S&P 500 Index, 30% in Treasury bonds, and 10% in Treasury bills. From a mid-February low of -0.16%, which was weaker than even the prospective return at the August 1929 market peak, last week’s market plunge pushed this estimate of 12-year nominal returns back above zero, but only to 0.70%. The chart below offers some historical context.
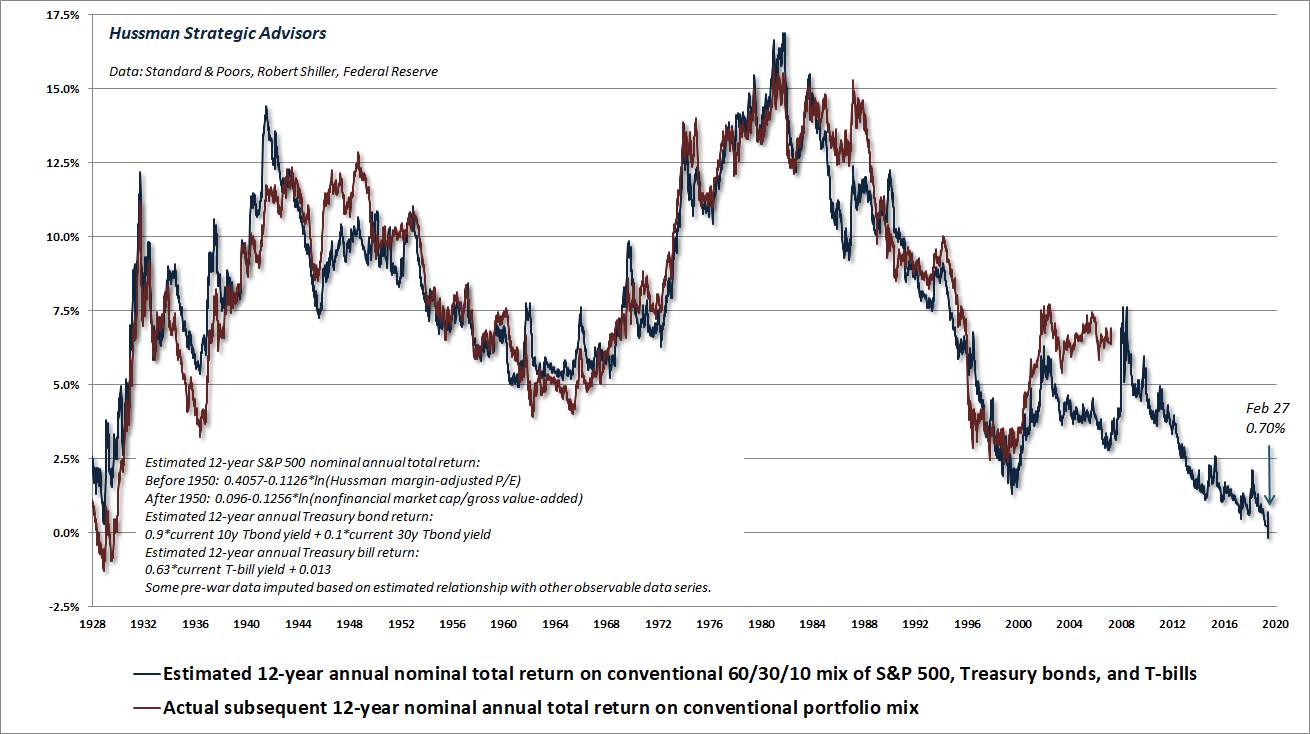
As I’ve noted before, one of the hallmarks of financial bubbles that actual market returns in the years preceding a speculative peak tend to be higher than the returns that investors would have expected, based on typical historical relationships between valuations and subsequent returns. Since this sort of “error” is precisely what leads investors to abandon the information provided by valuations at the worst possible moment, the March comment includes a section titled “Do valuations still ‘work’?” – which walks through this point with additional charts relating to both valuations and our measures of market internals.
Internals remain divergent
During the past year, the main aspect of market conditions that prevented us from adopting a constructive view – except in brief instances – was divergence in our measures of market internals.
Specifically, as the S&P 500 advanced toward its recent peak, most of the market’s gains were driven by speculative “story” stocks and hypervalued large-cap glamour stocks. This is a common feature of late-stage speculative episodes. I discussed this “Nifty Fifty” type of behavior in my January comment One Tier and Rubble Down Below.
The problem with the combination of extreme valuations and divergent internals, as we saw last week, is that it creates the risk of abrupt “trap door” market collapses. This combination continues to be of concern, particularly from a full-cycle perspective.
We certainly don’t require a two-thirds market loss as a prerequisite to adopt a constructive investment outlook. Yes, an aggressive outlook would require far more reasonable valuations than we’ve observed in recent weeks, but the easiest path to a more constructive outlook would be a further retreat in valuations, followed by a favorable shift in our measures of market internals. A retreat in valuations all the way to historical norms is not required.
I’ll add this. I’ve openly detailed my error relating to overvalued, overbought, overbullish “limits” in the recent advancing half-cycle, and we’ve adapted our discipline accordingly. Still, investors might do well to know that I’ve adopted a constructive, unhedged, or leveraged investment outlook after every bear market collapse in over three decades as an investment professional. That includes late-2008 (though admittedly truncated by my insistence on stress-testing our methods against Depression-era data). Examine how our investment discipline has navigated other complete market cycles, and the “permabear” label becomes rather difficult to stick.
Short-term compression often produces “clearing rallies”
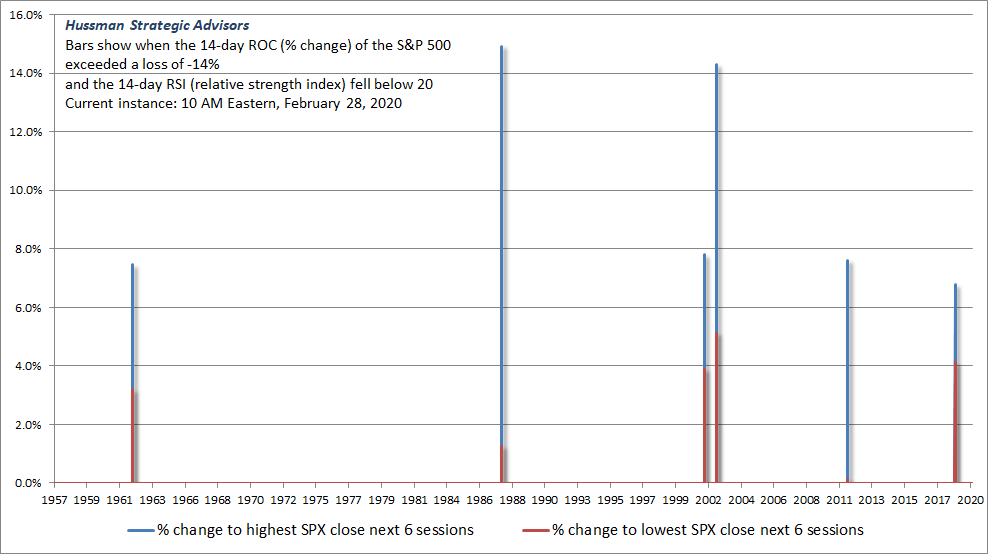
Amid all the hallmarks of end-stage speculation in recent months (see, for example, Marks of a Phase Transition), the opportunities to share favorable market indications have been few and far between. That changed last week. At the about 10 A.M. on Friday morning, the S&P 500 reached a low of about 2866, placing its 14-day rate-of-change (ROC) at a loss of over -14%, and its 14-day “relative strength index” (RSI) below 20.
That combination reflects the same level of compression that we observed at the December 2018 market low, which prompted my interim comment, The Fast and the Furious, which was published before the market open (one of the reasons we have a mailing list). After falling by just over 4 points after the open, the S&P 500 reversed course and ended the day up nearly 5% (just over 116 points), extending that gain to nearly 7% a few days later.
The chart below shows the condition we observed on Friday morning (February 28). The blue bars show the largest gain in the S&P 500 at any close within the following 6 sessions, and ranged from 7% to as much as 15% in prior instances. The red bars show the largest loss (or smallest gain) at any close within the following 6 sessions. Though there were no further losses in the 6 day period immediately following previous instances of extreme “compression,” there’s zero assurance that the same will be true in this instance – particularly because Fed easing does not stop a virus. Market losses are always possible, and remember that this particular set of criteria was met only intra-day on Friday.
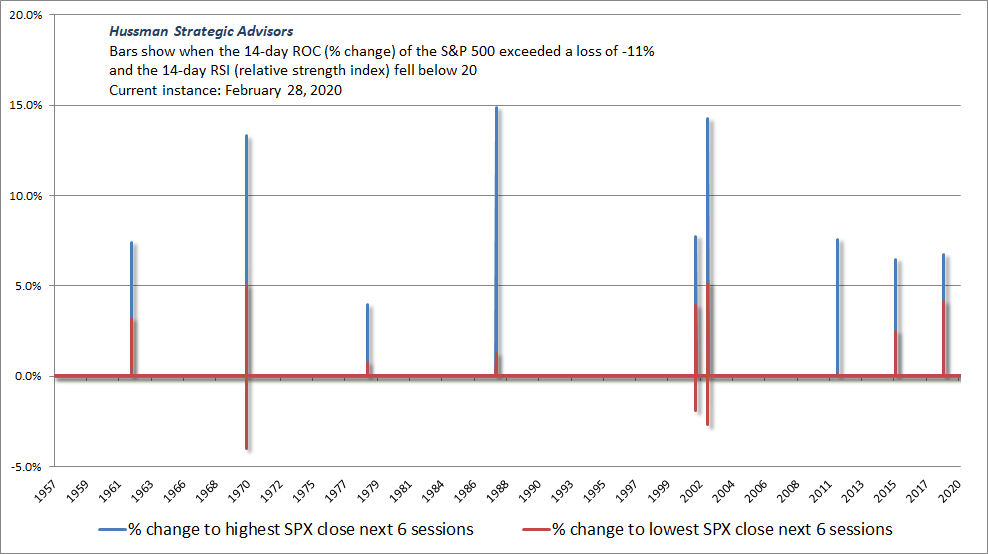
The S&P 500 staged a late-day advance at Friday’s close, so the current level of compression is somewhat less severe. Given legitimate concerns about COVID-19, there’s substantial “headline risk” that could produce fresh lows, but here’s the set of conditions that was actually applicable at Friday’s close.
It’s important to recognize that, unlike the compression we saw in December 2018, when the striking about-face of the Federal Reserve toward easing was enough to encourage speculators, sustained risk-aversion related to pandemic flu may prove far more persistent. That’s certainly my expectation.
Yet although I expect dramatically greater market losses over the completion of this cycle – and safety nets remain essential – investors shouldn’t rule out a rather violent “clearing rally” in the coming days, to relieve this short-term compression, possibly including one or more daily advances on the order of 4-6% (yes, I mean 100-175 points on the S&P 500). Given the serious deterioration that we observe in our measures of market internals, my guess is that a clearing rally may be of the “fast, furious, prone-to-failure” variety. But in any event, buckle up.
Presently, we continue to observe extreme valuations, coupled with ragged and divergent market internals. Yet we also observe very compressed short-term market action that has historically been permissive of ‘fast, furious’ clearing rallies to relieve that compression. We are not ‘bullish’ from a full-cycle perspective, and we continue to view safety nets as essential, but this compression does encourage us to have a more ‘two-sided’ view about very near-term volatility.
As for our own investment discipline, Friday morning’s compression was reasonable opportunity to at least briefly smooth the pointed “edge” of our negative market outlook.
To be clear, we are not “bullish” here, we continue to view safety nets as essential, and even if we restore Friday morning’s lows, we would not view the resulting compression as a “buy signal” from a full-cycle perspective. Still, it’s fair to say that I’m capable of a far wider range of market views than some might imagine – particularly those who blindly extrapolate my error relating to “overvalued, overbought, overbullish” syndromes in recent years as if it’s a character trait, while wholly ignoring the late-2017 adaptation that addressed it.
The market is likely to get wild here, most likely in both directions. I hope that this comment will provide some perspective in distinguishing short-term compression from the larger full-cycle risks.
Public health notes
I’ve updated the charts and expanded the content from last week’s comment below. If there is one message here, it is that this pandemic should be taken seriously.
A few observations regarding the public health implications surrounding the novel coronavirus COVID-19 may be helpful (see some of my research papers, this article in Nature for example, to assure yourself that I’m not shooting wildly from the hip).
As I noted last month, two of the features worth monitoring are the 5-day compound growth rate of reported cases, both in China and elsewhere, as well as the mortality rate of COVID-19.
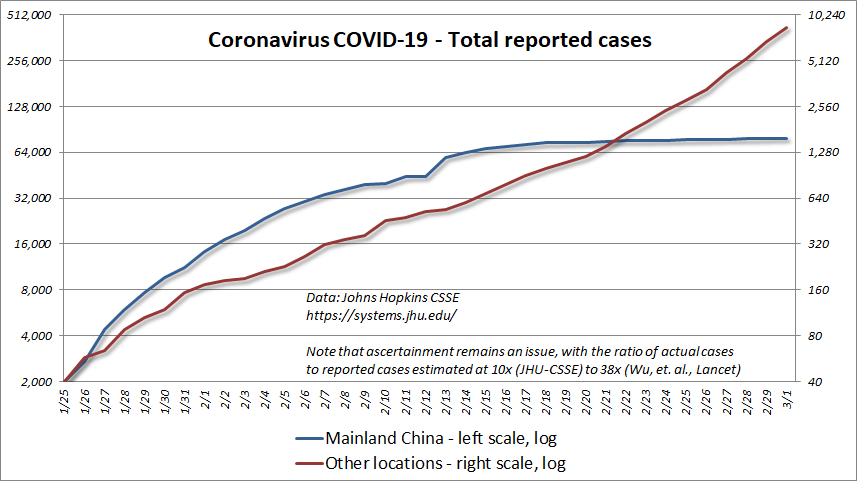
Accurate identification of cases (“ascertainment”) remains an issue, as the number of actual cases is estimated to exceed the number of reported cases by a factor ranging from 10x (Johns Hopkins CSSE) to 38x (Wu, et. al., Lancet, 2020). The hopeful aspect of this is that unreported cases are also likely to be less severe. Likewise, since the reporting of actual fatalities is likely to be more accurate than the reporting of cases, the ratio of fatalities/actual cases is also likely to be much smaller than the current 3.4% figure based on fatalities/reported cases. Another hopeful sign is that the mortality rate outside of China is currently running at about 1.5%, though this is still far higher than the 0.13% mortality rate of the seasonal flu.
The seasonal flu produces so many fatalities primarily because it emerges in constantly varying strains, each which tends to be poorly contained. In a given year, a median of 30 million Americans are infected by the seasonal flu, with a median of about 38,000 fatalities. The worst episode in the past decade, according to data from the Centers for Disease Control and Prevention (CDC), was the 2017-2018 season, with an estimated 45 million cases, and 61,000 fatalities. During the 2019-2020 season, through February, the CDC estimates that there have been about 32 million cases of the seasonal flu in the U.S., though that figure will rise somewhat further in the coming months.
Another important aspect of COVID-19 is its relatively high reproductive rate R0, estimated to be about 2.6. That figure represents the average number of people that contract the virus through contact with someone who already has it. By comparison, the R0 value for seasonal flu is only about half that rate.
To put R0 into perspective, in order for the number of cases to stabilize, approximately 1-1/2.6 = 62% of potential contacts (I prefer not to use “herd”) must either be immune or contained once a new transmission “hub” emerges. That’s why containment efforts need to be taken so seriously.
Provided that containment efforts are strong, the total number of cases can be expected to follow a “logistic” growth trajectory, where the growth rate of new cases progressively declines toward zero as the total number of cases stabilizes. Without strong containment, the total number of cases would follow an “exponential” growth trajectory more closely.
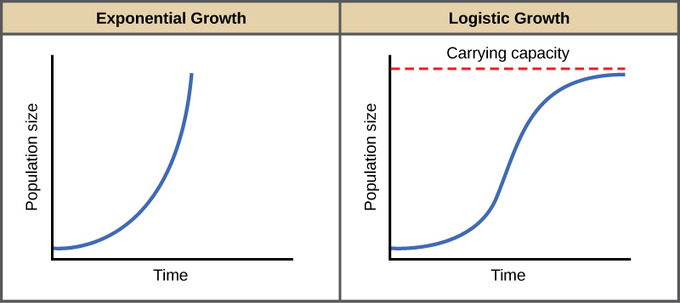
Yes, the total number of cases of seasonal flu regularly follows an exponential trajectory, and as a result, it affects millions of people year after year. So what’s the big deal? The problem with COVID-19 is that it’s got twice the R0 and, based on the evidence to-date, over ten times the mortality rate.
Containment includes any and all forms of reduced contact and transmission. Many of these are everyday actions that need not grind society to a halt, but they should be taken seriously.
My impression is that, in practice, we may observe a mixture – logistic growth in areas that are (or quickly become) well-contained, but exponential growth in smaller hubs. That kind of mixture would produce a sort of stop-start profile in total global cases, where the total number of cases stabilizes, then takes off again for a period of time.
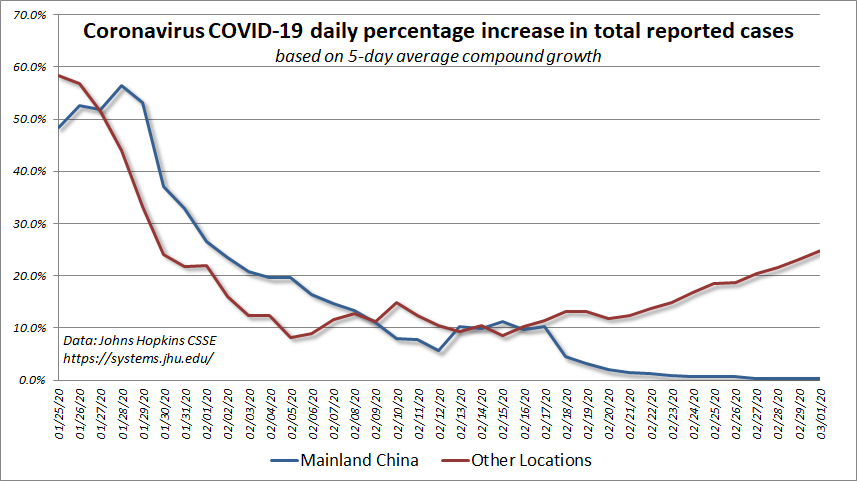
The chart below is based on data from Johns Hopkins CSSE (with great admiration for the work of Lauren Gardner and her team), and reflects the 5-day compound growth rate of cases both in China and elsewhere. Note that early on, we observed extremely high growth rates on the order of a 50% daily increase in total reported cases. Since then, evidently due to strong containment efforts, we’ve observed a gradual decline in the growth rate of cases in China.
Regardless of how one judges the quality of data coming out of China (which may be limited to areas where strong monitoring and containment efforts are actually taking place), one thing is clear: the growth rate of cases outside of China is going the wrong way.
As of March 1, 2020, the growth rate of COVID-19 cases in countries other than China is running at 25% daily. The expansion in the number of locations is also problematic, because the first person in each new location is local “patient zero.” Unless serious containment efforts reduce this growth rate substantially, a continuation would produce a 1000-fold increase in cases over the coming month.
Even that might not seem so bad, until the end of April, when the same rate of growth would push the number of COVID-19 cases beyond the 45 million U.S. flu cases observed in 2017-2018. That is exactly how this little coronavirus with twice the R0 of the seasonal flu, and a mortality rate that is evidently an order of magnitude higher, will produce utter chaos if containment efforts are not taken seriously.
The next chart shows the total number of cases in China and elsewhere, on log scale (each vertical segment represents a doubling of cases) but with cases abroad starting from a significantly smaller base. Notice that total cases in China appear to be stabilizing, but cases abroad, at least at present, have continued to grow at a slightly accelerating rate.
“Containment” includes any and all forms of reduced contact and transmission. Many of these are everyday actions that need not grind society to a halt, but they should be taken seriously. If there’s a node of local cases, reduce your exposure to crowds, and avoid groups if you’re feeling under-the-weather – especially when there are elderly people present. The risk of fatality increases gradually with age, and turns sharply higher over 70 and particularly over 80. COVID-19 seems to have very low mortality risk for children, but sending a sick child to school still creates a transmission vector. Other risk factors include cardiovascular health, diabetes, and chronic respiratory conditions. Containment also includes reducing the impact of physical proximity – hand washing, especially before eating or preparing food; coughing into the crook of your elbow; offering a nod, a bow, or a fist-bump instead of shaking hands; having shorter conversations at slightly greater distances.
At present, all of this is just informational, and ideally it will stay that way. In any event, if you find yourself in or near a “node” of new cases, my hope is that you will take containment efforts seriously, however inconvenient they may be. Based on predicted transmission hubs, it’s not unreasonable to maintain strong monitoring efforts in New York, Houston, Washington D.C., and Honolulu. Without widespread immunity or vaccines, it’s those containment efforts that allow the growth process to go from exponential to logistic.
In case you missed it – My March market commentary, published last week: Make Good Choices!
Join our mailing list (100% spam-free) below to receive an email when new content or a special update is published.
Keep Me Informed
Please enter your email address to be notified of new content, including market commentary and special updates.
Thank you for your interest in the Hussman Funds.
100% Spam-free. No list sharing. No solicitations. Opt-out anytime with one click.
By submitting this form, you consent to receive news and commentary, at no cost, from Hussman Strategic Advisors, News & Commentary, Cincinnati OH, 45246. https://www.hussmanfunds.com. You can revoke your consent to receive emails at any time by clicking the unsubscribe link at the bottom of every email. Emails are serviced by Constant Contact.
The foregoing comments represent the general investment analysis and economic views of the Advisor, and are provided solely for the purpose of information, instruction and discourse.
Prospectuses for the Hussman Strategic Growth Fund, the Hussman Strategic Allocation Fund, the Hussman Strategic Total Return Fund, and the Hussman Strategic International Fund, as well as Fund reports and other information, are available by clicking “The Funds” menu button from any page of this website.
Estimates of prospective return and risk for equities, bonds, and other financial markets are forward-looking statements based the analysis and reasonable beliefs of Hussman Strategic Advisors. They are not a guarantee of future performance, and are not indicative of the prospective returns of any of the Hussman Funds. Actual returns may differ substantially from the estimates provided. Estimates of prospective long-term returns for the S&P 500 reflect our standard valuation methodology, focusing on the relationship between current market prices and earnings, dividends and other fundamentals, adjusted for variability over the economic cycle.