

Marks of a Phase Transition


John P. Hussman, Ph.D.
President, Hussman Investment Trust
Interim Comment: November 20, 2019
One of the best indications of the speculative willingness of investors is the ‘uniformity’ of positive market action across a broad range of internals… I’ve noted over the years that substantial market declines are often preceded by a combination of internal dispersion, where the market simultaneously registers a relatively large number of new highs and new lows among individual stocks, and a leadership reversal, where the statistics shift from a majority of new highs to a majority of new lows within a small number of trading sessions.
This is much like what happens when a substance goes through a ‘phase transition,’ for example, from a gas to a liquid or vice versa. Portions of the material begin to act distinctly, as if the particles are choosing between the two phases, and as the transition approaches its ‘critical point,’ you start to observe larger clusters as one phase takes precedence and the particles that have ‘made a choice’ affect their neighbors. You also observe fast oscillations between order and disorder in the remaining particles. So a phase transition features internal dispersion followed by leadership reversal.
– John P. Hussman, Ph.D.
Market Internals Go Negative, July 30, 2007
By the time a bull market reaches its peak, investors have experienced numerous instances where the market has declined by several percent, followed by an advance to fresh highs. Indeed, the advancing half-cycle since 2009 has included 3 separate declines in excess of 10%, 9 interim declines in excess of 5%, and 17 interim declines in excess of 3%.
That apparent “resilience” during a bull market contributes to a distinct sort of complacency, illustrated by this quote from Barron’s Magazine on February 3, 1969, after the S&P 500 had already quietly started a bear market that would take stocks down by more than one-third over the next 18 months, and would leave S&P 500 Index below its 1968 peak even 14 years later:
“The failure of the general market to decline during the past year despite its obvious vulnerability, as well as the emergence of new investment characteristics, has caused investors to believe that the U.S. has entered a new investment era to which the old guidelines no longer apply. Many have now come to believe that market risk is no longer a realistic consideration, while the risk of being underinvested or in cash and missing opportunities exceeds any other.”
The major problem with the initial decline of a bear market is that even if valuations are still near historical extremes, it’s psychologically difficult for investors to reduce their exposure to market risk once prices have declined several percent from their highs.
For that reason, investors should be fully aware of the present combination of extreme hypervaluation, unfavorable market internals, and daily action that is characteristic of a “phase transition,” specifically, internal dispersion followed by a leadership reversal.
I considered deferring this comment until we actually observe the number of NYSE stocks setting daily new lows pushing above the number of daily new highs, as the 92 new highs and 85 new lows observed on Wednesday, November 20 didn’t quite meet that threshold. But historically, the exact threshold is essentially a distinction without a difference. Once the other features are present, whether a leadership reversal is defined as new lows rising above new highs, or rising beyond, say, 90% of new highs, the results are identical. For that reason, and particularly because such signals tend to be followed by steep market losses in short order, current conditions seemed worth noting.
Emphatically, the objective of this comment is to share a specific set of conditions that closely match ones I’ve noted in prior market cycles. It’s not a “market call” or a forecast about “what’s going to happen” in this instance. Instead, my intent is to encourage investors to carefully consider their risk exposures in the face of market conditions that I see as cyclically extreme, and having neither investment merit (i.e. valuation) nor speculative merit (i.e. market internals).
As I’ve often noted, once a share of stock is issued, it remains outstanding, and must be held by some investor at every moment in time, until that share is retired. It’s impossible for investors to “buy” or “sell” stocks in aggregate. Every share that’s sold by one investor is bought by another. Every dollar that comes “into” the market in the hands of a buyer goes “out of” the market in the hands of a seller. There’s no point in broadly advising investors to sell, because in aggregate, they can’t.
All one can hope is that investors are aware of the long-term returns implied by prevailing valuations, that they are aware of the potential market losses that regularly accompany extreme valuations over the completion of the market cycle, and that they are aware of the condition of market internals and near-term factors that suggest speculation or (as we observe at present) increasing risk-aversion. All one can encourage is that investors don’t accept more risk than they can actually sustain over the full market cycle, given their investment horizon, their desire to track the market, and their tolerance for loss. Ideally, the investors who can tolerate deep interim losses are the ones that hold stocks through a bear market decline.
Investors should be fully aware of the present combination of extreme hypervaluation, unfavorable market internals, and daily action that is characteristic of a “phase transition,” specifically, internal dispersion followed by a leadership reversal.
My November Market Comment, A Striking Collection of Duck-Like Features, broadly reviews overall market conditions. The following charts may also be useful.
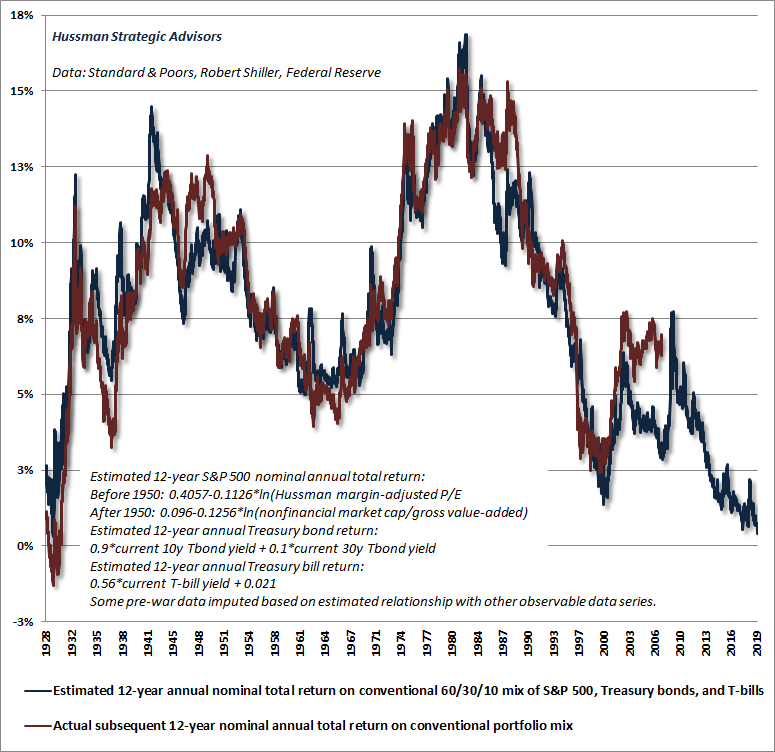
The chart below shows our estimate of prospective 12-year total returns for a conventional portfolio mix invested 60% in the S&P 500, 30% in Treasury bonds, and 10% in Treasury bills, along with the actual total return observed for this portfolio mix over the subsequent 12-year period. Presently, our estimate of prospective returns for passive investors is now lower than any week in history other than the August 26, 1929 market peak.
Be careful about the notion that “stocks always come back.” That’s largely the artifact of a rear-view advance to the most extreme valuations in history. As I detailed in Going Nowhere in an Interesting Way, the journey from extreme valuations to even historically run-of-the-mill valuations can easily involve periods of 10-15 years where stocks underperform T-bills, with severe interim losses along the way.
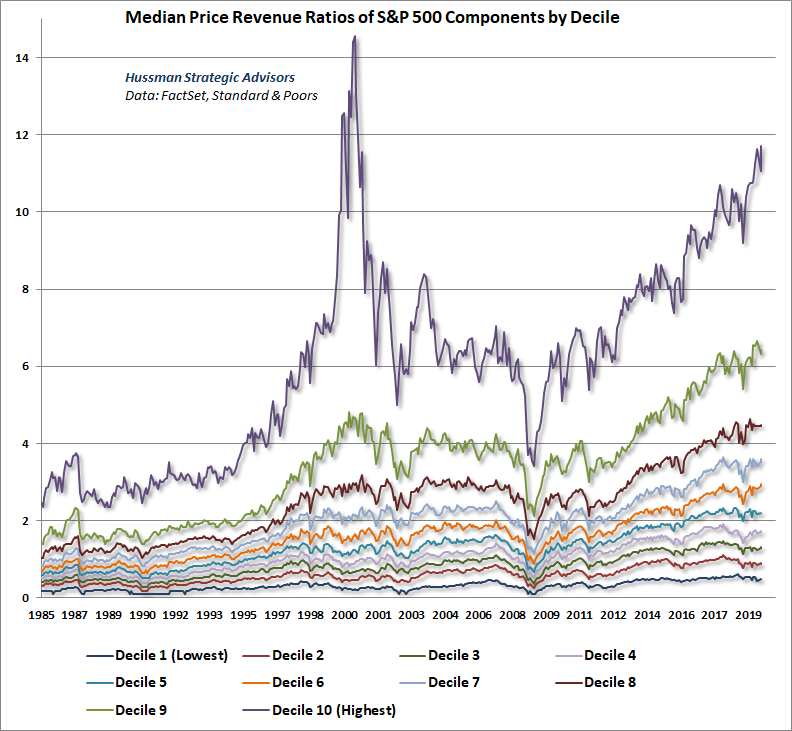
The next chart shows the median price revenue ratio of S&P 500 stocks, where the components have been divided into 10 groups, ranked from the lowest 10% to the highest 10% of valuations on this measure. Thanks to our resident math guru, Russell Jackson, for compiling this data. It’s important to note that these deciles tend to have different features, with low price/revenue ratio deciles typically including retail stocks and other companies with relatively low profit margins, and high price/revenue deciles typically including technology stocks and other companies in rapid growth industries with high profit margins.
So for the purposes of valuation, each decile is best compared with its own history, where I should note that 1992 valuations are relatively close to long-term post-war norms. Comparisons between deciles provide information about the level of dispersion across different stocks. Clearly, the most extreme dispersion on record was at the height of the tech bubble in 2000, where a significant amount of market overvaluation was concentrated among roughly 10% of hypervalued glamour stocks dominated by the tech sector.
What’s notable at present is that only the top valuation decile is less extreme than the 2000 bubble, and only by about 20%. That’s not saying much, given that the top decile in 2000 was also unique in losing about 80% of its value in 2000-2002 versus roughly 50% for the other deciles.
The final chart below is largely the reason for this interim update. The chart shows all the points in the past three decades where we’ve observed the components of a “phase transition” similar to what I described in 2007. Depending on the exact criteria, one can certainly capture a slightly wider or narrower set of instances. What matters is that high-risk periods broadly reflect similar features.
We identify phase transitions by looking for a gestalt – several features that form a coherent, recognizable whole – in this case reflecting dispersion in leadership (new highs vs new lows), participation (the % of individual stocks joining a given market advance), and breadth (advancing vs declining issues) emerging immediately near a record market high. Healthy markets seldom feature this sort of dispersion so close to a record high.
In the chart below, the red bars show points within 10 sessions of a record high in the S&P 500 where we’ve observed:
1) Tepid participation as we observe at present. Currently, fewer than 56% of all stocks are above their respective 200-day averages;
2) Divergent leadership, with at least 2 days during the previous 10-week period where both NYSE new highs and new lows exceeded the total number of issues traded. Here, I’ve also used Peter Eliades “Hindenburg” confirmation criteria: S&P 500 higher than 10 weeks earlier, new highs no more than twice new lows, and a negative McClellan Oscillator (a measure based on advances vs declines);
3) Recently overbought conditions, with the relative strength index (RSI) reaching at least 65 or higher over the past 10 sessions;
4) Finally, a leadership reversal, with NYSE new lows more than 90% of new highs, where average new lows were below 90% of average new highs in the prior 10 trading sessions.
As I observed in the November comment, the key idea here isn’t terribly complex. High-risk market conditions feature the simultaneous appearance of market extremes and market divergences; essentially an overextended market losing its engines.
We identify phase transitions by looking for a gestalt – several features that form a coherent, recognizable whole – in this case reflecting dispersion in leadership (new highs vs new lows), participation (the % of individual stocks joining a given market advance), and breadth (advancing vs declining issues) emerging immediately near a record market high.
That first red bar in the chart was on March 28, 2000 – two trading sessions after the March 24, 2000 market peak. The second instance was October 19, 2007 – eight trading sessions after the October 9, 2007 market peak. The third instance was February 5, 2018 – six trading sessions after the January 24, 2018 pre-correction peak. The next was September 24, 2018, two sessions after the September 20 market high and immediately followed by a steep market loss into late-December. Finally, we observed similar conditions on August 2 of this year, five sessions after the July 26 interim peak, but followed by only a moderate further correction.
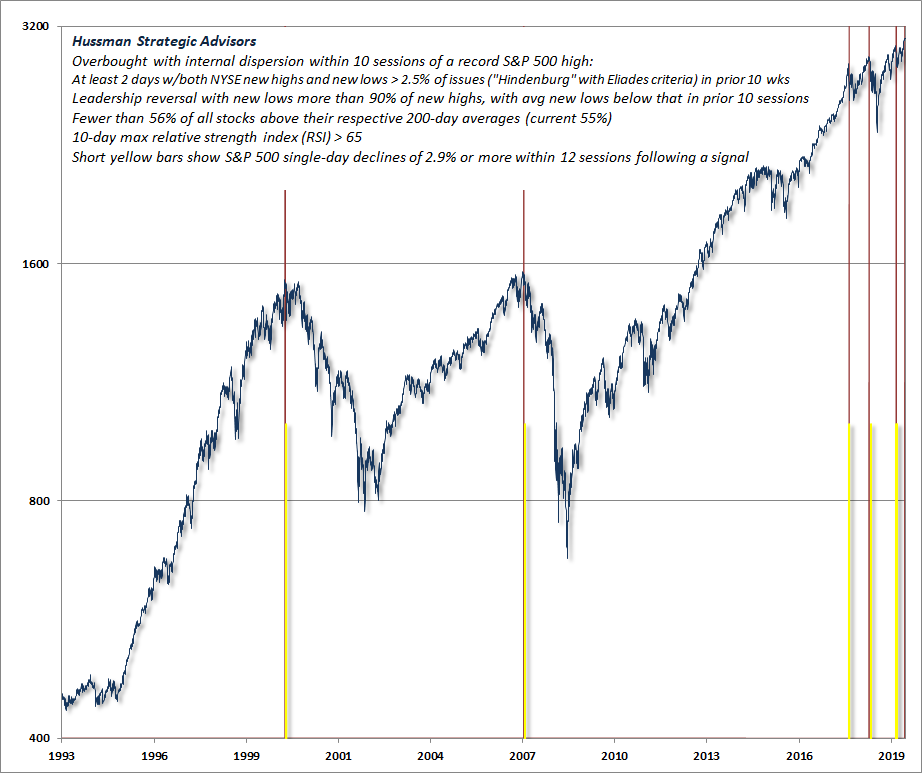
You’ll also notice several short yellow bars next to all of those previous red bars. Those yellow bars indicate single-day S&P 500 declines of 2.9% or more within 12 trading sessions following a given signal. There’s no assurance that we’ll observe that outcome in this particular instance. Still, given the “duck-like” features that I emphasized in the November comment, my sense is that market conditions closely resemble those that we’ve observed at other major market extremes. Given valuations that rival both 2000 and 1929, my impression is that relying on further speculation is playing with fire.
A final note
As I’ve detailed extensively, both valuations and market internals performed beautifully in the recent complete market cycle, as they have historically. My error in recent years was due to a different consideration: my pre-emptive bearish response to “overvalued, overbought, overbullish” syndromes that had generally signaled a “limit” to speculation in prior market cycles across history. Because of their reliability across history, we prioritized those syndromes following our 2009-2010 stress-testing exercise against Depression-era data. In hindsight, amid the novelty of quantitative easing and zero-interest rate policy, our pre-emptive bearish response to those “overvalued, overbought, overbullish” syndromes turned out to be detrimental. No incremental adaptation was enough until I threw up my hands in late-2017 and completely abandoned the notion that it was still possible to define a “limit” to speculation.
Since then, our requirement has been straightforward: Regardless of how extreme valuations ore other conditions might become, we will defer adopting or amplifying a “bearish” investment outlook unless our measures of internals have explicitly deteriorated. Some conditions may be extreme enough to justify a neutral outlook, but a bearish outlook requires deterioration in market internals, signaling that investors have shifted toward risk-aversion. That single requirement would have dramatically improved our experience in this half-cycle. It allows us to pursue a historically-informed, value-conscious, full-cycle investment discipline, while fully embracing the likelihood of future episodes of zero interest rates and quantitative easing, and even the possibility of negative interest rates, helicopter money, and other extraordinary policies.
Still, we presently observe not only hypervaluation and negative internals, but market action at a daily resolution that closely reflects conditions that have immediately surrounded bull market and pre-correction peaks. I expect that strong investment opportunities will emerge over the course of this cycle, at points where a material retreat in valuations is joined by an improvement in market internals. Here and now, however, we observe features characteristic of a “phase transition,” with the potential for severe market losses – not just a steep initial plunge including single-day losses on the order of 3% or more, but much more extended losses, which we continue to estimate on the order of 50-65% over the completion of this cycle.
Keep Me Informed
Please enter your email address to be notified of new content, including market commentary and special updates.
Thank you for your interest in the Hussman Funds.
100% Spam-free. No list sharing. No solicitations. Opt-out anytime with one click.
By submitting this form, you consent to receive news and commentary, at no cost, from Hussman Strategic Advisors, News & Commentary, Cincinnati OH, 45246. https://www.hussmanfunds.com. You can revoke your consent to receive emails at any time by clicking the unsubscribe link at the bottom of every email. Emails are serviced by Constant Contact.
The foregoing comments represent the general investment analysis and economic views of the Advisor, and are provided solely for the purpose of information, instruction and discourse.
Prospectuses for the Hussman Strategic Growth Fund, the Hussman Strategic Total Return Fund, the Hussman Strategic International Fund, and the Hussman Strategic Dividend Value Fund, as well as Fund reports and other information, are available by clicking “The Funds” menu button from any page of this website.
Estimates of prospective return and risk for equities, bonds, and other financial markets are forward-looking statements based the analysis and reasonable beliefs of Hussman Strategic Advisors. They are not a guarantee of future performance, and are not indicative of the prospective returns of any of the Hussman Funds. Actual returns may differ substantially from the estimates provided. Estimates of prospective long-term returns for the S&P 500 reflect our standard valuation methodology, focusing on the relationship between current market prices and earnings, dividends and other fundamentals, adjusted for variability over the economic cycle.