

Fundamentally Unsound


John P. Hussman, Ph.D.
President, Hussman Investment Trust
July 2020
Instead of judging the market price by established standards of value, the new era based its standards of value upon the market price. Hence, all upper limits disappeared, not only upon the price at which a stock could sell, but even upon the price at which it would deserve to sell.
– Benjamin Graham & David Dodd, Security Analysis, 1934
As in all periods of speculation, men sought not to be persuaded by the reality of things but to find excuses for escaping into the new world of fantasy.
– John Kenneth Galbraith, The Great Crash 1929, published 1954
Improvise is the keyword. There’s so much give in the basics [cash flow, growth, and risk] that I can stretch them to meet just about any requirement that I need, any conditions I face. The historical data become a crutch. The first thing we need to do is abandon the need for it. Mean-reversion works until it doesn’t. There are a lot of lazy arguments being made for stocks being overvalued because a normal P/E for the S&P is about 16. Where do you get that? Well, the Shiller data are from 1871 to 2009. Come on.
– Aswath Damodaran, Barron’s, June 2020
Valuations and long-term returns
Last week, my wife Terri was reaching for a coffee cup in the kitchen, and noticed a little piece of paper taped to the corner of the wall, near the ceiling. It read “$100.” Admittedly, it was my doing. I had accidentally left it there for weeks.
It’s an illustration I often use to explain how valuations work. Suppose that the $100 taped in the upper corner of the room will be delivered a decade from today, and you’re deciding how much to pay today for that future piece of paper.
Drop your hand toward the floor. If you pay $19 today for $100 a decade from now, you’ll earn 18% annually on your investment.
Raise your hand a little higher. If you pay $32, you’ll get 12% annually. Raise your hand above chest-level. If you pay $46, you’ll get 8%. Raise your hand to the top of your head. If you pay $67, you’ll get 4%. Now reach above your head. If you pay $82, you’ll get 2%. Jump in the air so your hand is even with the piece of paper. If you pay $100, you’ll get 0%. And if you’re aggressive enough to pay more than $100 today for that future $100 payment, you’ll get a negative return on your investment over the coming decade.
That’s the first rule of valuation. Given any set of future cash flows, the higher the price you pay today, the lower the long-term rate of return you can expect on your investment. Nothing about this relies on mean-reversion. It’s just arithmetic.
For any given set of expected future cash flows, knowing the price immediately tells you the expected return. Knowing the expected return immediately tells you the price. It’s just arithmetic. You don’t need to “adjust” these calculations for the level of interest rates. Now, once you calculate the expected investment return, you can certainly compare it with the level of interest rates, but the idea that valuations have to be “corrected” for interest rates reflects a misunderstanding of basic finance.
If someone tells you, “well, stock valuations are high, but high valuations are justified by low interest rates,” they’re actually arguing that passive investors face the worst of all possible worlds. They’re saying “well, future stock returns are likely to be dismal, but dismal returns on stocks are justified because you’re going to get dismal returns on bonds too.”
Saying that extreme stock market valuations are “justified” by low interest rates is like saying that poking yourself in the eye is “justified” by smashing your thumb with a hammer.
Worse, by our estimates, the likely 10-year total return of the S&P 500 from current valuations is about -1.4% annually.
The chart below illustrates the situation that passive investors face here. The blue line shows our estimate of 12-year prospective returns on a conventional passive asset mix invested 60% in the S&P 500, 30% in Treasury bonds, and 10% in Treasury bills. The red line shows actual subsequent 12-year returns on this portfolio mix. Though the market plunge in March briefly brought the prospective returns of a conventional passive portfolio as high as 2.3%, all of those prospective returns have been compressed into the market rebound since then. Investors are now paying over $100 today in return for what is likely to be less than that amount 10-12 years from now. Last week, our estimate of prospective 12-year returns on a passive investment mix again matched the most negative levels in U.S. history.
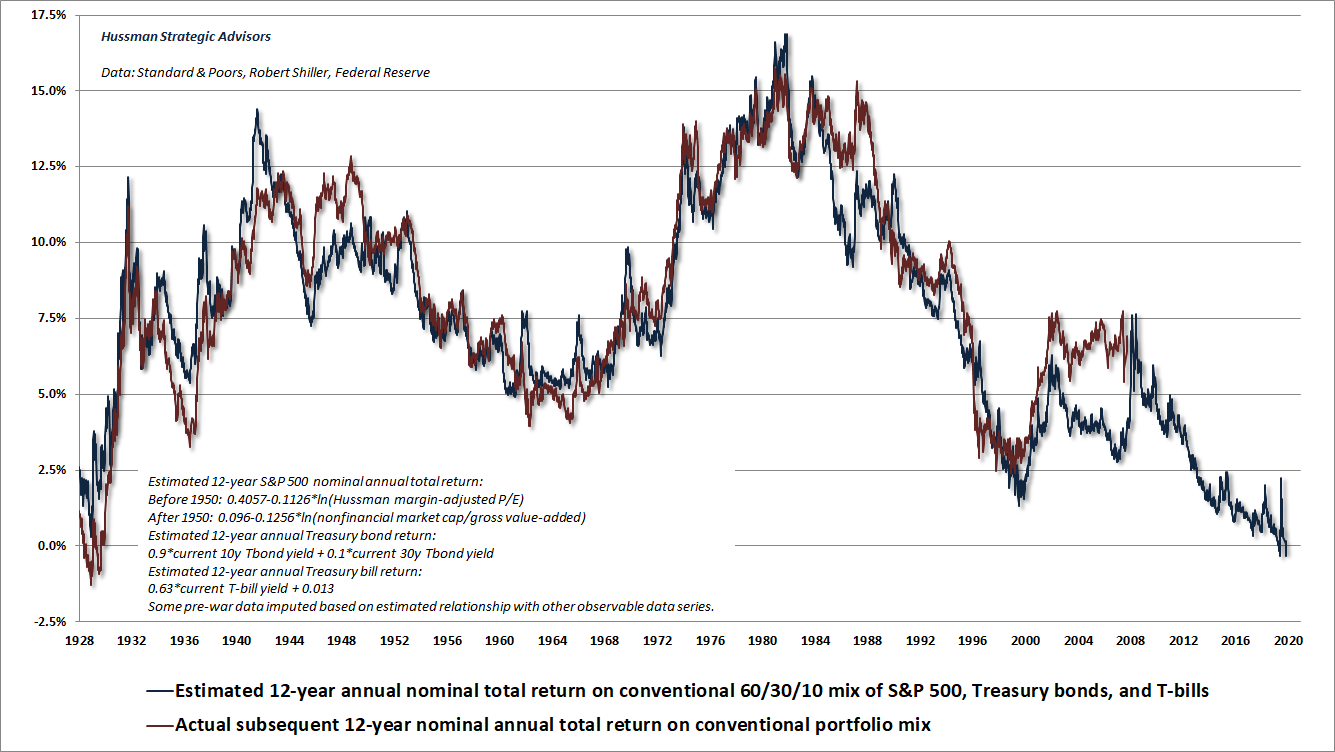
If you look carefully at some of the largest “errors” in the chart above – 1988 and 2008 – you’ll notice that they tend to occur in 12-year periods where the end of the period was a hypervalued market extreme such as 2000 and 2020. That’s what bubbles do. They wouldn’t be bubbles otherwise. Yet across history, similar “errors” have been violently corrected (as they were in 2000-2002), by wiping out the associated returns over the completion of the market cycle.
Indeed, the only reason the S&P 500 was able to squeeze out an average nominal total return of even 4.4% annually in the 20-year period since March 2000 is that valuations in late-March 2020 (despite the first-quarter market decline) were still a stone’s throw from the 2000 bubble extremes. Our most reliable valuation measures now match or exceed 2000 levels.
Over the completion of the current market cycle, I expect that the entire S&P 500 total return since 2000 will be wiped out. Specifically, I continue to expect the S&P 500 to lose about two-thirds of its value. Even a 50% market retreat would bring valuations only to levels matching the 2002 low, which was the highest valuation level ever observed at the completion of a market cycle.
Given any set of future cash flows, the higher the price you pay today, the lower the long-term rate of return you can expect on your investment. Nothing about this relies on mean-reversion. It’s just arithmetic.
Back to our $100 example. Suppose you buy the piece of paper for $68, and overnight, investors suddenly become willing to pay $100 for it. Well, instead of your 4% return occurring over 10 years, as you wait for your $100 payment, you’ll instead accrue an unexpectedly large return all at once. Of course, since the price is now $100, you’ll ultimately get nothing additional for continuing to hold. The sudden spike in the price has compressed your entire long-term expected return into an overnight windfall. Simultaneously, the new, higher valuation of $100 ensures that your future return will be zero.
Conversely, suppose you buy the piece of paper for $100, and overnight, investors suddenly become willing to pay $46 for it. Well instead of a 0% return occurring over 10 years, as you wait for your $100 payment, you’ll instead experience a huge loss all at once. But thankfully, your long-term return from the lower $46 price will be 8% annually, and that’s precisely how you’ll recover your loss over the coming decade, for an overall return of 0%.
Here’s the crucial point. A security is just a claim on some set of expected future cash flows. The higher the price you pay, the lower the long-term return you can expect.
Are historical valuation measures useless?
Investors sometimes assume that if the market continues to advance despite rich valuations, then the valuation measures must somehow be incorrect. That’s not how valuations work. If overvaluation itself was enough to drive prices lower, one could never observe extremes like 1929, 2000, and today, because the market would have been weighed down by far lesser extremes. Indeed, it is a hallmark of financial bubbles that actual market returns in the years preceding the speculative peak tend to be higher than the returns that investors would have expected, based on typical historical relationships between valuations and subsequent returns.
– John P. Hussman, Ph.D., February 25, 2020
It’s wholly incorrect to imagine that the repeated bubble periods since the late-1990’s somehow render historically-reliable valuation measures useless.
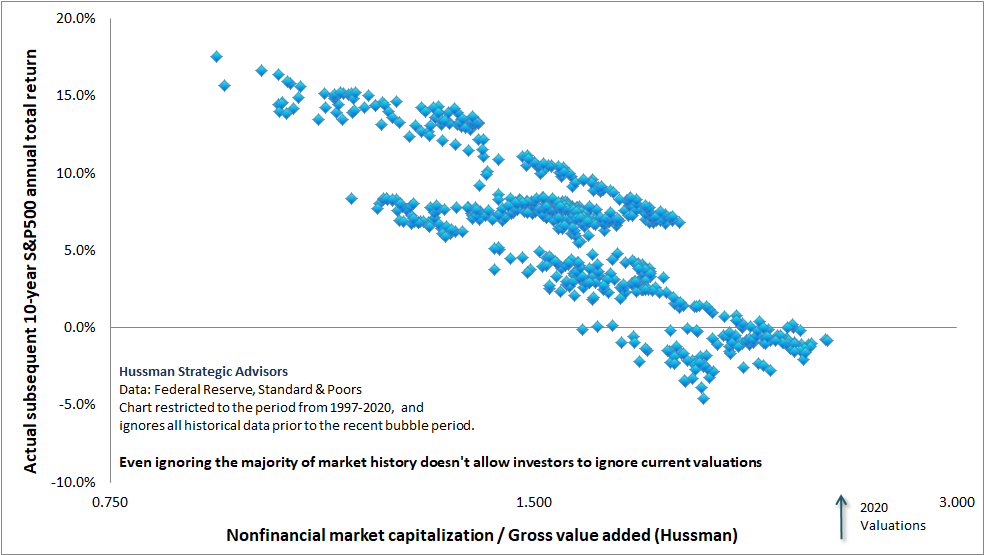
How do we know valuations are still informative? Because even if we completely restrict our data set to the period since the late-1990’s, we still observe a clear inverse relationship between valuations and subsequent market returns, particularly on a 10-12 year horizon.
The chart below shows our measure of nonfinancial market capitalization to corporate gross value-added, including estimated foreign revenues (MarketCap/GVA), versus the actual subsequent 10-year annual total return of the S&P 500, restricted to data since 1997.
Even during the bubble period, there has been no breakdown of the inverse relationship between valuations and long-term market returns. We don’t know what market returns will be over the coming decade, but the arrow shows where present valuations stand. Investors should be fully prepared for a decade of zero stock market returns.
See The Heart of the Matter for similarly consistent charts relating valuations and subsequent market returns across multiple, non-overlapping subsets of history.
A detailed discussion of valuation, beginning with basics, and extending to an analysis of the relationships between price, cash flows, growth rates, interest rates, profit margins, and implied long-term returns, is featured in my October 2017 comment, Why Market Valuations are Not Justified by Low Interest Rates.
Market internals
Much of the confusion surrounding valuations results from the mistaken belief that overvaluation must be resolved by negative short-term returns, and undervaluation must be resolved by positive ones. Again, that’s not how valuations work.
Market valuations might very well imply a rather low level of 10-year total returns averaging 4% annually, but if investors are eager to speculate, the market might compress it all into a shorter-term gain of 48%, far outpacing the near-term expectations of investors, but also leaving them with no likely additional return for the rest of the decade. Conversely, market valuations might very well imply 10-year total returns of 0% at a bull market peak, but if investors are inclined toward risk-aversion, the market might still endure a shorter-term collapse of 54% over the course of a bear market, as investors drive likely 10-year returns to 8%.
The fact is that valuations are enormously informative, but they are informative about a) long-term returns and b) the likely extent of potential losses over the complete market cycle. The main driver of investment returns over shorter segments of the market cycle is investor psychology, particularly the inclination of investors toward speculation or risk-aversion.
Since speculative behavior tends to be indiscriminate, we find that the best measure of this investor psychology is the uniformity or divergence of market internals across a broad range of individual securities, industries, sectors, and security types, including debt securities of varying creditworthiness.
Last month, I noted enough improvement in our measures of market internals to encourage an agnostic near-term outlook (though not a bullish one) despite several features that suggested the improvement was fragile. Not surprisingly, the improvement proved temporary. Despite strength in the S&P 500 and Nasdaq indices, we again observe the kind of internal dispersion that is permissive of “trap door” market losses. Needless to say, we evaluate these conditions on a continuous basis, so if we observe fresh improvement, we’ll defer the hard-negative market outlook that we presently hold.
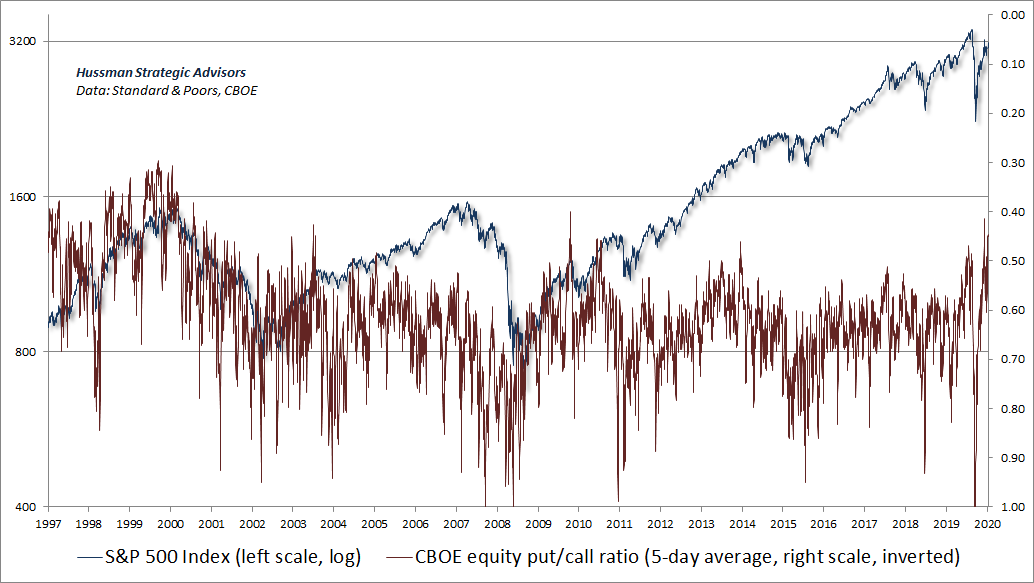
The chart below shows the S&P 500 versus the CBOE put/call ratio (right scale, inverted). There are few times in history that investors were quite so optimistic in the option market. Meanwhile, Investors Intelligence reports that 57.7% of investment advisors are bullish, versus just 18.3% that are bearish.
To be clear: our most reliable market valuation measures presently match the 1929 and 2000 extremes, and our gauge of internal uniformity is also unfavorable. Present conditions are characterized by an extreme “overvalued, overbought, overbullish” syndrome, which would not be enough encourage a bearish outlook if our measures of internals were favorable, but certainly adds to our concerns at present. Our immediate outlook will remain sensitive to shifts in market conditions. In particular, improvement in the uniformity of market internals would shift us to a neutral or constructive near-term outlook (with a safety net in any event). Here and now, however, my impression is that we are in the incubation phase of a much more serious downturn than investors seem to contemplate.
Valuations and discounted cash flows
One of the more intellectually disappointing claims about valuations is the idea that levels associated with various historical norms are merely arbitrary (“Where do you get that?”). Talk about lazy arguments. As I’ve noted before, a good valuation measure is simply shorthand for a proper discounted cash flow analysis. That’s another way of saying that – at least for properly constructed market valuation measures – there is a correspondence between valuation levels and subsequent returns.
Of course, you’ve got to get the estimated cash flows right. That’s why P/E multiples can be dangerous. A good valuation measure should compare the current price to a fundamental that’s representative and proportional to the very, very long-term stream of cash flows that the security is likely to deliver to investors over time. While earnings are certainly necessary to generate future cash flows, they tend to be enormously variable over the economic cycle. The denominator of a useful valuation measure should be a “sufficient statistic” for long-term cash flows.
As I’ve detailed in other commentaries, changes in profit margins are tightly related to changes in real unit labor costs. What matters isn’t next year’s profits, but deliverable cash flows over decades and decades. That’s why market returns are only weakly correlated with the S&P 500 P/E ratio, and are tightly correlated with valuation ratios based on more representative measures of future cash flows, particularly our margin-adjusted P/E (MAPE) and nonfinancial market capitalization to corporate gross value-added (MarketCap/GVA).
A nice way to demonstrate that stock prices are related to present discounted cash flows is to examine the actual stream of S&P 500 dividends all the way back to 1900. Below, at each point in time, the actual subsequent stream of per-share index dividends (which fully includes the impact of repurchases) is discounted to present value using a constant 10% discount rate. The blue line shows the ratio of the actual S&P 500 Index at any point in time to the discounted value of actual dividends that were subsequently paid to investors.
A good valuation measure is simply shorthand for a proper discounted cash flow analysis.
Quick technical note: a nominal growth rate of 4% is used for dividends beyond 2020, reflecting the recent 20-year growth rate of S&P 500 revenues, dividends, and nominal GDP, and consistent with the low structural growth rate (i.e. not driven by fluctuations in the unemployment) of GDP observed in recent decades. Also, there is no need for a terminal price in the dividend discount model because the present discounted value of a cash flow received in the infinite future is zero.
Why use a constant 10% discount rate? It’s arbitrary, but it does reflect what investors commonly view as a “typical” long-term stock market return. Think of it this way. At points in history when the ratio depicted by the blue line was at 1.0, we can infer that the S&P 500 was priced for a 10% long-term rate of return. When the ratio was higher than 1.0, the S&P was priced for long-term returns below 10%. If the ratio was below 1.0, it was priced for long-term returns above 10%. I could have chosen 6% or 12% instead – the choice merely affects what a ratio of 1.0 means about likely market returns.
Notice the red line on the chart. That’s our Margin-Adjusted P/E. Our preferred measure, MarketCap/GVA, looks similar, but the historical data doesn’t extend quite as far. Neither perfectly overlaps the blue line, but the relationship is closer than any valuation measure we’ve tested or introduced over time. That’s also why the MAPE and MarketCap/GVA have the strongest correlation with actual subsequent market returns across a century of market cycles: both of them convey much the same information as a proper discounted cash flow analysis.
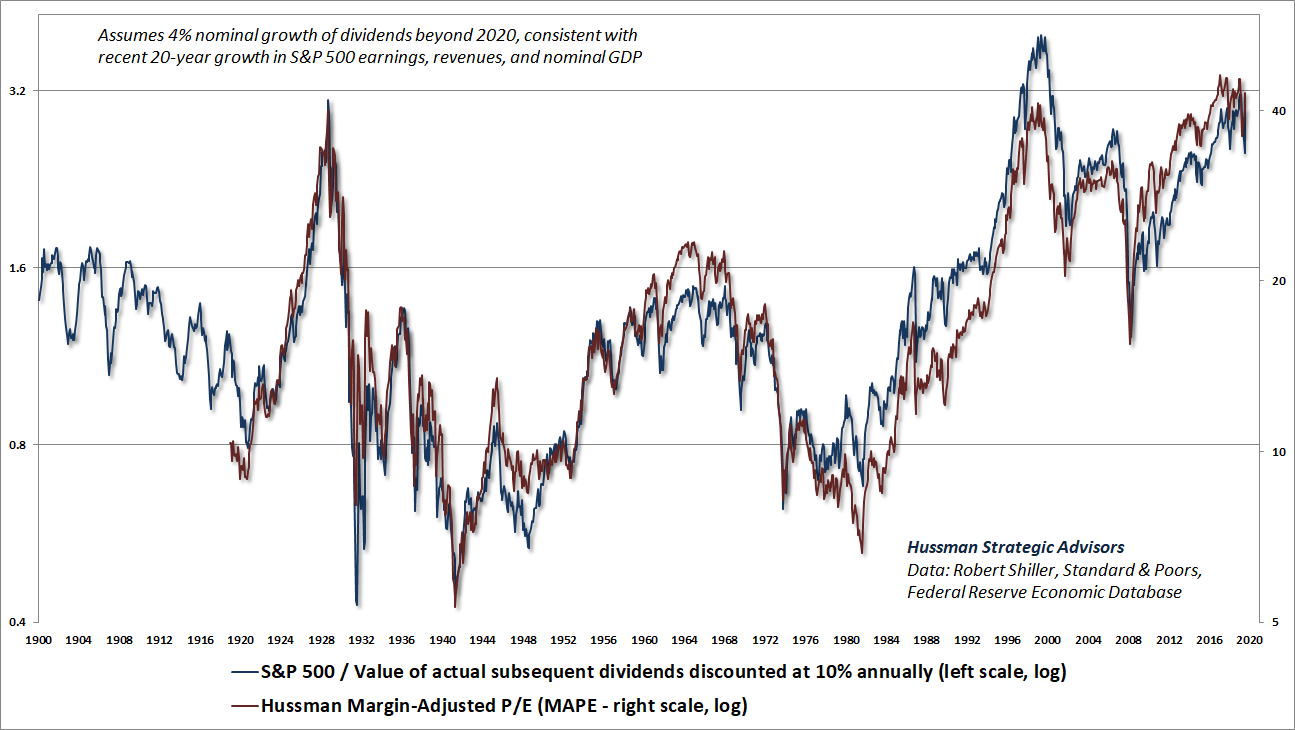
Perhaps it’s needless to observe that current valuations on all of these measures match those of 1929 and 2000. I’ll observe it anyway. Current valuations are essentially triple those that would be consistent with historically run-of-the-mill stock market returns of about 10% annually. This already implies that probable long-term investment returns will be dismal for passive investors. Notice also that this doesn’t assume any mean reversion at all. If there is mean-reversion in valuations, as there has been during every market cycle in history, including those since 2000, the outcome will be catastrophic for investors over the completion of this cycle, because it implies a nearly two-thirds loss in the S&P 500 simply to reach pedestrian historical norms.
Fundamentally unsound
Long-run salvation by men of business has never been highly regarded if it means disturbance of orderly life and convenience in the present. It is what causes men who know that things are going quite wrong to say that things are fundamentally sound.”
– John Kenneth Galbraith, 1954
I’d love to see us move – this is just me talking – from the rescue mission… it’s a fundamentally sound economy as the emergency passes and the openings occur.
– Lawrence Kudlow, CNBC, June 22, 2020
U.S. non-farm payrolls jumped by 4.8 million jobs in June, reducing the number of jobs lost since February to 14.7 million. Despite this gain, my impression remains that the U.S. is still in the “incubation phase” of an economic and financial downturn that is likely to be far more disruptive than we’ve observed to-date.
Remember that based on median U.S. income, the Paycheck Protection Program of the CARES Act covers 24 weeks of payroll costs for about 22 million Americans. In order for businesses to receive forgiveness for their PPP loans, they are required to restore the level of employment to pre-crisis levels. The original deadline was June 30, and though companies that have been unable to expend the funds or restore employment yet can extend the deadline to December 31, businesses could satisfy the criteria for forgiveness in June. My impression is that many did exactly that.
It’s also notable that once the funds are expended and employment is restored to pre-crisis levels, there is absolutely nothing that restrains companies from laying off the employees again. So it’s likely that a good portion of job “recovery” in June was for the purpose of temporarily satisfying the requirements of the PPP loans.
Frankly, I was not a great advocate of the PPP program, and instead advised in favor of creating a level playing field and tying loan forgiveness to actual economic damage. As things stand, even companies that have experienced little or no loss of revenues have been able to use their forgivable loans to cover payroll costs, which essentially means that Federal money has provided a direct subsidy to private profit for businesses that haven’t been harmed at all.
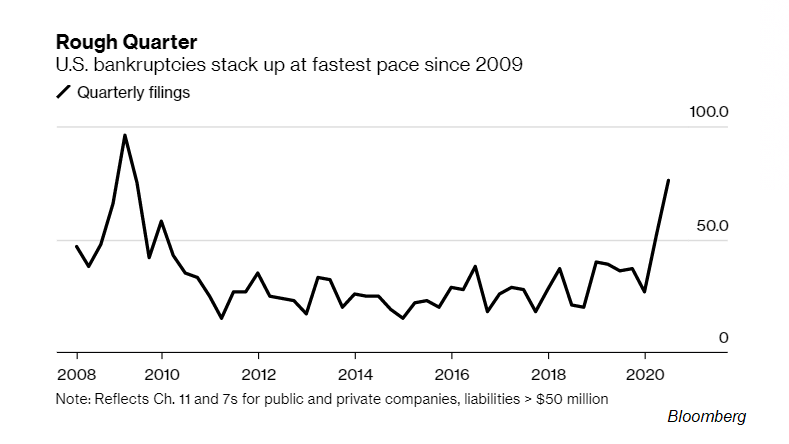
Meanwhile, amid $3 trillion in government support – poorly structured as it was – bankruptcies are already rising rapidly. The $600 weekly unemployment benefits provided in the CARES Act end on July 31, and the latest Pulse survey from the Census Bureau reports that 25.9% of households have already missed a rent or mortgage payment, or have little confidence in their ability to make next month’s payment. As I noted in May, the Federal Reserve has performed an amydalotomy on the public, intentionally destroying warning signs and discouraging realistic choices that would otherwise improve economic survival. My impression is that there are major dislocations quietly occurring underneath this illusory veneer.
For a discussion of appropriate economic support responses that I still believe will prove necessary as we move through this year, see the third portion of last month’s comment: Incubation Phase, as well as the May comment Amygdalotomy, and April’s comment Containing the Crisis.
Fed policy and investment discipline
Given a possible future that may include every sort of deranged and unprecedented monetary and fiscal policy, what should we do as investors? Our own response is straightforward. First, we have no intention of adopting or amplifying a bearish market outlook in periods when investors have the speculative bit in their teeth. Our best measure of that is uniformity in our measures of market internals.
Only one thing was legitimately “different” about the recent market cycle. In the face of zero-interest rate policy and other Fed interventions, historically reliable “overvalued, overbought, overbullish” conditions failed to impose any useful “limit” to investor speculation. In late-2017, we abandoned our bearish response to those syndromes, except in periods when market internals have explicitly deteriorated.
So don’t expect us to “fight” Fed-induced speculation in periods when our measures of market internals become uniformly favorable. Some conditions may be sufficiently extreme to warrant a neutral outlook, but in general, when our measures of market internals are favorable, our market outlook – at least near term – is likely to be constructive (with a safety net) as well.
Still, remember a critical distinction. We know very well from 2000-2002, 2007-2009, late-2018, early-2020, and indeed all of market history, that U.S. stocks have lost value, sometimes profoundly, in periods when the Fed has been easing but divergent market internals have indicated risk-aversion among investors. There’s a simple reason why easy money fails in those environments. When investors are risk-averse, low interest liquidity is a desirable asset, not an inferior one. So creating more of the stuff doesn’t encourage speculation.
The Fed’s brazen step into illegal actions (more on that below) has certainly encouraged a market rebound from the March lows (during which our own stance has been rather neutral until recently). But while our current outlook is presently hard-negative, a sustained market advance from here would likely result an improvement in market internals. That would shift us to a neutral or constructive near-term outlook, though with a continued safety net in any case. I don’t expect that sort of improvement, but there’s also no need to rule it out.
Don’t expect us to ‘fight’ Fed-induced speculation in periods when our measures of market internals become uniformly favorable. Some conditions may be sufficiently extreme to warrant a neutral outlook, but in general, when our measures of market internals are favorable, our market outlook – at least near term – is likely to be constructive (with a safety net) as well.
The bottom line is this. We shouldn’t be afraid of deranged Federal Reserve policy from the standpoint of our own disciplined, value-conscious, full-cycle investment discipline. We should be deeply concerned for other investors though, because further speculation will only worsen the subsequent collapse, which most investors will not understand or avoid. That’s because most investors have been led to believe that Fed easing is “good” for the market, without making any distinctions based on market internals or speculative psychology. So even when internals are negative, investors will still be hoping and holding based on the historically uninformed delusion that Fed easing is always enough.
Recently, the Fed has started to discuss the possibility of “yield curve control,” which would essentially amount capping interest rates – a form of price control where the Fed would commit to buying Treasury bonds to keep their yields from rising. Jerome Powell has mentioned “short term” yield control, but with short-term yields at the lowest levels in history, the Fed’s tendency toward mission creep would likely target longer-term Treasury yields as well.
Fortunately or unfortunately, we already have a good idea of how such a policy would end. It’s worth examining the outcome when the Fed tried the same thing in 1942, in an attempt to enable the enormous deficits of World War II. By 1948, inflation shot to 10% and a recession ensued, despite a 2.5% cap on long-term Treasury yields. As the Fed’s balance sheet expanded, the interest rate caps became untenable, and the Fed was ultimately forced to abandon the cap in 1951 amid a second inflation surge toward 10%.
Cash on the sidelines and zero prospective returns
As I observed early in the global financial crisis, you’re going to see a lot of chatter about “cash on the sidelines” in the months and years ahead. That’s because the Federal Reserve is creating a mountain of the stuff. The moment the Federal Reserve creates base money (currency and bank reserves) to purchase some asset, the base money it creates must be held by someone in the economy, at every moment in time, until it’s retired. A dollar of base money is just another type of “security.” A given holder of cash can try to get rid of it by buying other pieces of paper like stock shares or bond certificates, but the seller of the stocks or bonds immediately becomes the new holder of the cash.
So “cash on the sidelines” can certainly change ownership, but it can’t go “into” the stock market, or the bond market, or anywhere else, without coming right back out in someone else’s hands. Once a security is issued, that security has to be held by someone, at every moment in time, exactly in the form it was issued in, until that security is retired. That holds for base money as well.
Also remember that the moment the government runs a deficit, somebody has to run a “surplus” of income over and above consumption and net investment. That “surplus,” in equilibrium, is held in the form of whatever liabilities the government issued to do the spending. If the government finances the deficit by issuing Treasury bonds, someone is going end up holding more Treasury bonds. If the Fed buys the Treasury bonds and replaces them with base money, someone is going to end up holding more base money.
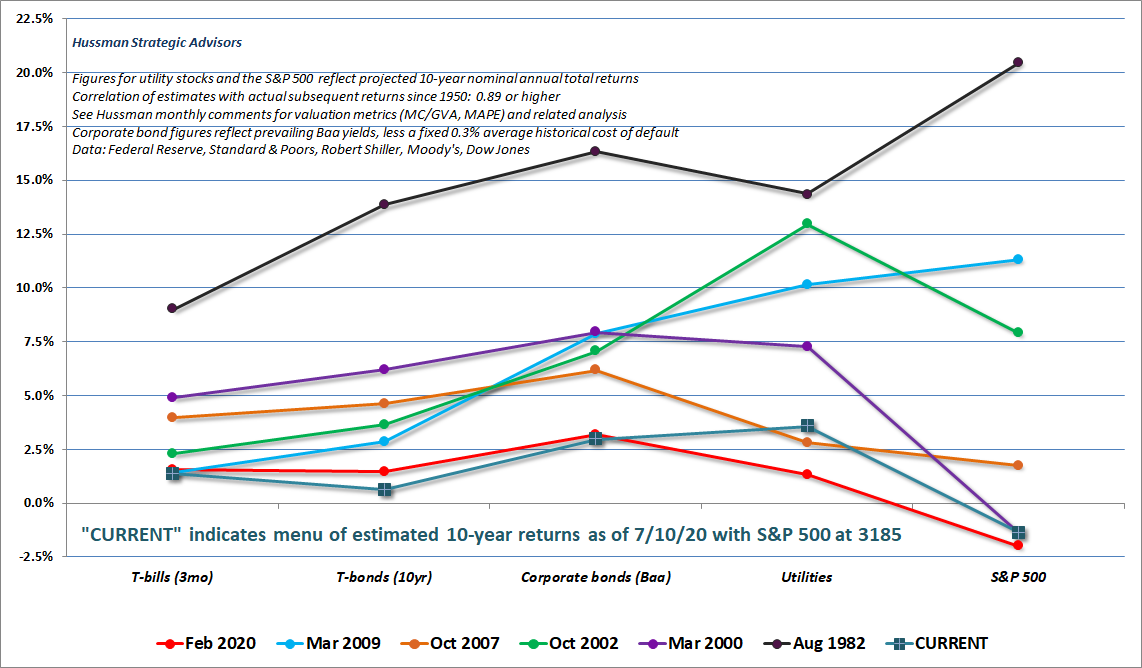
If investors are inclined to speculate, the pile of zero-interest hot potatoes created by the Fed can certainly encourage them to chase other assets, which is how the Fed has created an “everything bubble” in recent years. The problem is that as valuations rise, future return prospects fall, and we’ve now got the worst investment menu for passive investors in the history of the U.S. financial markets. Everything is priced for near-zero returns.
Saying that extreme stock market valuations are ‘justified’ by low interest rates is like saying that poking yourself in the eye is ‘justified’ by smashing your thumb with a hammer.
The chart below shows our estimates of prospective returns for a variety of asset classes based on methods which have a correlation of 0.89 or better with actual subsequent market returns. Each line shows a point of strong or dismal investment opportunity in recent decades. The current menu is among the most dismal investment profiles in history.
Meanwhile, the growing pile of “cash on the sidelines” is unlikely to stimulate consumption either. Why would holding “savings” in the form of zero-interest cash rather than zero-interest bonds materially change the financial planning of households or anyone else? The assumption seems to be that cash (ooh! cash!) must be consumed on goods, rather than paying down debt or remaining as bank balances.
In the end, someone is going to hold the base money, in the form of base money, until the base money is retired. The long-term financial planning of households and other sectors isn’t abandoned in favor of consumption the moment assets are held in a bank rather than a brokerage.
‘Cash on the sidelines’ can certainly change ownership, but it can’t go ‘into’ the stock market, or the bond market, or anywhere else, without coming right back out in someone else’s hands. Once a security is issued, that security has to be held by someone, at every moment in time, exactly in the form it was issued in, until that security is retired. That holds for base money as well.
On the illegal abuse of public funds by the Federal Reserve
Let’s begin with a simple observation: instead of using CARES funds in the manner that Congress intended – to make secured loans to States, municipalities and corporations suffering actual damage from the COVID-19 epidemic – the Fed is using Congressionally-approved crisis funds to buy corporate bonds from investors in order to boost valuations and protect bondholders from losses, with neither sufficient collateral nor evidence of inability to secure bank credit (both of which are legally required). Worse, the Fed is also creating base money to “leverage” these purchases. Let’s walk through why all of this is an illegal abuse of public funds.
Read the top line of a dollar bill. Then read the current provisions of Sections 14 and 13 of the Federal Reserve Act. Every dollar created by the Federal Reserve must be backed by a) gold; b) a government-backed IOU, typically Treasury securities, but also including securities guaranteed by foreign governments, or c) obligations arising out of commercial transactions or Section 13 emergency lending, both which must be explicitly backed by collateral “sufficient to protect taxpayers from losses.”
The reason for those provisions is simple. Under the U.S. Constitution, Congress is the only branch of government with spending authority. So the Federal Reserve Act is carefully written to prevent actions by the Federal Reserve that would amount to fiscal policy.
It’s notable that when the Federal Reserve Act used the word “discount,” it was intended for things like checks (notes, drafts) and commercial invoices backed by collateral (bills of exchange). In other words, the Fed was only supposed to provide liquidity needed to clear transactions. The Fed was never intended to buy uncollateralized corporate debt securities or junk bonds, or take those obligations onto the public books.
The word “discount,” as intended by the Federal Reserve Act, also had a time element. Discounting referred to buying an IOU, typically payable within 90 days, at a slight “discount” to its face value. That’s exactly how Treasury bills, for example, are priced. The Federal Reserve has contrived to reinterpret “discount” to mean long-term lending.
In addition, Section 13(2) attempts to clarify the nature of the collateral required in return for discounting of commercial obligations: “such definition shall not include notes, drafts, or bills covering merely investments or issued or drawn for the purpose of carrying or trading in stocks, bonds, or other investment securities, except bonds and notes of the government of the United States.”
To get a sense of how strongly the Federal Reserve Act was intended to avoid buying corporate securities with public money, or even to use them as “collateral” for Federal Reserve liquidity, read Section 13(8), which threatens that if any member bank is given an advance by the Federal Reserve, “and despite an official warning of the reserve bank of the district or of the Board of Governors of the Federal Reserve System to the contrary, increase its outstanding loans secured by collateral in the form of stocks, bonds, debentures, or other such obligations… secured or unsecured, for the purpose of purchasing and/or carrying stocks, bonds, or other investment securities (except obligations of the United States) such advance shall be deemed immediately due and payable, and such member bank shall be ineligible as a borrower at the reserve bank…”
Leveraged, uncollateralized corporate bonds aren’t their own collateral.
Section 4003 of CARES does allow the Fed to use a portion of the $500 billion allocated to states, municipalities, and corporations for the purpose of buying their securities on the secondary markets (i.e. directly from investors rather than lending to those entities directly). But “for the avoidance of doubt,” Section 4003(c)(3)(B) also requires that the use of CARES funds must adhere to 13(3), “including requirements relating to loan collateralization, taxpayer protection, and borrower solvency”.
Now, on the one hand, 4003(b)(4)(B) allows part of the $500 billion to be used for secondary market purchases of corporate bonds, but 4003(c)(3)(B) requires collateral sufficient to avoid public loss. So unless the Fed buys the corporate bonds as part of a transaction that also pledges collateral, even using funds provided directly by the Treasury to buy unbacked corporate securities is a violation. But even if the Fed is given leeway on that interpretation, it’s clear that it’s wholly and brazenly illegal for the Fed to “leverage” CARES funds by creating base money to buy uncollateralized corporate debt in amounts far beyond what Congress provided to the Treasury and the Fed for that purpose.
By the way, the special purpose vehicle (SPV) that the Fed is using to buy the bonds isn’t a loophole, it’s an end-run. The Fed is asserting the SPV is the “corporation” getting loans. The SPV then buys bonds with public money. As Bernanke did w/Maiden Lane, in clear violation of Section 13(3) of the Federal Reserve Act, they are trying to treat uncollateralized bonds as if the bonds themselves are their own collateral. Creating money to buy unbacked securities crosses an illegal rubicon, even for the Fed. Unchecked, the Fed could arbitrarily issue (i.e. print) and allocate purchasing power to anyone scribbling an IOU.
Oh, and by the way, when the Fed went into the market to buy high-yield junk bond exchange traded funds (JNK and HYG), the largest holding of both was the French wireless company Altice. Now the Fed is buying individual bonds, its largest holdings are the U.S. financing arms of Toyota, Volkswagen, and Daimler (wholly owned subsidiaries of those foreign corporations). It may or may not make you feel better that the 20 largest corporate bond holdings of the Fed, bought with money intended to support U.S. “states, municipalities, and eligible corporations” through this epidemic, also include the bonds of Apple, Microsoft, Oracle, Wal-Mart, Verizon, and AT&T, along with wholly owned subsidiaries of BMW, British Petroleum (BP) and the Belgian company InBev.
I’ll also note that Section 13(3), which applies to any Federal Reserve facility under the CARES Act, also requires that “before discounting any such note, draft, or bill of exchange, the Federal reserve bank shall obtain evidence that such participant in any program or facility with broad-based eligibility is unable to secure adequate credit accommodations from other banking institutions.” So even with respect to funds approved by Congress and directly allocated to the Fed by Congress, the Fed’s bond purchases are illegal unless Apple, Microsoft, Oracle, Wal-Mart, Verizon, and AT&T have suddenly found themselves unable to secure bank credit.
Shut it down. I worked with Jonathan Ferry (@jdronaldson) on this petition: change.org/NoMoreJunk
Read it and sign it, or better yet, print it out along with this section of commentary and send it to your representatives in Congress. You have more power to change things in this country if you’re willing to use a stamp.
The Fed has announced the intention to “leverage” the funds approved by Congress with additional money creation, in an amount ranging between 3-10 times what Congress actually allocated, in order to buy unsecured corporate bonds from private investors. Aside from the violations of law involved here, and the shift of private risk onto the public balance sheet, it’s important to understand is that the financial effect is to amplify speculation and the issuance of low-grade debt.
Recall the Fed-induced, yield-seeking speculation and mortgage bubble that produced the global financial crisis. As the Fed dropped short-term interest rates to 1% following the collapse of the tech bubble, investors desperate for higher yields chased mortgage securities, which had never experienced widespread credit issues. Wall Street responded by rapidly creating more “product” in the form of mortgage-backed securities, leading to a spree of sub-prime and no-doc loans, a housing bubble, and ultimately a financial collapse that produced millions of job losses, misallocation of scarce savings, and years of slow economic recovery. But see, everybody was happy with the Fed – borrowers were getting loans, Wall Street was getting fees, home builders were building houses (that would subsequently go into foreclosure). Worse, once the financial system collapsed, the Fed responded by magnifying the same policies that created the problem.
By the way, Fed action isn’t what ended the global financial crisis. The crisis ended with the stroke of a pen in the second week of March 2009, when the Financial Accounting Standards Board changed rule FAS-157 and allowed banks to use “discretion” in valuing their assets, rather than marking them to market.
The Fed won’t be marking the value of its corporate bond portfolio to market prices either. So they’ve got that going for them.
I get it. Everybody is happy. Investors are happy because the market has rebounded. Congress is happy because Powell keeps saying “these are lending powers, not spending powers” even though the Fed is creating new money to buy unbacked corporate securities in amounts far beyond what Congress approved. The public is happy because, at least temporarily, it is anesthetized to believe that the prosperity of Wall Street is somehow an indication of prosperity on Main Street (see Incubation Phase for a refresher on the lags involved here).
But you have to understand that the only way to sustain elevated valuations is to sustain depressed future investment returns. You have to understand that propping up low-grade securities vastly increases their issuance to unsuspecting investors (even the SEC had the sense to prohibit Hertz from doing that to take advantage of small speculators). You have to understand that the Fed is literally printing and allocating purchasing power in return for unbacked assets that may prove to be worth far less. That’s spending.
People are most credulous when they are most happy.
-Walter Bagehot
It’s essential to provide support to the economy, but the way to do that is to ensure that policies a) create a level playing field; b) direct public funds as close as possible to the point they enter the circular flow of the economy – which means primarily basic family incomes and contractual payment obligations; c) avoid the use of public funds to subsidize extraordinary incomes, corporate profits, or to absorb private investment losses; and d) limit loan forgiveness to those that have suffered actual economic damage.
A note on wealth disparities
Recently, Jay Powell argued that Fed policies “absolutely” do not contribute to wealth disparities.
Look. The richest 10% of Americans own 88% of the $29 trillion in corporate stock and mutual fund shares, according to data from the Federal Reserve itself. As a direct result of Fed-induced speculation and the public perception of a Fed “backstop”, the most reliable valuation measures (including market capitalization/GDP) are at the most extreme levels in history, while corporate bond valuations are also at or near historic extremes.
Understand how this works. Elevated security valuations confer purchasing power to those 10% of Americans that they would not otherwise enjoy. When the Fed defends overvaluation, it also defends the ability of investors to use those securities as a type of currency – whether for stock-based acquisitions, sales, or other transactions.
Fed-induced overvaluation allows the wealthiest individuals in the U.S. to obtain real goods, services, and capital from others by selling or borrowing against their securities. The longer the Fed allows the “currency” of overvalued securities to command U.S. output and capital, the more the Fed amplifies wealth disparities.
As an investor, you may like that. But think about it for a bit, and it should also become clear that the only way to defend overvalued prices is also to defend depressed long-term returns. Overvalued markets can only be protected by destroying future investment prospects and by misallocating capital.
Of course, if enough holders were to attempt to sell their securities simultaneously, much of the presumptive “wealth” in overvalued market capitalization would vanish into thin air. In order to prevent the destruction of speculative wealth, the Fed would have to actually buy the overvalued securities, replacing the “speculative” currency held by investors with actual currency created by the Federal Reserve.
That’s actually what the Fed is doing here, despite the fact that it violates the Federal Reserve Act. Congress should not be misguided enough to allow the Fed to create U.S. base money in order to relieve investors of unbacked corporate securities. The Fed should not be allowed to shift the risk of unbacked corporate securities from private investors to the public.
The moment those securities lose value, the Fed will have effectively created money without taking enough legally-required collateral to protect the public from losses. This is quite literally a crime, akin to counterfeiting billions of dollars. George Floyd was killed over a sketchy $20.
Public health note
Provided that containment efforts are strong, the total number of cases can be expected to follow a ‘logistic’ growth trajectory, where the growth rate of new cases progressively declines toward zero as the total number of cases stabilizes. Without strong containment, the total number of cases would follow an ‘exponential’ growth trajectory more closely. My impression is that, in practice, we may observe a mixture – logistic growth in areas that are (or quickly become) well-contained, but exponential growth in smaller hubs. That kind of mixture would produce a sort of stop-start profile in total global cases, where the total number of cases stabilizes, then takes off again for a period of time.
– John P. Hussman, Ph.D, Make Good Choices, February 25, 2020
One of the most distressing aspects of the COVID-19 epidemic is how many people have been running their own little 5th grade science experiments on viral spread, to learn what science already knows.
The SARS-CoV-2 virus is primarily spread by suspended particles in shared airspace, preferentially infects respiratory linings and alveolar cells in the lung, and suppresses their front-line defenses (particularly Type III and Type I interferons). It has now killed 135,000 Americans. This virus is novel, but there’s an enormous amount that we know about it, both from a rich literature on related respiratory coronaviruses, as well as a continually growing literature on distinctive aspects of this one.
My impression is that while the infectivity of SARS-CoV-2 is likely due to accessory proteins of the virus that knock down respiratory defenses, the lethality of COVID-19 (the resulting disease) is largely due to infiltration and retention of highly inflammatory blood cells into lung tissue, that then degrade, perforate, and cross through the alveolar-capillary barrier. The result is cell damage to alveoli (the air sacs that the lungs use to exchange oxygen with the blood) and to vascular linings, so that fatality is driven by the combination of oxygen deprivation and thrombosis. This is not the flu.
In recent weeks, we’ve seen rapid outbreaks in Florida, Texas, and several other states, largely in the same places where protective measures like distancing and masks were disregarded. This isn’t really a “second wave.” It’s more like the start-stop profile of local outbreaks that was predictable even in February. The only surprise is that it has involved entire states, because somehow, well-understood features of epidemiology and cell biology have become subjects of wildly ignorant political debate. Having written on the urgency of containment beginning on February 2, when the U.S. had only 5 cases and zero deaths, watching this predictable, slow motion train wreck has been excruciating.
It is increasingly clear that the primary mode of transmission for SARS-CoV-2 is exhaled air from infected individuals. There’s some evidence that toilet bowls and hospital floors also act as reservoirs for expelled viral particles, but unless you’re regularly sticking your hands into toilet bowls or wiping them on hospital floors, the most likely way to acquire the virus is from expelled air. The half-life of suspended (“aerosolized”) particles in a room without much ventilation is over an hour, and while some masks clearly provide better filtration than others, even cloth and bandana-type masks substantially reduce the number and distance of expelled particles. So even the crudest mask will reduce the viral load to others.
A good analysis of a super-spreading event in Washington State at a Skagit Valley Chorale rehearsal concluded, “the risk of infection is modulated by ventilation conditions, occupant density, and duration of shared presence with an infectious individual.” Exactly.
Yet even taking basic protective measures for oneself and others seems to be a problem. When people imagine that not wearing a mask in an indoor public place is somehow an expression of their “individual freedom,” or that it’s “hurting the economy,” they’re not only endangering everyone else – they’re also ensuring that much more stringent measures will be necessary later in order to avoid mass fatalities. It’s exactly the weak, dismissive response – especially early on, but then encouraged almost daily – that has put U.S. fatalities ahead of every other country on Earth.
Indeed, researchers at Harvard recently estimated that “Between 70% and 99% of the Americans who died from this pandemic might have been saved by measures demonstrated by others to have been feasible.” Meanwhile, across 22 countries, there’s an 80% correlation between non-wearing of masks and number of deaths-per-million. That correlation is higher than for the percentage of elderly and the percentage with high body-mass index. Containment measures are critical when and where transmission rates are high.
A useful way to think about transmission is that, based on what we know about the infectivity of SARS-CoV-2, stabilizing the spread of the virus requires a roughly 63% reduction (=1-1/R0) in “susceptible” contacts. Until we have a vaccine or better therapeutics, stabilizing the epidemic requires either 63% immunity in the population as a whole, or a combination of reduced contacts and shared infective airspace that produces the same effect.
This doesn’t even require hard “lockdown” or economic disruptions. It just requires enough common sense to use a combination of efforts to reduce infective contact by about 62% in order to substitute for immunity. That combination of measures includes setting gatherings outdoors when possible, keeping some social distance, maximizing fresh airflow, limiting group size, and wearing a mask in confined indoor locations like stores, elevators, offices, and shared transportation. It’s the combination of containment actions that matters.
Based on geospatial modeling of virus transmission, we should be particularly careful about areas that act as “hubs” that bring together multiple individuals that were previously separated and would not interact otherwise. It’s no surprise that the cities with major international airports, like New York, Seattle, D.C., Houston, and Chicago have been epicenters of the epidemic. Schools have the same effect, though to a smaller degree. I’m concerned that this will become a challenging issue as we move into October and November, when people begin to shift activities back indoors and previously isolated groups are brought together.
A few charts will update the current situation. The first thing to note is that the changes in the trajectory of fatalities in the U.S. have not been because of changes in how the virus behaves, but because of changes in how we behave. The dismissive early response to the epidemic let the genie out of the bottle, so that by April, what I called the “optimistic” projection already implied 60,000 U.S. fatalities. We went “off book” to a new curve in mid-April, and we’ve now bumped it up further. What we do in the immediate future will determine whether we follow the orange trajectory (which is now my “optimistic” projection) or the light purple one.

One of the current debates is whether the growing number of reported cases are due to an increasing rate of infection or simply better testing. My answer is both.
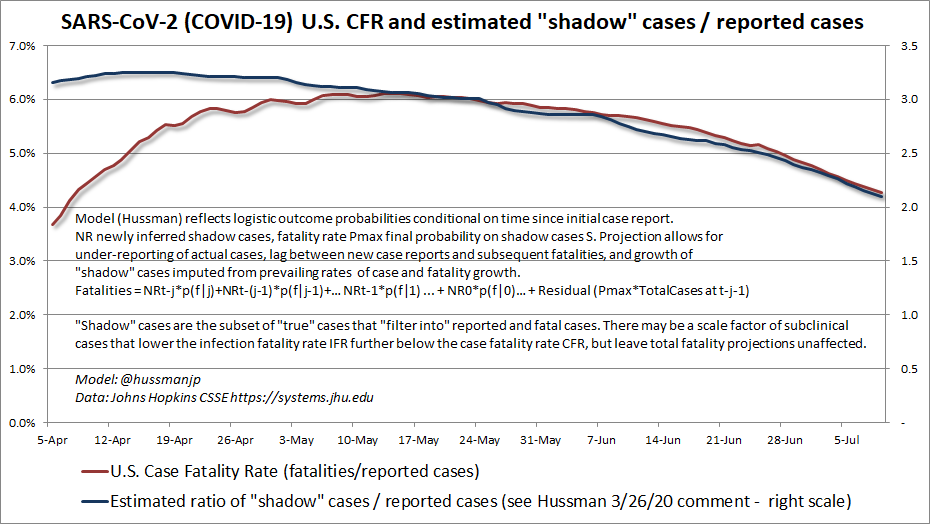
As I noted back in March, a changing relationship between fatalities and reported cases reflects a changing gap between unreported “shadow” cases and reported ones. Specifically, while reported U.S. case numbers have been exploding, the ratio of fatalities to reported cases (the “case fatality rate”) has been falling. I strongly believe that this reflects better testing. Basically, we’re seeing a narrowing in the gap between “shadow” cases and reported cases.
I define “shadow” cases as those that ultimately feed into reported cases and fatalities. There may also be subclinical or asymptomatic cases, so “actual” cases may exceed shadow cases by some scale factor. In any case, if the “true” fatality rate is relatively constant, shadow cases will maintain a fairly stable relationship with fatalities.
The chart below shows what’s going on. The red line shows the U.S. case fatality rate, which is currently at 4%, but falling from 6.5% back in April. Meanwhile, the blue line shows my estimate of “shadow” cases to reported cases.
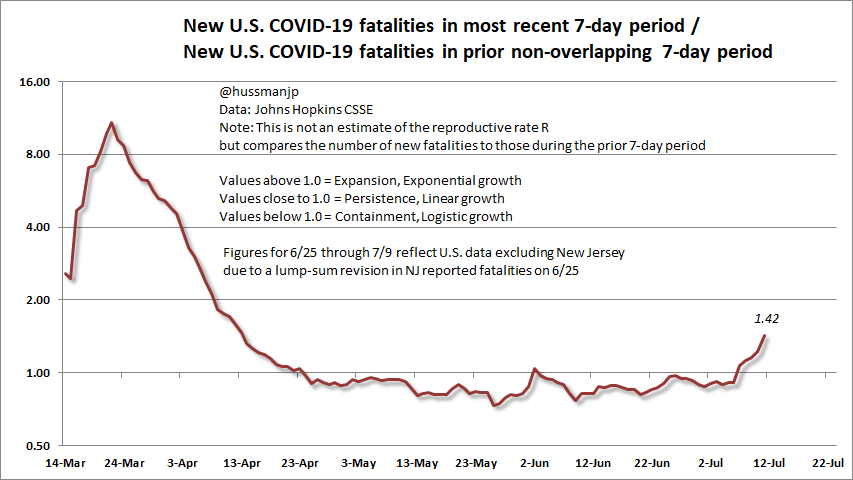
So yes, we’re doing better on testing, and that’s a good thing. Unfortunately, we’re also seeing an accelerating rate of transmission. We can see this by comparing the 7-day total of U.S. fatalities with the number of fatalities in the previous, non-overlapping 7-day period. This ratio was persistently below 1.0 in May and June, but has suddenly exploded higher. This isn’t the “second wave.” It’s just another needless extension of the first. Again, my main concern is about the October-November period.
It’s estimated that about half of all COVID-19 cases may be asymptomatic. We also know that viral shedding (infectivity) can begin a couple of days before symptoms emerge. Between those two factors, it’s likely that most people are not even aware of when they’re most infective. That’s a challenging situation because it means that without reasonable precautions, lots of people will transmit the virus without even knowing it. Moreover, given that a constant 2.15% fatality rate on “shadow” cases has almost perfectly modeled actual fatalities, I would estimate that the “true” fatality rate of COVID-19 is about 1.08%.
Similar calculations also suggest that the actual number of U.S. cases, symptomatic or not, is about four times the number that has been reported, which would mean that we’ve had 135,000 fatalities, nearly 13 million actual cases, and about 4% of the population infected. Those estimates seem about right to me. They also imply over 2 million U.S. fatalities if we were to abandon containment efforts and just let this thing progress to “herd immunity.” Still, I hope that these estimates are wrong, and that there are far, far more asymptomatic cases than we think.
Vaccine development is important, and we can buy time for that with containment measures. Again, that doesn’t mean “lockdown” – it means a combination of reasonable actions that substitute for immunity. Equally important (and much of my work at the Hussman Foundation in recent months) is research toward repurposing already approved pharmaceuticals for a) prophylaxis to increase the defense of respiratory cells against the virus; b) interventions for early to moderate disease, focused on reducing the viral load, suppressing inflammatory signaling, and reducing the expression of certain molecules that recruit and retain inflammatory blood cells at the capillary-alveolar barrier, and; c) acute-stage interventions aimed at disrupting the inflammatory cytokine storm and suppressing lung tissue inflammation. There’s good work being done on these fronts. I just wish there was less distortion from politics and claims about magic bullets.
A final note. Over 35,000 Americans die in vehicle accidents every year. Seat belt use in the United States is about 90%. Roughly 10% of Americans don’t wear them. Half of all crash fatalities come from each of those two groups. That’s another way of saying that unclicking that belt results in a 9-fold increase in the likelihood a crash will be fatal. Vehicle fatalities are the leading cause of death between ages 5-34. I’m a big fan of seat belt laws, but if you choose not to wear a belt, at least you’re not hurting anyone else.
When it comes to public, shared-airspace settings, using a mask isn’t about you. Refusing to wear one is like unclicking the seat belts of all of your passengers, and then texting while driving into oncoming traffic.
I worry that the virus is more patient than people are.
– Ron Klain, Fmr U.S. Ebola Response Coordinator, 3/20/20
Keep Me Informed
Please enter your email address to be notified of new content, including market commentary and special updates.
Thank you for your interest in the Hussman Funds.
100% Spam-free. No list sharing. No solicitations. Opt-out anytime with one click.
By submitting this form, you consent to receive news and commentary, at no cost, from Hussman Strategic Advisors, News & Commentary, Cincinnati OH, 45246. https://www.hussmanfunds.com. You can revoke your consent to receive emails at any time by clicking the unsubscribe link at the bottom of every email. Emails are serviced by Constant Contact.
The foregoing comments represent the general investment analysis and economic views of the Advisor, and are provided solely for the purpose of information, instruction and discourse.
Prospectuses for the Hussman Strategic Growth Fund, the Hussman Strategic Total Return Fund, the Hussman Strategic International Fund, and the Hussman Strategic Allocation Fund, as well as Fund reports and other information, are available by clicking “The Funds” menu button from any page of this website.
Estimates of prospective return and risk for equities, bonds, and other financial markets are forward-looking statements based the analysis and reasonable beliefs of Hussman Strategic Advisors. They are not a guarantee of future performance, and are not indicative of the prospective returns of any of the Hussman Funds. Actual returns may differ substantially from the estimates provided. Estimates of prospective long-term returns for the S&P 500 reflect our standard valuation methodology, focusing on the relationship between current market prices and earnings, dividends and other fundamentals, adjusted for variability over the economic cycle.