

Detached Parabolas and Open Trap Doors


John P. Hussman, Ph.D.
President, Hussman Investment Trust
February 2021
The nutshell is this: the old line economy stocks just don’t work because they have earnings and eventually rising interest rates impact earnings. New economy stocks have no earnings, so investors don’t see a need to exit.
– Wall Street analyst on CNBC, early March 2000, said with a perfectly straight face
Nothing so animates a speculative herd as a parabolic price advance in an asset detached from any standard of value. I am convinced that future generations will use the present moment to define the concept of a reckless speculative extreme, in the same way our generation uses “1929” and “2000.”
I included the CNBC quote above in an investment research letter I published on March 7, 2000, at the peak of a bubble that would ultimately take the technology-heavy Nasdaq 100 down by an improbably precise -83%. I say “improbably precise” because this is how I opened that same letter:
“On Wall Street, urgent stupidity has one terminal symptom, and it is the belief that money is free. Investors have turned the market into a carnival, where everybody “knows” that the new rides are the good rides, and the old rides just don’t work. Where the carnival barkers seem to hand out free money just for showing up. Unfortunately, this business is not that kind – it has always been true that in every pyramid, in every easy-money sure-thing, the first ones to get out are the only ones to get out. We’ve seen two-tiered markets before: most prominently in 1929, 1968-69, and 1972. Even at those pre-crash extremes, the S&P never sold above 20 times record earnings. The market clearly faces problems at a multiple of 32. Technology stocks will ultimately fare worse. Over the past 5 years, the revenues of S&P 500 technology companies have grown at a compound annual rate of 12%, while the corresponding stock prices have soared by 56% annually. Over time, price/revenue ratios come back in line. Currently, that would require an 83% plunge in tech stocks (recall the 1969-70 tech massacre). The plunge may be muted to about 65% given several years of revenue growth. If you understand values and market history, you know we’re not joking.”
– John P. Hussman, Ph.D., March 7, 2000
One of the hallmarks of every bubble is a loss of interest or ability of investors to distinguish between investment and speculation. Once that mentality has taken hold, and prices become wildly elevated, it is impossible to sustain the bubble without also making its consequences worse. In 1934, Benjamin Graham and David Dodd described the spectacular errors of investors that ultimately contributed to the 89% market loss between 1929 and 1932. One error was the willingness to abandon concern for the concept of “investment” – the purchase of securities at prices that provide a reasonable expectation of adequate return. The companion error was a growing enthusiasm for price-insensitive, passive investment approaches.
In the latter stage of the bull market culminating in 1929, the public acquired a completely different attitude to the investment merits of common stocks. Why did the investing public turn its attention from dividends, from asset values, and from average earnings, to transfer it almost exclusively to the earnings trend, i.e. to the changes in earnings expected in the future? The answer was, first, that the record of the past were proving an undependable guide to investment; and, second, that the rewards of offered by the future had become irresistibly alluring.
Along with this idea as to what constituted the basis for common-stock selection emerged a companion theory that common stocks represented the most profitable and therefore the most desirable media for long-term investment. This gospel was based on a certain amount of research, showing that diversified lists of common stocks had regularly increased in value over stated intervals of time for many years past.
These statements sound innocent and plausible. Yet they concealed two theoretical weaknesses that could and did result in untold mischief. The first of these defects was that they abolished the fundamental distinctions between investment and speculation. The second was that they ignored the price of a stock in determining whether or not it was a desirable purchase.
The notion that the desirability of a common stock was entirely independent of its prices seems incredibly absurd. Yet the new-era theory led directly to this thesis. An alluring corollary of this principle was that making money in the stock market was now the easiest thing in the world. It was only necessary to buy ‘good’ stocks, regardless of price, and then to let nature take her upward course. The results of such a doctrine could not fail to be tragic.”
– Benjamin Graham and David L. Dodd, Security Analysis, 1934
I decided this month that the best way to illustrate the weight of this moment in history would be to juxtapose quotations from prior financial bubbles alongside charts of current market extremes. They may give you a nosebleed. One might benefit from the lessons of history by realizing how broadly this market exhibits the hallmarks of a generational speculative peak.
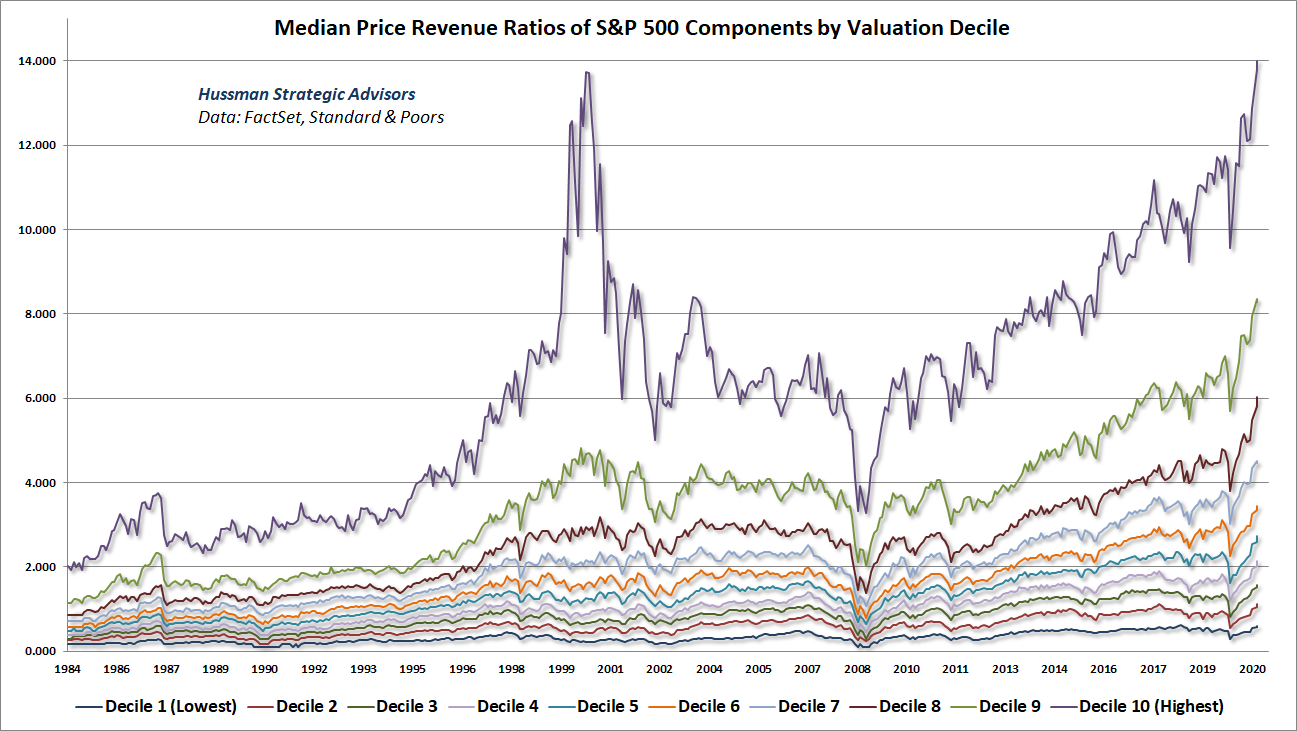
The chart below shows how investors were pricing the “good stocks” in the S&P 500 as of January 22. Each line represents a decile (10%) of the S&P 500, ranked by price/revenue ratios. Among the stocks in the top valuation decile at the 2000 market peak, the median drawdown loss by October 2002 was about 80%. Yet many stocks in the broad market were actually reasonably valued from a historical perspective even at the 2000 market peak. In recent weeks, that top valuation decile has eclipsed its 2000 peak. The difference from 2000 is that every other decile just hit the highest level in history as well.
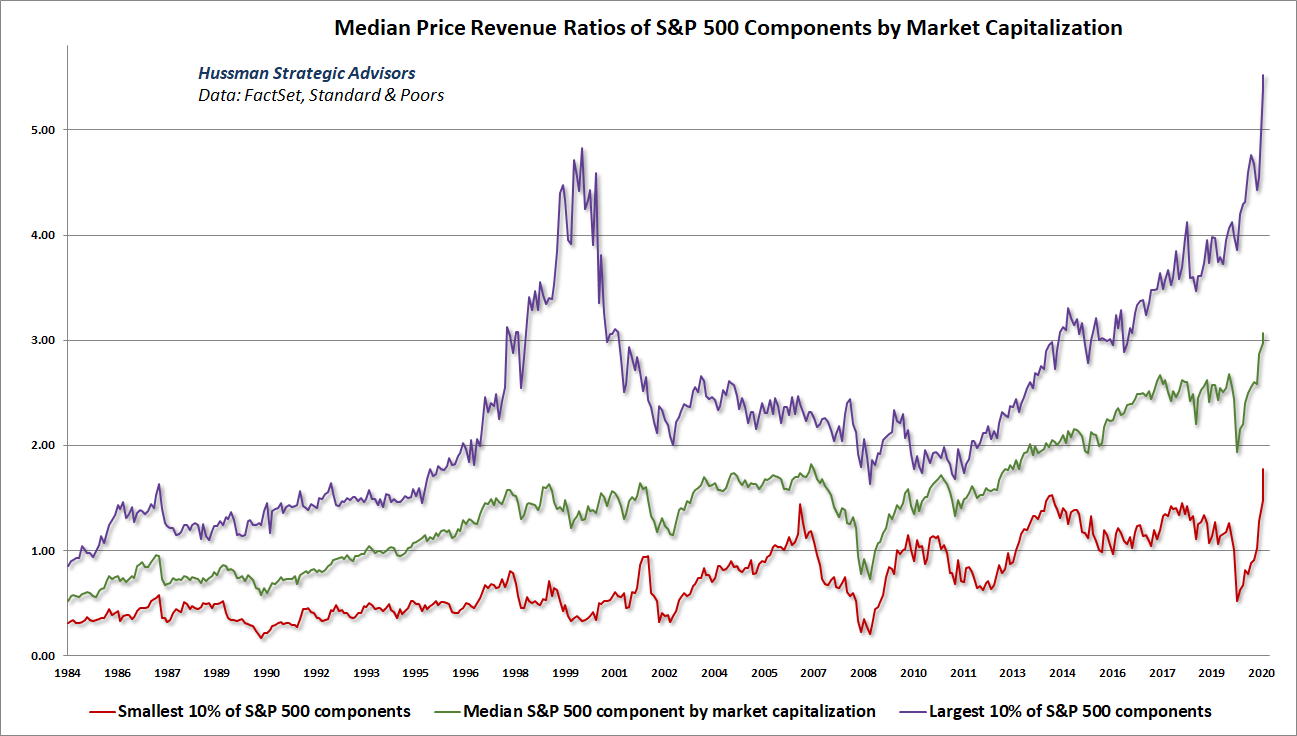
The current situation would not be as dangerous if the stocks in the highest valuation deciles accounted for a small percentage of S&P 500 market capitalization. Unfortunately, that is not the case. The largest S&P 500 components by market capitalization have eclipsed the price/revenue multiples observed among the largest stocks at the 2000 pre-collapse peak, while the smallest S&P 500 components have eclipsed the price/revenue multiples observed at the 2007 pre-collapse peak. As my friend Jesse Felder puts it, this is an “everything” bubble.
The willingness of investors to abandon historical standards of value has played out at other cycle extremes. In the early-1970’s, the “Nifty Fifty” mania emerged based on that same idea that Graham and Dodd lamented about the 1929 peak – the notion that “it was only necessary to buy ‘good’ stocks, regardless of price, and then to let nature take her upward course.”
Blue Chip Performance: 1973-1974
Du Pont -58.4%
Eastman Kodak -62.1%
Exxon -46.9%
Ford Motor -64.8%
General Electric -60.5%
General Motors -71.2%
Goodyear -63.0%
IBM -58.8%
McDonalds -72.4%
Mobil -59.8%
Motorola -54.3%
PepsiCo -67.0%
Philip Morris -50.3%
Polaroid -90.2%
Sears -66.2%
Sony -80.9%
Westinghouse -83.1%
If the mindset of price-insensitive “passive” investing has repeatedly set investors up for profound losses, so too has been frantic speculation in non-profitable stocks appealing to the “hopes and dreams” of investors. As Graham and Dodd observed about the rampant speculation at the 1929 peak, investors abandoned sound fundamentals partly because “the rewards offered by the future had become irresistibly alluring.”
This 2015 scene from HBO’s Silicon Valley perfectly captures the current mindset of investors.
Viewer discretion advised: more than a few expletives
The situation is reminiscent of a story related by Burton Malkiel in his classic 1973 book, A Random Walk Down Wall Street:
I have a good friend who once built a modest stake into a small fortune. Then along came a stock called Alphanumeric. In addition to providing an exciting name, it also promised to revolutionize the method of feeding data into computers. My friend was hooked. I begged him to investigate first whether the huge future earnings that were already reflected in the price could possibly be achieved given the likely size of the market. (Of course, the stock had no current earnings.) He thanked me for my advice, but dismissed it by saying that stock prices weren’t based on ‘fundamentals’ like earnings and dividends. ‘They are based on hopes and dreams’, he said. And so my friend had to rush in before the crowd could bid up the price. And rush in he did, buying at $80, which was close to the peak of a craze in that particular stock. The stock plunged to $2, and with it my friend’s fortune.
– Burton Malkiel, A Random Walk Down Wall Street, 1973
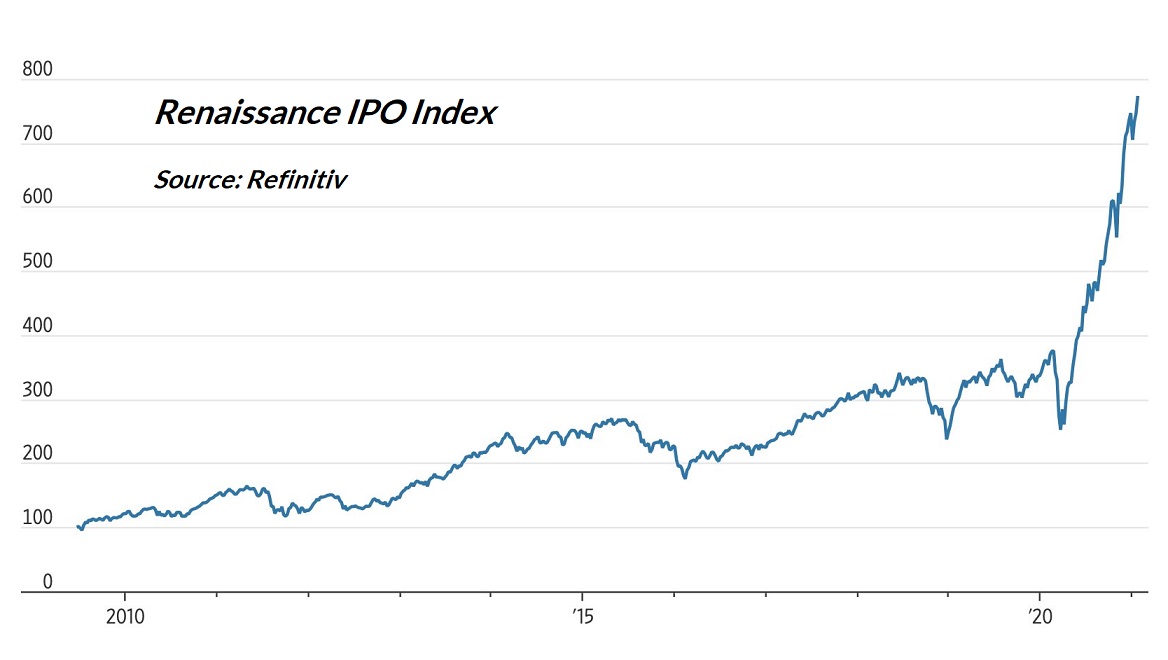
Writing about “the various symptoms of dementia” that characterized the late-1960’s “Go-Go” bubble in growth stocks and conglomerates, John Brooks described the “shooters” – stocks that would double or triple in a day, “oblivious of the fact that the companies they represented were often neither sound nor profitable: the garbage stocks that everyone could make money on just so long as, and no longer than, everyone could contrive to hold his nose and avert his eyes and imagine that the garbage was actually nourishing and palatable.” Often, those “shooters” would be new issues – perfect objects from which to detach any relationship between price and value.
If one fact is glaringly clear in stock-market history, it is that a new issues craze is always the last stage of a dangerous boom – a warning of impending disaster almost as infallible as Cheyne-Stokes breathing is a warning of impending death. But not so inexorable; if heads could be cooler and memories longer, investors both large and small, professional and amateur, might ward off danger by reading the signs, eschewing the new issues, and lightening their commitments generally. But investors, like other human beings, tragically repeat their mistakes; when the danger signs are plain, the lure of easy money blanks their memories and dissipates their calm.
-John Brooks, The Go-Go-Years, 1973
Obviously no one rationally would want to buy at the top, and yet enough people do to produce a top. It is really quite amazing how time horizons and money goals can change when there are stocks around that are going up 100 percent in six months. Finally it all turns into a marvelous carmagnole that is great fun if you leave the party early.”
– Adam Smith, The Money Game, 1967
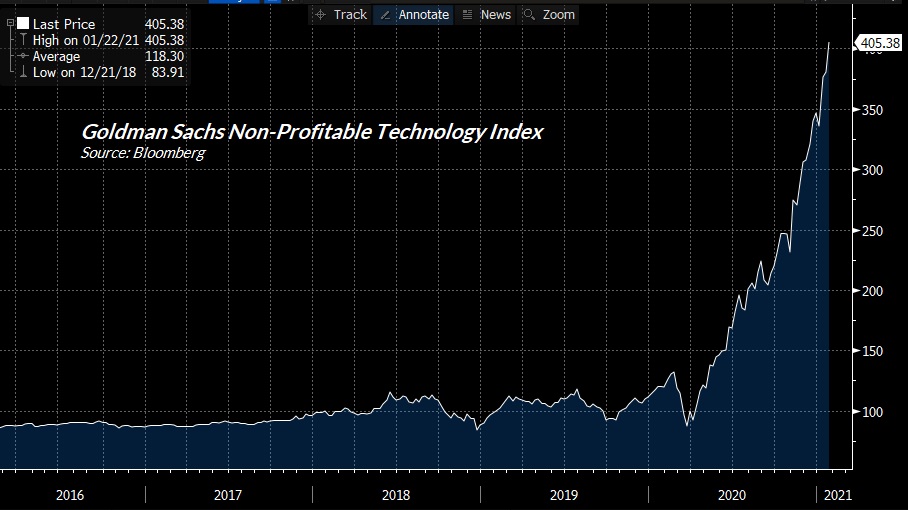
Few spectacles in recent memory exemplify this “marvelous carmagnole” more than the exuberant squeeze on heavily shorted stocks by Robin Hood and a rag-tag band of punch-drunk merry men. Not surprisingly, most of these companies have no earnings. That’s part of what has made them favorites of short sellers. Yet it’s also important to understand that every time a share of stock is sold short, a new share is essentially “created,” and some buyer has purchased it. So a stock that is “heavily shorted” is also “heavily owned.” Many of the stocks that are currently targets of short squeezes were actually reasonable value stocks several months ago, despite earnings stumbles. Many have since become not only fully-valued but wildly overextended. I expect that much of this will end in tears, but as Smith wrote, it can be “great fun if you leave the party early.”
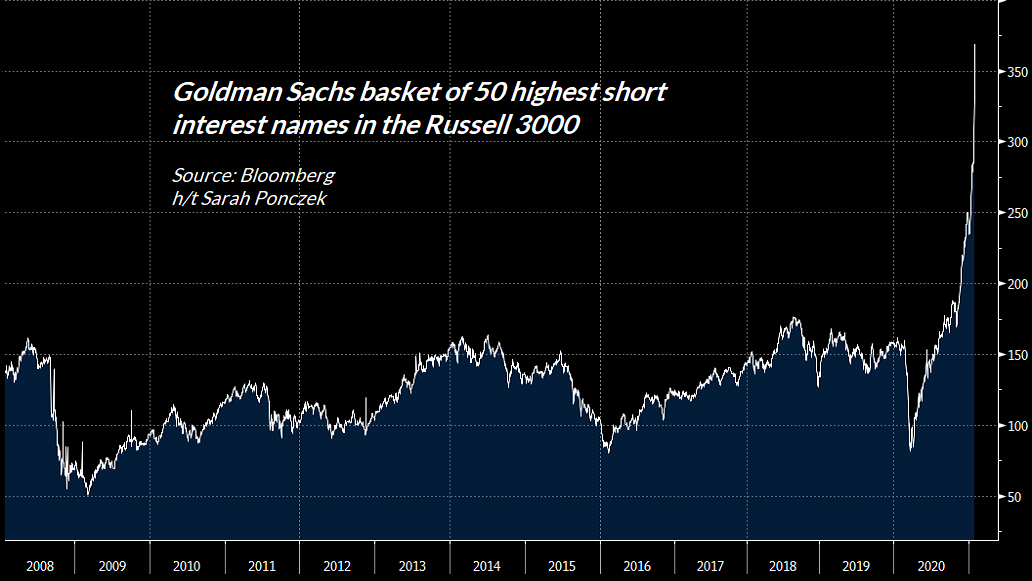
It’s fitting that amid the conversion of the financial markets into a speculative online casino, the most extreme short squeeze has involved a company that sells video games. From my perspective, what’s concerning isn’t the short squeeze, but the characteristics of the tick-by-tick trading data, which is remarkably discontinuous, particularly in the context of the high trading volumes we’re seeing. An actual two-sided market with this amount of volume would generally have continual back-filling between bids and offers. Instead, you see lines and angles that make intra-day trading look more like a polygon than a bar chart. The behavior smacks of a marriage between a short-squeeze and a high-frequency trading algorithm, which I suspect may be front-running and amplifying the impact of actual human order flow. I’ve been staring at price-volume behavior for 40 years. This trading doesn’t look right.
Skipping down the street hand-in-hand with the speculative extreme in valuations is the speculative extreme in leverage. Margin debt – the amount of money that investors have borrowed in order to buy stocks – is now at the highest level in history, not only in absolute terms, but also relative to U.S. GDP. Notice that spikes in the ratio of margin debt to GDP are distinct markers of speculative extremes like 1987, 2000, 2007, and today. As Jim Grant wrote decades ago, “The way to wealth in a bull market is debt. The way to oblivion in a bear market is also debt, and nobody rings a bell.”
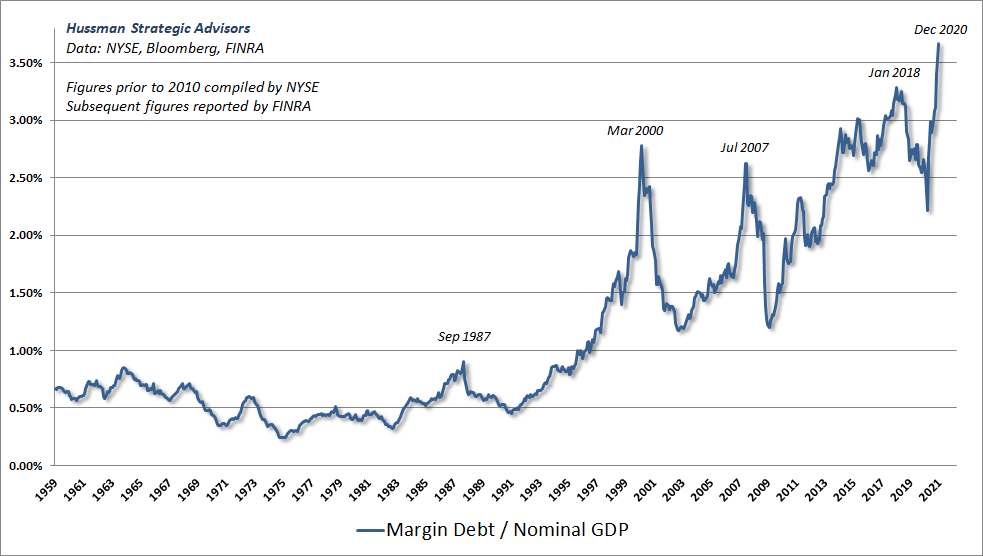
In this context, understand that the same “forced buying” that drives short-sellers to cover at any price during a squeeze has a flipside: the “forced selling” that drives leveraged investors (and even just heavily invested ones) to sell at any price during a panic. Keynes wasn’t talking about unleveraged bears when he wrote “markets can remain irrational longer than you can remain solvent.” He was writing about losing three-quarters of his wealth as a leveraged bull during the market collapse of the Great Depression. Given the combination of the most extreme valuations in history and the most highly-leveraged investment stance of investors in history, the potential risk of forced selling is not a risk to be taken lightly.
Of all the mysteries of the stock exchange there is none so impenetrable as why there should be a buyer for everyone who seeks to sell. October 24, 1929 showed that what is mysterious is not inevitable. Often there were no buyers, and only after wide vertical declines could anyone be induced to bid … Repeatedly and in many issues there was a plethora of selling orders and no buyers at all. The stock of White Sewing Machine Company, which had reached a high of 48 in the months preceding, had closed at 11 on the night before. During the day someone had the happy idea of entering a bid for a block of stock at a dollar a share. In the absence of any other bid he got it.
– John Kenneth Galbraith, 1955, The Great Crash
I’ll say this again. I believe that future investors will look back on the present moment the same way that we look back on the 1929 and 2000 extremes. People will use us to teach lessons to their children.
The Fed has learned nothing, and the public will be hurt
The way to wealth in a bull market is debt. The way to oblivion in a bear market is also debt, and nobody rings a bell. Easy access to credit facilitates the marginal transaction. It enlarges the gross national product, expands the debt industry, and creates the rationale for a future relaxation of lending standards. It hefts up prosperity by its bootstraps and makes it something more than it would otherwise be. It produces stupendous fees and underwriting commissions for investment bankers. Good ideas become bad ideas through a competitive process of “Can you top this?” But when the cycle turns, the process must swing into reverse. Marginal transactions, financed by debt, must be unwound through foreclosure or bankruptcy. Asset values, propped up by debt, must fall, and thereby reduce other asset values in a chain reaction.
– James Grant (“Michael Milken, Meet Sewell Avery” 1989)
I used the quote above to begin one of my market comments in August 2007. One of the most disappointing aspects of the global financial crisis that followed a few months later is that utterly nothing was learned from it.
Here’s what investors should understand about that crisis. After the 2000-2002 market collapse, the Federal Reserve cut short-term interest rates to just 1%, which was then the lowest level in history. In response, yield-starved savers began looking for alternatives that might offer them a “pickup” in yield. They found that alternative in mortgage securities, which to that point had never experienced widespread defaults, and seemed to offer a perfect combination of safety and yield.
In response to Fed-induced yield-seeking demand of investors for mortgage securities, poorly regulated Wall Street institutions scrambled to create more “product” by taking making mortgage loans to anyone with a pulse, and using financial engineering to package even high-risk, default-prone loans into highly rated securities. As depressed interest rates and “no doc” mortgages fueled a housing bubble, mortgage originators also used the opportunity to create loans, and sold them to government-backed entities like Fannie Mae and Freddie Mac. As I observed at the time, much of the worst credit risk in the U.S. financial system was held by investors “precisely because they piggyback on the good faith and credit of Uncle Sam.”
Predictably, it ended badly. Critically, Fed intervention was not what ended the global financial crisis. The global financial crisis ended – and in hindsight, ended precisely – on March 16, 2009, when the Financial Accounting Standards Board abandoned FAS 157 “mark-to-market” accounting, in response to Congressional pressure from the House Committee on Financial Services on March 12, 2009. That change immediately removed the threat of widespread bank insolvency by making insolvency opaque. This might not have meant much if regulators had continued to insist on mark-to-market when evaluating bank solvency. But with regulators willing to go along, the global financial crisis ended with the stroke of a pen. The Fed’s contribution to the recovery was this: by holding short-term interest rates and bank funding costs at zero for a decade, banks were gradually able to fill the hole in their balance sheets. That recovery of bank balance sheets came at the expense of savers who earned nothing in their accounts.
The immediate problem is that this whole process of Fed-induced yield-seeking speculation and demand-driven issuance of low-grade securities has now been wholly reproduced, but in magnified form. The only difference is that the objects of speculation involve common stocks, leveraged loans, and corporate debt with “covenant lite” features. Investors and policy makers seem to have little grasp that all of this has happened before, and an even weaker grasp of what is likely to happen next.
Sadly, Federal Reserve policy makers remain blind to their own role in creating repeated bubbles, crashes, and financial crises, focusing instead on wildly activist monetary policies that have little correlation with actual subsequent economic outcomes, beyond what can be explained by pure mean-reversion. The Fed is like a mechanic that loosens the wheel bolts on people’s cars because he thinks it will improve their mileage, then shrugs “we don’t have the tools” to keep their cars from swerving into the ditch.
Here’s a tip. Maybe stop loosening those wheels. Stop putting everyone at risk from experimental fixes that aren’t in the manual and produce consequences that you don’t comprehend. The swerving and crashes are your own doing.
How then, should monetary policy react to unusually high prices of houses – or of other assets for that matter? In my view, it makes sense to organize one’s thinking around three consecutive questions – three hurdles to jump before pulling the monetary policy trigger. First, if the bubble were to deflate on its own, would the effect on the economy be exceedingly large? Second, is it unlikely that the Fed could mitigate the consequences? Third, is monetary policy the best tool to use to deflate a house-price bubble? My answers to these questions in the shortest possible form are, ‘no,’ ‘no,’ and ‘no.’
– Janet Yellen, Housing Bubbles and Monetary Policy, October 2005
[facepalm]
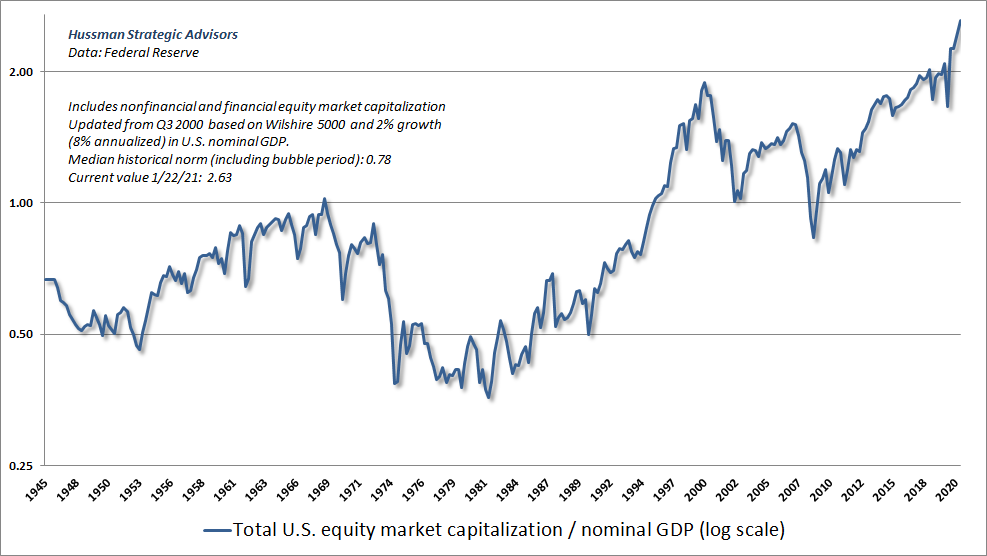
To get a sense of how extreme valuations have become after a decade of deranged monetary activism, the chart below shows the ratio of U.S. total equity market capitalization to GDP. The present ratio is 2.63. The historical norm – not the low, the norm – is 0.78, about 70% below the current level.
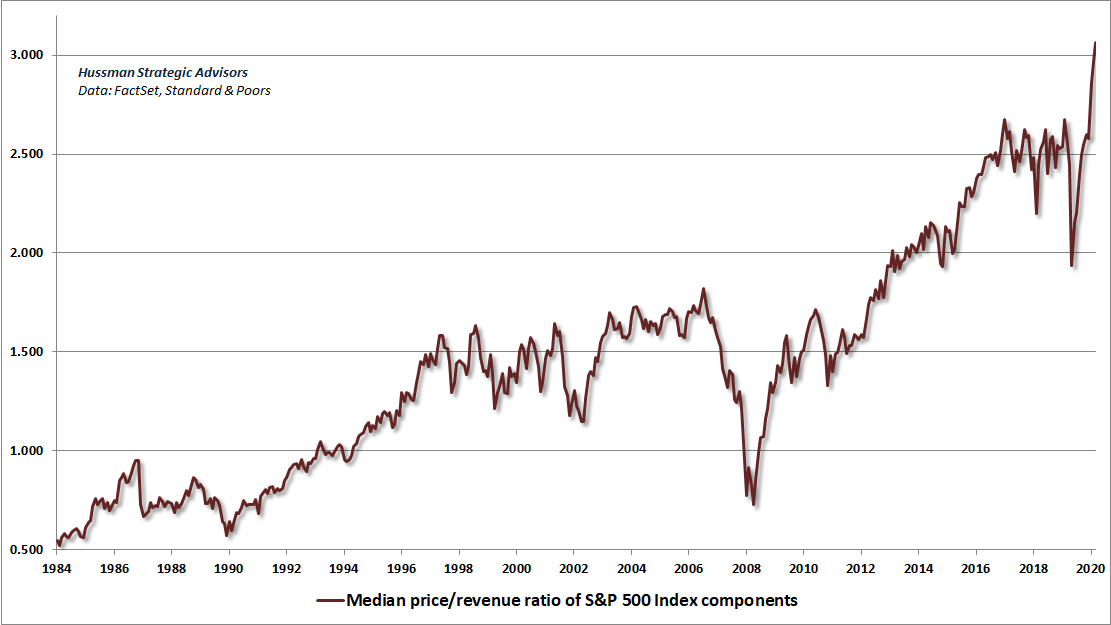
The chart below shows the median price/revenue ratio of S&P 500 components. The fact that this is so profoundly beyond the 2000 peak underscores the breadth of this “everything bubble.” Back in 2000, the extreme overvaluation of the market had a “two-tier” quality in which “old economy” stocks were largely abandoned. While there’s no question that the largest capitalization stocks in the S&P 500 are also the most steeply overvalued, it should also be clear that the current bubble has not left “pockets of value” in the broad market.
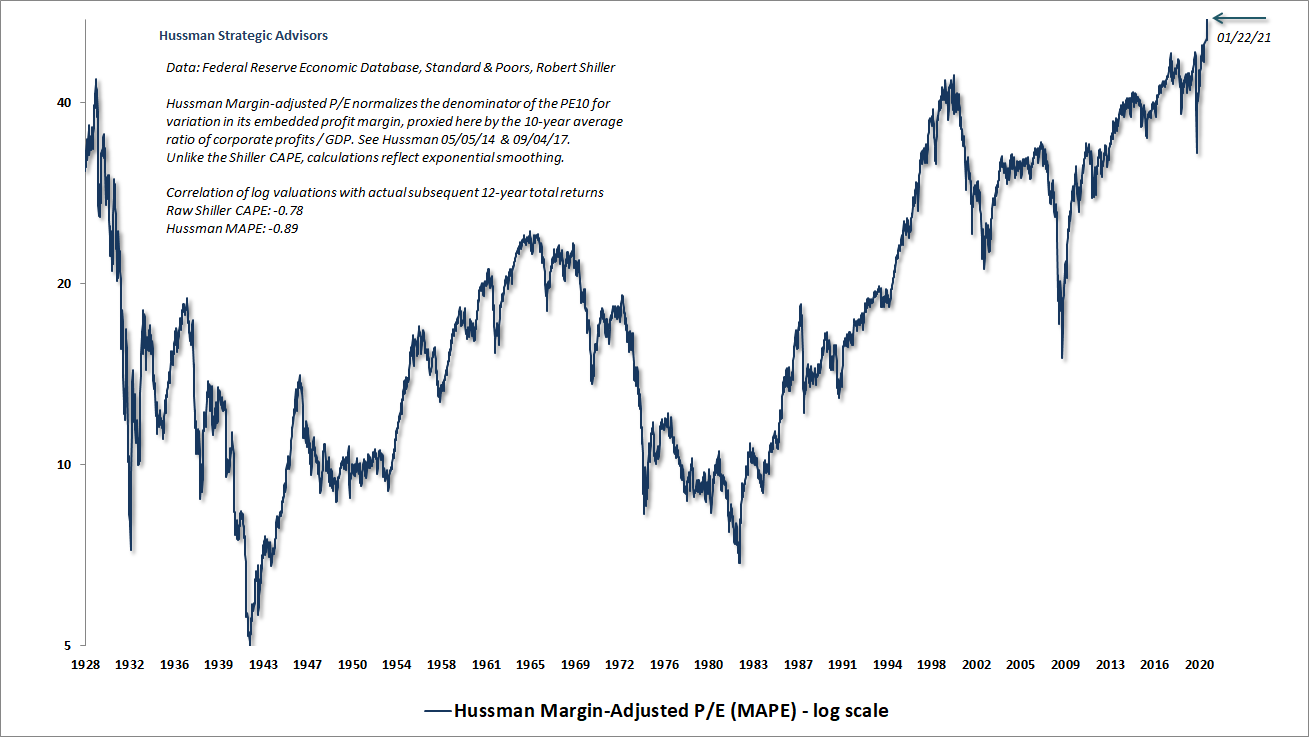
The chart below shows our Margin-Adjusted P/E (MAPE), which is one of the two measures we find best correlated with actual subsequent S&P 500 total returns over the subsequent 10-12 years. It is presently beyond the extremes observed at the 1929 and 2000 market peaks.
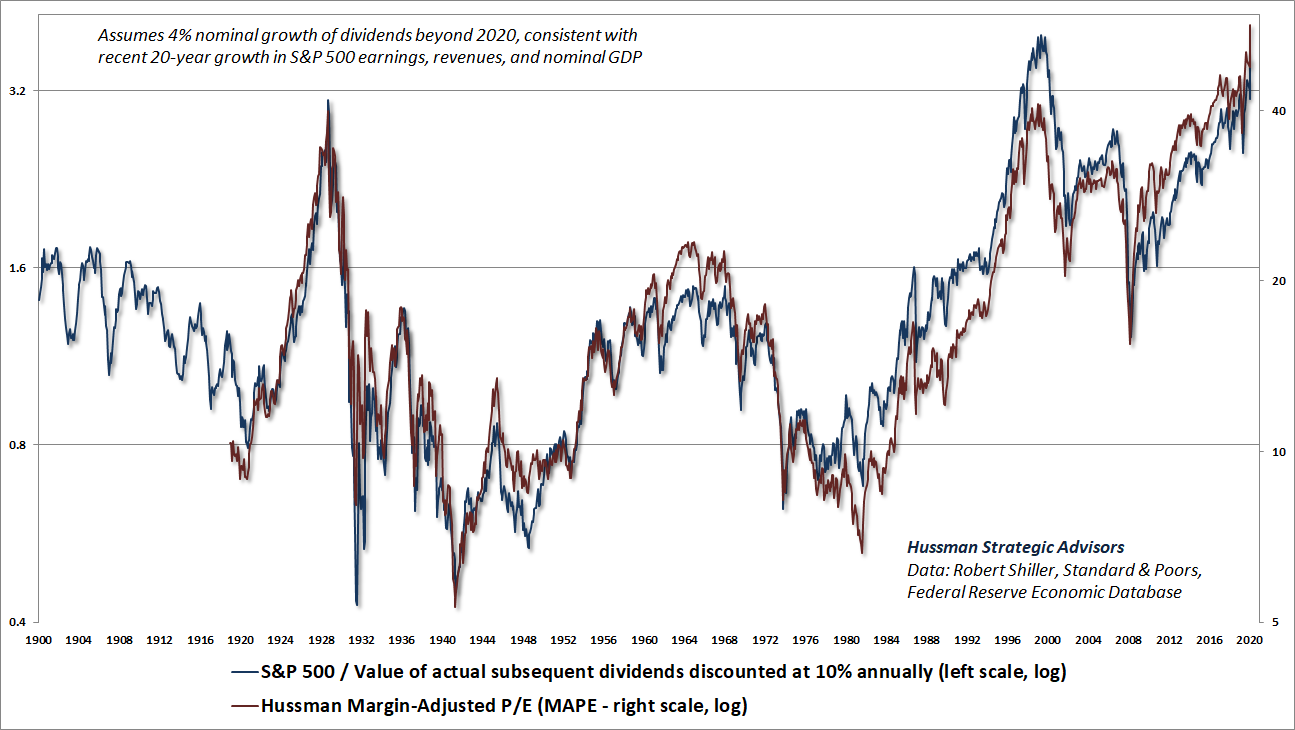
I’ve often observed that a security is nothing but a claim on a future stream of cash flows that investors expect to be delivered into their hands over time. Jeremy Grantham of GMO made the same point in an interview last week – “A measure of true value is the long-term discounted value of a future stream of dividends.”
As long as recognizes that stock buybacks are fully captured in the divisor that determines the “per share” dividends of the S&P 500 Index, it’s rather easy to show that the valuation measures that are best correlated with actual subsequent S&P 500 total returns are those that largely mirror the valuation that one would obtain from a proper discounted cash flow analysis. For individual stocks, it’s also important to treat future lump sums, such as expected future buyout payments or liquidation value, as a terminal “dividend.”
The chart below is based on actual S&P 500 Index dividends since 1900. At each point in time, I’ve discounted actual subsequent dividends back to present value using a fixed 10% discount rate (dividends beyond 2020 are assumed to grow at a 4% annual rate, which is essentially the growth rate of nominal GDP and S&P 500 revenues over the past two decades). I’ve applied a fixed 10% discount rate, which results in a “present discounted value” or PDV such that – when the S&P 500 was at that same level – investors could, by definition, expect long-term investment returns averaging 10%. When the ratio of SPX/PDV was greater than 1.0, it means that stocks were priced at a level that could be expected to produce long-term returns below 10%. Conversely, when the ratio was below 1.0, it means that stocks were priced at a level that could be expected to produce long-term returns above 10%. The discount rate is somewhat arbitrary, but whatever you choose, you have to hold it fixed so that the level 1.0 has a specific meaning.
Overlaid on this chart, on the right scale, is our MAPE. Personally, this is one of my favorite charts, because it demonstrates that a good valuation measure is nothing but shorthand for a proper discounted cash flow analysis.
You know in your heart of hearts you have never taken this level of risk, and you never thought you would.
Jeremy Grantham, January 22, 2021, Why Grantham Says the Next Crash will Rival 1929, 2000
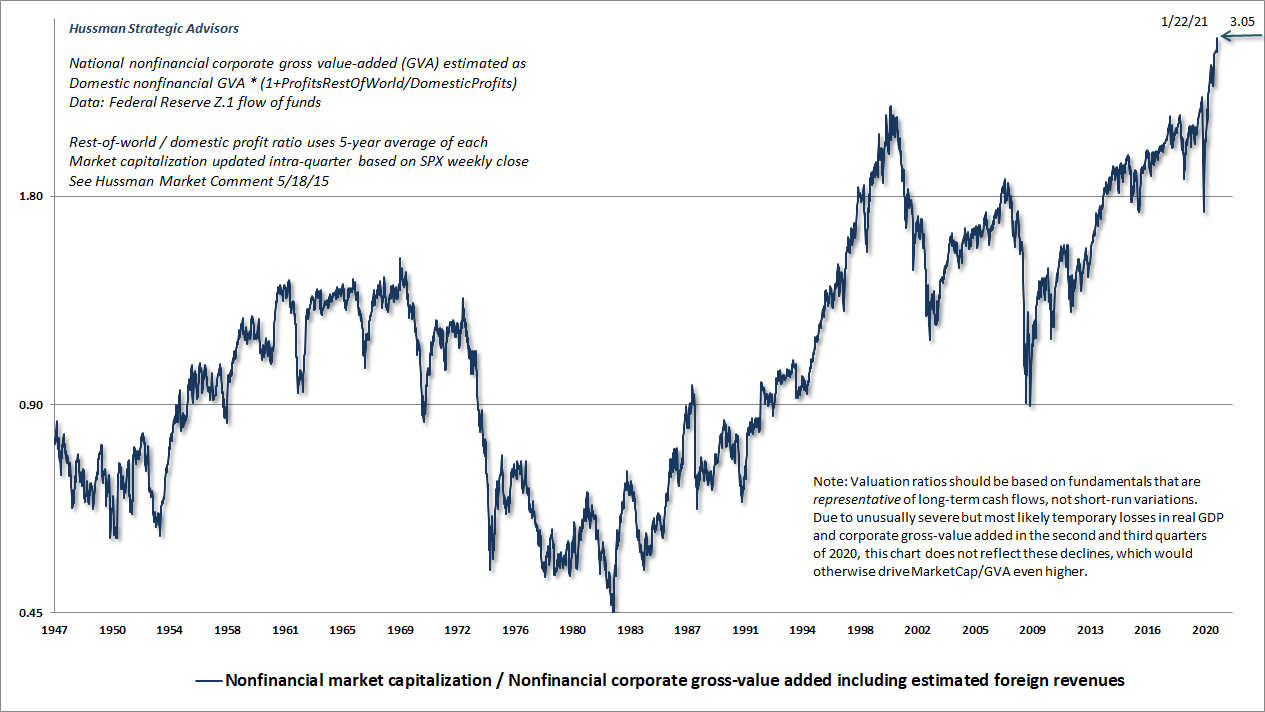
The chart below shows our measure of nonfinancial market capitalization to corporate gross value-added, including our estimate of foreign revenues. This measure, MarketCap/GVA, is better correlated with actual subsequent market returns than any other measure we’ve ever studied or introduced.
It’s important to understand that Fed easing “supports” the stock market only by affecting investor psychology. The Fed buys interest-bearing securities and replaces them with zero-interest base money. That’s it. Instead of holding savings in the form of a Treasury security, someone holds their savings in the form of a bank balance. The fact that they have a zero-interest bank balance instead of a low-interest Treasury bill doesn’t mean they change their consumption or retirement plans. It just means someone in the economy has more psychological discomfort, because every dollar of base money created by the Fed has to be held by someone at every moment in time until it is retired.
You can try to get “out of” cash by buying stocks, but only by bidding up stock prices enough for a seller to accept the cash in return. Yes, you now own more stocks, but your cash is now held by that seller. There are no “sidelines.” Every security is held, exactly as before. Nothing has changed except the owners. The problem is that the psychological impulse to own something other than cash, regardless of price, has created a situation where stock market valuations have been bid up to levels that imply negative S&P 500 total returns for well over 12 years.
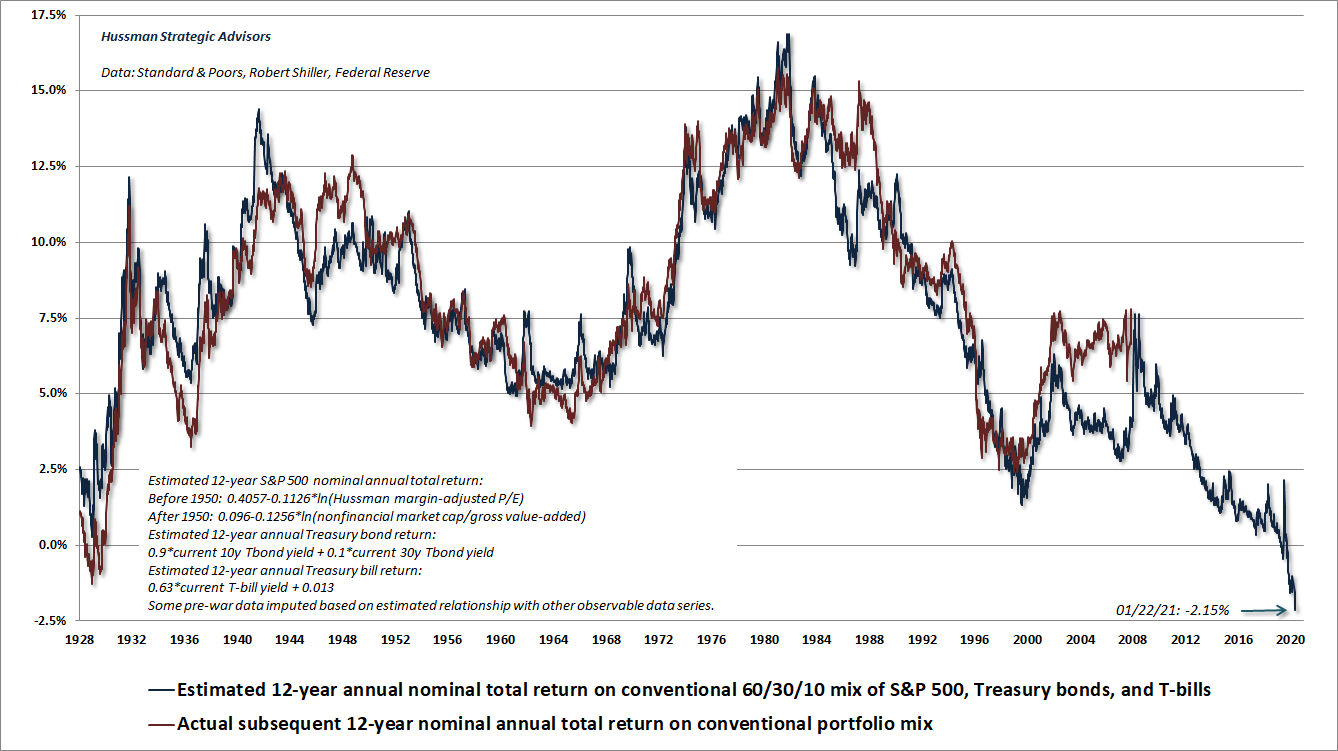
The chart below shows our estimate of likely 12-year average annual nominal total returns for a conventional passive investment mix invested 60% in the S&P 500, 30% in Treasury bonds, and 10% in Treasury bills. This estimate is singularly the worst investment outlook in U.S. history. It will change as valuations do. Short term prospects will change as psychology does (our measures of market internals deteriorated last month). It will not be a surprise that nearly everything I have is in value conscious, historically-informed, full-cycle investment disciplines.
Could the Fed sustain this bubble forever? I don’t believe that for a minute, but given our late-2017 adaptation to our investment discipline, I expect we would tolerate that unlikely outcome just fine. Our discipline is flexible enough to shift as investor psychology does. We also know that when valuations are extreme, even very small changes in expected returns imply rather large price fluctuations. So even in the unlikely event of a “permanently high plateau,” I expect we’ll see enough volatility to navigate a broad range of opportunities.
The thing that makes the current situation distressing is that I expect that passive investors in stocks will be hurt. There’s no point yelling “sell,” because once a share of stock is issued, somebody has to hold it, at every moment in time, until that share of stock is retired. It would be best for stocks to be held by those with very high tolerance for losses, very little need for long-term investment returns, and very long horizons, because holding stocks at current valuations is likely to involve all of the above.
There’s no way to sustain a bubble without making its consequences worse. The appropriate policy response is to focus on the continued flow of payments through the economy and not the value of paper assets. Much of what investors presently count as “paper wealth” is likely to simply evaporate. Nobody will “get” it in a collapse. It just vanishes.
Meanwhile, aside from a few billion dollars of corporate debt that the Fed purchased using CARES funds specifically allocated by Congress for that purpose, the Fed does not have the legal authority to buy corporate securities without taking collateral “sufficient to protect taxpayers from losses.” Congress is likely to keep it that way. If the Fed was able to buy corporate assets just because they were losing value, it would simply be a bailout of private speculators with public money, and would place the losses on the public books. Again, the stock market would presently have to lose over two-thirds of its value simply to reach historically run-of-the-mill valuation norms.
If you’re relying on the Fed to keep stocks at a “permanently high plateau,” you’re relying on the purely psychological discomfort of holding zero-interest cash to prop up valuations that imply negative returns. Given the choice between zero returns and the prospect of full-cycle losses on the order of 65-70%, you might want to think again. I certainly believe that value-conscious, historically-informed, full-cycle investment disciplines can broaden the set of choices beyond cash, but that’s another conversation.
The trap door is open
Imbalances aren’t resolved sooner just because the imbalances are larger. Instead, crises emerge seemingly out of nowhere, when a vulnerable window or a trap door swings open. That makes it essential to monitor those hinges. In the financial markets, the trap doors typically present themselves in the form of weak or divergent market internals.
– John P. Hussman, Ph.D.
I’ve often observed that while valuations often have little effect on market direction over limited segments of the market cycle, they have a profound impact on long-term returns, and on the likely extent of market losses over the completion of any market cycle. Over shorter segments of the market cycle, market direction typically depends more on investor psychology; specifically, whether investors are inclined toward speculation or risk aversion. Since speculation tends to be indiscriminate, while risk-aversion features deterioration and divergence, we find that the best way to distinguish the two is to gauge market action across thousands of individual stocks, sectors, industries, and security types (including debt securities of varying creditworthiness). Since 1988, I’ve typically described this behavior using the words “uniformity” or “market internals.”
In prior market cycles across history, there was generally a “limit” to speculation. Once sufficiently extreme “overvalued, overbought, overbullish” conditions emerged, one could adopt a bearish outlook even if market internals were still favorable. The only thing truly “different” about the recent market cycle was that the Federal Reserve actively encouraged yield-seeking speculation long after speculative extremes had emerged, by replacing interest bearing Treasury debt with a mountain of zero-interest base money that someone has to hold at every moment in time until it is retired. In response, investors have bid up the prices of other assets to the point where they too are likely to produce zero returns for a very long period of time – even if those zero returns are delivered in an “interesting” way, through a series of collapses and recoveries.
Recall that despite two intervening bubbles, the total return of the S&P 500 lagged Treasury bills for the full period from May 1995 to March 2009. The same thing occurred from August 1929 to August 1945. Ditto for the full period from August 1959 to August 1982. That’s a total of 53 years within an 80-year period. As I observed in Going Nowhere in an Interesting Way – Hussman Funds, the common denominator is that these periods either started at extreme valuations, ended at depressed valuations, or some combination of both. The most predictable of these long trips to nowhere are the ones that start from extreme valuations. Indeed, parsing starting and ending dates a bit differently, investors can remind themselves that the total return of the S&P 500 lagged Treasury bills for the 13-year period from March 2000 to April 2013.
The chart below is a reminder of the difference between durable returns and transient returns. The red line shows levels of the S&P 500 that were never breached by later market declines. Notice that advances in the S&P 500 (blue line) up and toward historical valuation norms (green line) tend to be durable. In contrast, market advances well beyond historical valuation norms (blue line well above green line) tend to be transient, and are often wiped out over the completion of the market cycle, or even in later cycles. We don’t actually know what the current “durable” level is, but history suggests that it’s not likely to be materially above reliable historical valuation norms. That’s about 70% below current levels.
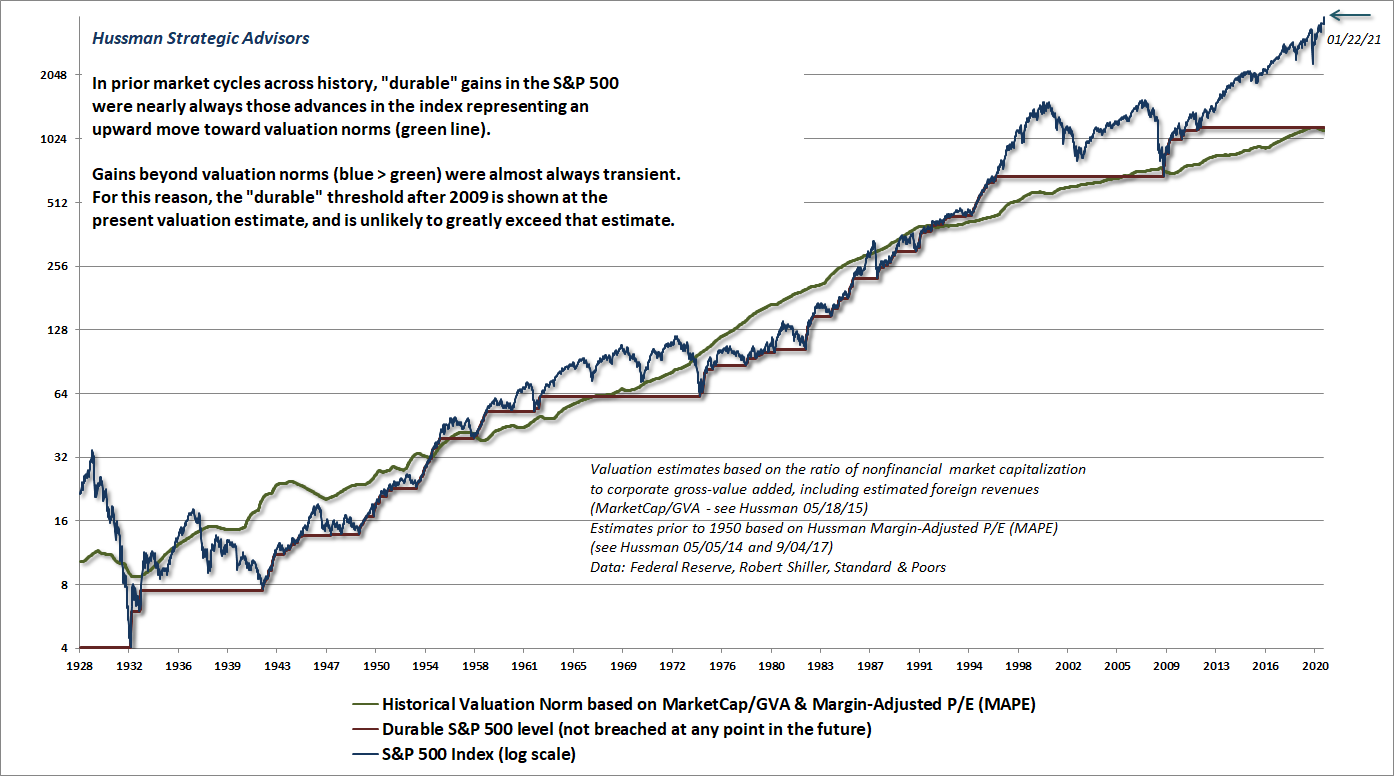
Understand how extreme current valuations have become. In order to simply touch run-of-the-mill historical valuation norms, the S&P 500 would have to lose somewhere in the range of 65-70% over the completion of this cycle. In that context, it’s worth nothing that a 62% loss would wipe out the entire total return of the S&P 500 over-and-above Treasury bills since the March 2000 peak. Put simply, I would not be terribly surprised if the completion of this cycle shreds away every bit of total return that the S&P 500 has achieved in excess of T-bills since 2000.
In response to the Fed’s insistence on promoting yield-seeking speculation, we had to adapt our investment discipline in late-2017 to abandon our pre-emptive bearish response to speculative “limits” and to instead restrict our bearish stances to periods when market internals have become unfavorable.
Notably, when investors are inclined toward risk-aversion, low interest liquidity becomes a desirable asset rather than an “inferior” one, so creating more of the stuff does nothing to support the market. Investors should remember this from the 2000-2002 and 2007-2009 collapses, during which the Fed was aggressively and persistently easing monetary policy to no avail. Even the steep market declines we’ve observed in recent years (early-2018, late-2018, early-2020) have occurred during periods when market internals have become unfavorable. As I noted in my mid-January comment, those measures deteriorated a few weeks ago. I view the current combination of hypervaluation, price overextension, lopsided bullishness, and unfavorable market internals as a “trap door” situation.
This is serious, and there’s no way to sustain it without making its consequences worse. The appropriate policy response to a financial collapse is to focus on the continued flow of payments through the economy and not on bailing out the value of paper assets. You support restructuring of economically important companies, but you don’t use public funds to bail out private investment losses. As the current speculative bubble unwinds, many paper assets are likely to evaporate, because they’re valued at unsustainable multiples of GDP and representative fundamentals. If policymakers like central banks were to buy the assets, the losses would simply be placed on the public books, and they would need to lose two-thirds of their value just to reach run-of-the-mill historical valuation norms.
The seeds of any bust are inherent in any boom that outstrips the pace of whatever solid factors gave it its impetus in the first place. There are no safeguards that can protect the emotional investor from himself. Having bid the market up irrationally, these emotional investors became terrified and unloaded their holdings just as irrationally.
– J. Paul Getty, The Wall Street Investor, 1962
An improvement in the uniformity of market internals would encourage a more neutral near-term outlook, but only a material retreat in valuations would improve the long-term and full-cycle outlook. We’ll respond to that evidence as it emerges.
Public health note
After a year that has played out like a predictable, slow-motion train wreck, the hopeful news is that U.S. 7-day fatalities peaked just over a week ago, consistent with the projections of the adapted SIR (susceptible, infected, recovered) model that I’ve used in exchanges with researchers and policymakers as part of the Hussman Foundation’s work.
Unfortunately, even without novel strains of the SARS-CoV-2 virus, the baseline trajectory relied on sustained containment behaviors and vaccination rates. Given estimates that the new strains are characterized by about 50% greater infectivity (because of mutations in the part of the spike that binds more tightly to ACE2 on our own cells), the situation has become more urgent. Please take the next comment seriously:
We need to tighten containment behaviors, immediately. That doesn’t need to mean “lockdown,” but it absolutely does mean amplifying every reasonable behavior to slow the spread of more infective strains of SARS-CoV-2.
Probably the simplest and most effective thing you can do is to limit your exposure to indoor public airspace, and to add a paper surgical mask underneath your cloth mask when you’re in contact with people outside of your own “pod.” If you can significantly reduce your public interactions, even for just 10 weeks or so, it will make a far larger difference than you might imagine. If you do go in public, please increase interpersonal distance, especially in the presence of forced exhalation (conversation with strangers).
Having modeled this trajectory in real-time since early-February of last year, one of the most striking aspects has been the brutal arithmetic linking small shifts in containment behavior (or infectivity) to increased fatalities. The simplest way to think about this is that if infectivity increases by a factor X (say 1.2), subsequent fatalities increase by factors like X8 because the impact is amplified with each successive generation of infected individuals.
There are two main risks to the pandemic trajectory here:
1) New strains with mutations that increase the infectivity of the virus by enabling it to more tightly to our cells, or to replicate more easily;
2) The excruciating behavioral tendency for the U.S. to relax containment practices as new case and fatality numbers decline, repeatedly offsetting what would otherwise be a sustained decline in the pandemic trajectory.
My impression is that it is important for messaging to better explain why strong containment practices should be sustained, even in the face of declining numbers, until at least 25-30% of the population is vaccinated. That’s nowhere near the “herd” threshold, but assuming prioritization by age and chronic disease, even that level may be enough to substantially reduce the residual fatality risk.
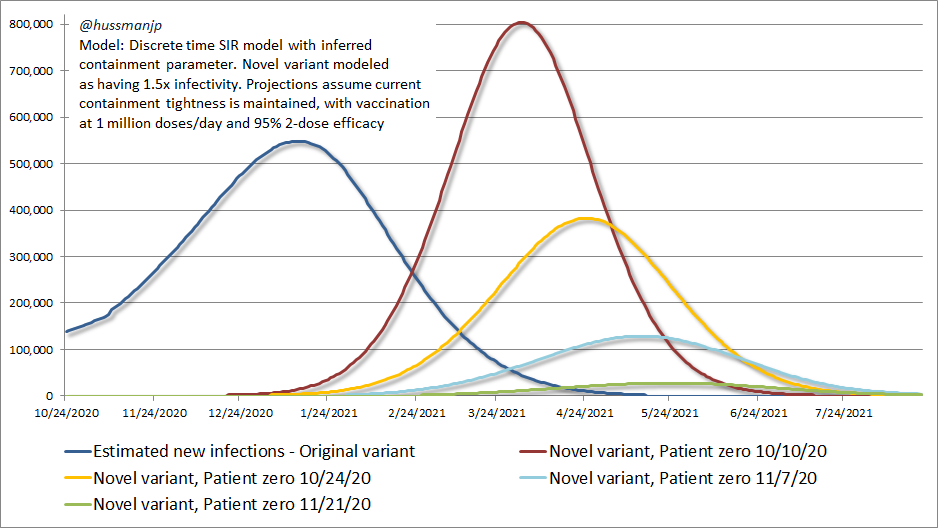
The chart below offers a simple way to think about the impact of these variants, and how sensitive the projected outcomes are to small differences in exactly when they actually emerged in the United States. The blue line shows the estimated pandemic trajectory for the dominant variant of SARS-CoV-2 that is currently circulating. By my estimates, new infections attributable to that variant peaked in mid-January, and are now in a clearly declining trajectory.
The additional lines show the trajectory of infections that we can expect from a novel SARS-CoV-2 variant, B.1.1.7, that is estimated (conservatively) to have 50% greater infectivity. The lines differ only by the date at which we assume the emergence of the first case of the new variant. When you hear epidemiologists say that “the new variant is likely to become dominant in March,” this is what they mean. Moreover, these projections embed the assumption that the U.S. will maintain current containment practices, and will deliver one million vaccine doses daily, with 95% vaccine efficacy for a two-dose regimen.
One of the critical things to observe is that in all of these scenarios, the effect of the new variant is almost indistinguishable at present. Unfortunately, if we don’t immediately tighten our containment behaviors, the dominance of the new variant could explode, apparently out of nowhere, in mid-March.
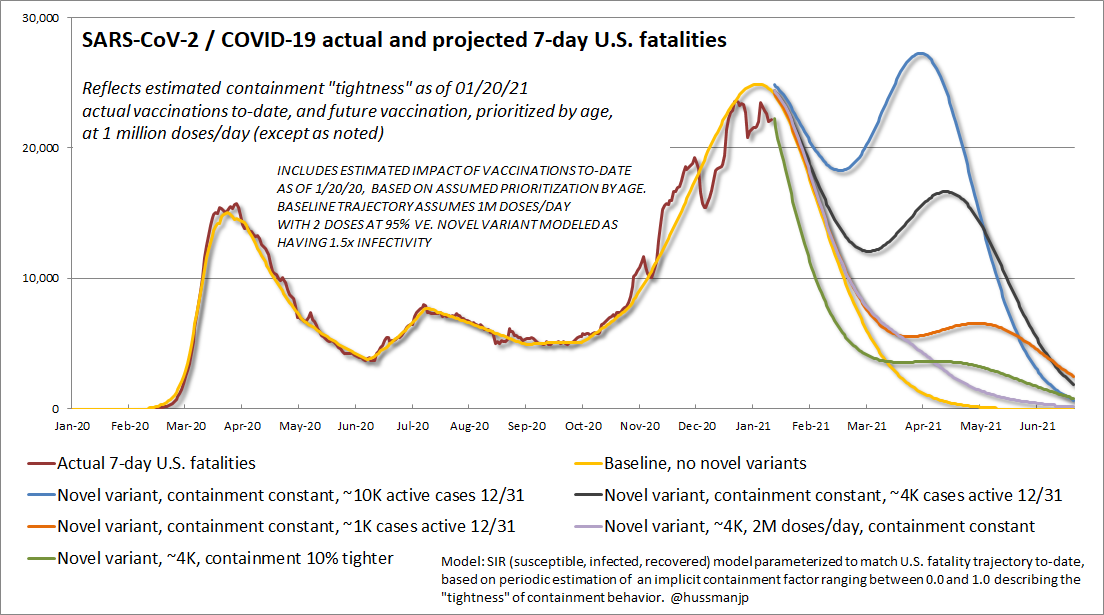
The next chart shows the potential impact of the new variant on the trajectory of U.S. fatalities, based on various assumptions about the number of active B.1.1.7 cases in the U.S. as of December 31, 2020. The highest line assumes 10,000 active U.S. cases of the B.1.1.7 variant on that date, which works out to just 0.25% of all estimated COVID-19 cases as we entered 2021. More dire possibilities are not shown. One of the critical things to notice is that the trajectory of fatalities is likely to decline during February. My concern is that this is likely to give people a false sense of security. If they relax containment behaviors as a result, the U.S. will suffer an amplified number of fatalities.
Here’s the hopeful part. The scenarios in this chart reflect different assumptions about the number of cases of the novel variant circulating in the U.S. (observed or unobserved) as of December 31, 2020. Notice that even a 10% tightening in U.S. containment behaviors would result in a dramatic reduction in fatality risk. Stronger containment behaviors are the most effective actions we can take immediately in the event the new variant is more prevalent than these scenarios assume.
Why would an immediate tightening of containment behaviors, by even 10%, have such a profound effect? The answer is this: simple arithmetic.
For a given variant of the virus, the “base reproductive rate” R0 is the average number of new infections that will result from one new case, on the assumption that everyone is initially susceptible. But that number changes over time. Once 20% of the population has been infected or effectively vaccinated, (which is roughly what my own model currently infers) only 80% of the population remains susceptible, so each new infection can be expected to result in Rt = R0*0.8 new infections. Containment behaviors also help. If people reduce the probability of infection by half as the result of using masks, increasing distance, and limiting interactions then Rt = R0*0.8*0.5.
In general, Rt = R0*s*c, where s is the percentage of the population that’s susceptible, and c is the “tightness” of containment behaviors (which my U.S. model infers at about 0.50 since November, where 1.0 is normal interaction and 0.0 is complete isolation).
Take a strain with an R0 of 2.4, expose it to a population that’s 80% susceptible, with containment behaviors reducing infectivity to 0.5 times that of uncontained behavior, and you get Rt = 2.4*0.8*0.5 = 0.96. That figure, just under 1.0, is essentially a temporary form of “herd immunity.” There are still infections going on, but each new case results in less than one additional case, so the curve drops toward zero over time – provided that containment measures are sustained until a significant proportion of the population is vaccinated. That’s basically where we are with the strain of SARS-CoV-2 that’s currently dominant in the United States.
Clearly, we would do better if containment tightness was stronger, but that alone would put us past the peak in daily new cases and fatalities.
Now introduce a new variant with an R0 that’s 50% higher. Now Rt = 1.5*2.4*0.8*0.5 = 1.44 and you’ve got a pandemic on your hands again. That’s what we’re facing, with renewed force, by mid-April.
Here’s how to stop it.
First, maintain or accelerate the pace of vaccinations. 10 weeks of vaccinations at a pace of 1 million a day, and 2 doses at 95% efficacy would reduce the susceptible population to about 70%.
Second, tighten containment practices by even just 10%, from 0.50 to 0.45.
Now you’ve got Rt = 1.5*2.4*0.7*.45 = 1.13. It’s still not great, and you’ll still get a bump in cases and fatalities in April and May, as you can see in the green line in the chart above, but an enormous number of American lives could be saved even by that relatively modest tightening in containment practices.
With 100,000 U.S. fatalities likely in the coming weeks even in the best case, there still seems to be useful scope for repurposed therapeutic candidates. I’ve embedded a link to a recent paper from Baylor University Medical Center: Clinical outcomes after early multi-drug therapy for high-risk COVID-19 infection. In the event you acquire COVID-19, I’ve also linked a one-page PDF of research references to well-tolerated therapeutic candidates with reported benefit, which is shared on the Hussman Foundation website. None of it is medical advice (I’m not a clinician), but the references may be helpful to discuss with your physician. Most of these are discussed in the pathway paper I published last year. You can find some of my other scientific work here.
I’ll end this very long monthly comment with a plea – don’t take false hope, or draw a false sense of security, from the decline in cases that we’re likely to observe during February. The novel variant of SARS-CoV-2 is multiplying in a way that will result in tragic and needless U.S. fatalities if we don’t treat its quiet emergence as an immediate threat, and take reasonable actions to reduce the spread, at least until a significant fraction of the population is vaccinated. That doesn’t need to mean “lockdown,” but it does mean being substantially more careful in the weeks ahead, not less.
That is exactly how this little coronavirus with twice the R0 of the seasonal flu, and a mortality rate that is evidently an order of magnitude higher, will produce utter chaos if containment efforts are not taken seriously.
– John P. Hussman, Ph.D., March 1, 2020
Keep Me Informed
Please enter your email address to be notified of new content, including market commentary and special updates.
Thank you for your interest in the Hussman Funds.
100% Spam-free. No list sharing. No solicitations. Opt-out anytime with one click.
By submitting this form, you consent to receive news and commentary, at no cost, from Hussman Strategic Advisors, News & Commentary, Cincinnati OH, 45246. https://www.hussmanfunds.com. You can revoke your consent to receive emails at any time by clicking the unsubscribe link at the bottom of every email. Emails are serviced by Constant Contact.
The foregoing comments represent the general investment analysis and economic views of the Advisor, and are provided solely for the purpose of information, instruction and discourse.
Prospectuses for the Hussman Strategic Growth Fund, the Hussman Strategic Total Return Fund, the Hussman Strategic International Fund, and the Hussman Strategic Allocation Fund, as well as Fund reports and other information, are available by clicking “The Funds” menu button from any page of this website.
Estimates of prospective return and risk for equities, bonds, and other financial markets are forward-looking statements based the analysis and reasonable beliefs of Hussman Strategic Advisors. They are not a guarantee of future performance, and are not indicative of the prospective returns of any of the Hussman Funds. Actual returns may differ substantially from the estimates provided. Estimates of prospective long-term returns for the S&P 500 reflect our standard valuation methodology, focusing on the relationship between current market prices and earnings, dividends and other fundamentals, adjusted for variability over the economic cycle.