

The Folly of Ruling Out a Collapse


John P. Hussman, Ph.D.
President, Hussman Investment Trust
August 2021
Investors accept in theory the premise that the stock market may have its recessions in the future. But these drops are envisaged in terms of the experience of the past ten years when the maximum decline was only 19 percent. The public is confident that such setbacks will be made up speedily, and hence that a small amount of patience and courage will bring great rewards in the form of a much higher price level soon thereafter.
Investors may think they are basing this view of the future on past experience, but in this they are surely mistaken. The experience of the 1949-1959 market – or of all bull markets put together – reflects only the sunny side of the investment. It is one thing to say airily that the market has always come back after declines and made new heights; it is another to reflect on the fact that it took 25 years for the market to reach again the high level of 1929, or that the Dow Jones Average sold at the same high point in 1919 as it did in 1942 – 23 years later.
– Benjamin Graham, Excerpted remarks, December 17, 1959
A remarkable feature of extended bull markets is that investors come to believe – even in the face of extreme valuations – that the world has changed in ways that make steep market losses and extended periods of poor returns impossible. Among all the bubbles in history, including the 1929 bubble, the late-1960’s Go-Go bubble, the early 1970’s Nifty-Fifty mania, the late-1990’s tech bubble, and the 2007 mortgage bubble that preceded the global financial crisis, none has so thoroughly nurtured the illusion that extended losses are impossible than the bubble we find ourselves in today.
Benjamin Graham understood that even when extreme valuations are not immediately corrected by market losses in the shorter-run, they are typically followed by disappointing investment returns and very long, interesting trips to nowhere. The fact is that most of the fluctuation in 10-12 year S&P 500 returns is driven not by changes in fundamental growth, but by changes in valuation multiples. When valuations are depressed, investors not only purchase expected future cash flows at an attractive price; they also avail themselves of the potential for valuations to increase in the future. At extreme valuations, investors not only purchase expected future cash flows at an elevated price; they also expose themselves to the potential for valuations to retreat in the future.
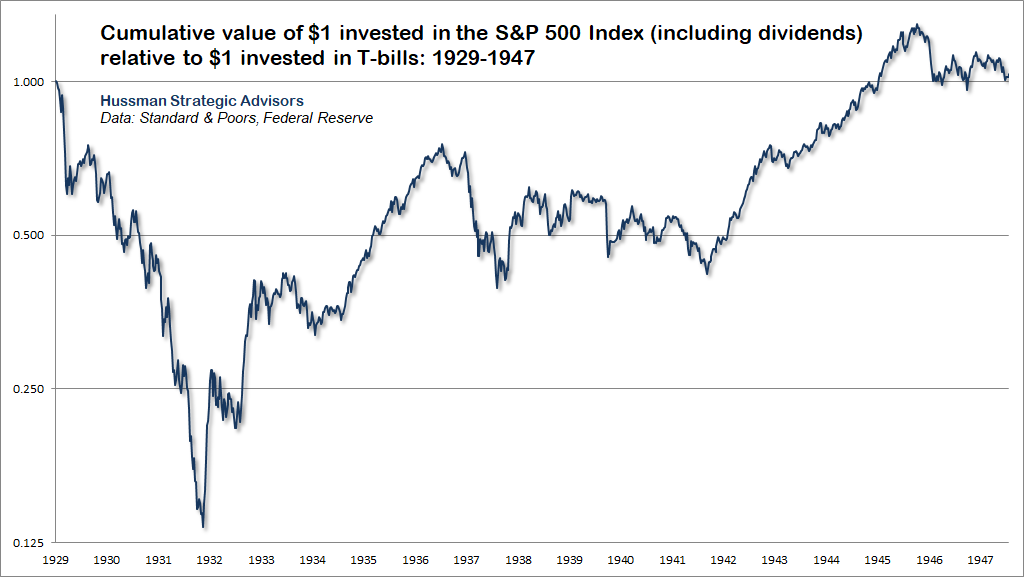
Though market valuations in 1959 were nowhere close to current extremes, it’s notable that measured from the date of Graham’s remarks, periodic bear markets repeatedly brought the cumulative total return of the S&P 500 back to or below the cumulative return of risk-free Treasury bills, all the way out to August 1982, nearly 25 years later, despite decades of inflation and strong nominal earnings growth. The Dow Industrials lagged T-bill returns for an even longer period. The worst outcome was for long-term bonds, as inflation left investors locked into the low returns that they had bargained for at the outset.
The reason for that particular trip to nowhere wasn’t that starting valuations were obscene, but that the 1982 low was one of the cheapest valuation troughs in history. Similarly, although the March 2009 market low was only moderately below historical valuation norms, it was still sufficient to wipe out the entire total return of the S&P 500 in excess of Treasury bills all the way back to May 1995. Over the 14 years from May 1995 to March 2009, passive investors enjoyed two separate bubbles, suffered two separate crashes, and ended up nothing to show for it beyond the returns of risk-free T-bills.
We certainly don’t rule out a move to below-average valuations in the future, but I don’t think it’s terribly useful to base investment decisions on expectation of depressed future valuations, much less to rely on them. In contrast, the prospect of a long, interesting trip to nowhere is more reliable once prevailing, observable valuations are already extreme. In these cases, little is required of the future other than a bit less insanity.
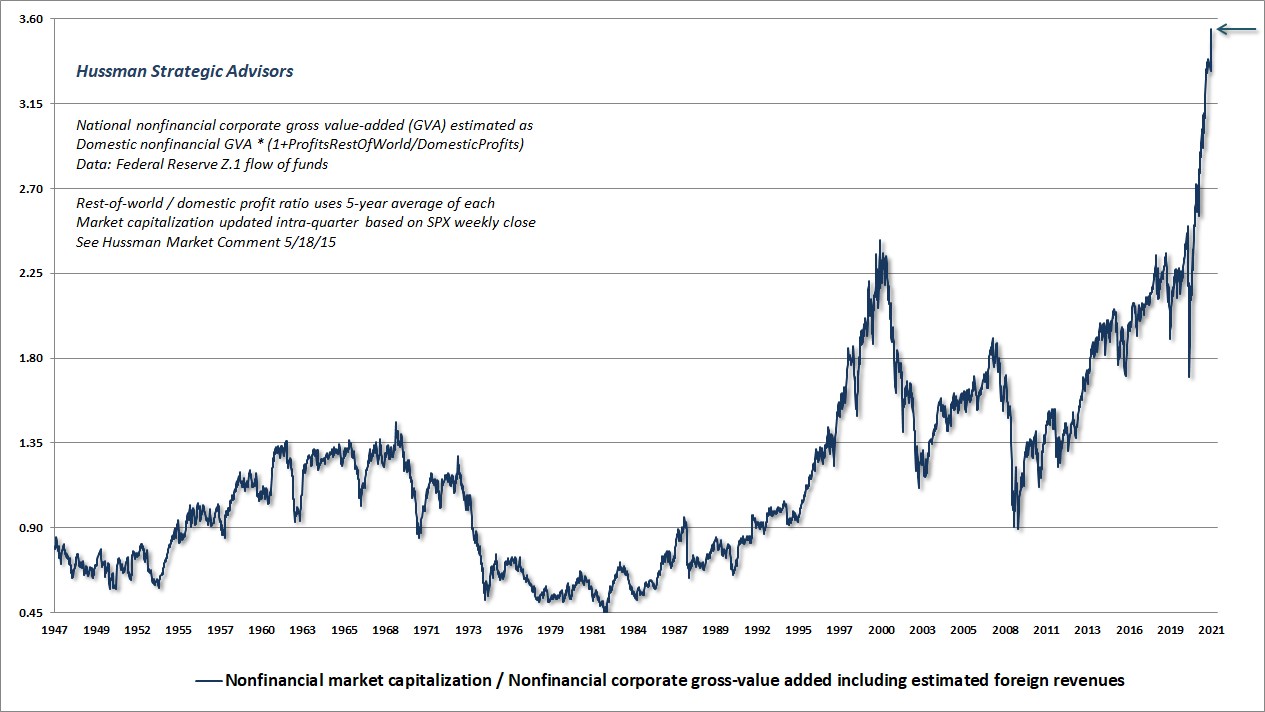
The chart below shows the ratio of nonfinancial market capitalization to corporate gross value-added (MarketCap/GVA), which is the single most reliable valuation measure we’ve introduced over time, based on its correlation with actual subsequent market returns across history. Notably, U.S. nonfinancial gross value-added is at a record high. The insanity you’re looking at is all numerator.
This is what a speculative bubble looks like. Jeremy Grantham is right – “Seriousness is flagged by the language that you use.” Valuations have reached record extremes while our measures of “uniformity” across market internals have shown increasing deterioration and dispersion, reflecting increasing selectivity and emerging risk-aversion. In recent weeks, this dispersion has widened further. This is serious. Among additional features of market action to monitor, keep an eye on credit spreads and low-grade bond yields, as well as any tendency for the number of individual stocks setting 52-week lows to expand – though I suspect those may coincide with stock market weakness rather than preceding it.
For investors hoping that perhaps inflation will bail the market out, it’s worth noting that valuations are typically the first casualty of sustained inflation. Indeed, the S&P 500 has historically underperformed Treasury bills even when inflation is above 2% and higher than its level 6-months earlier. It may also be useful to know that valuations have never been materially above their historical norms when the rate of CPI inflation has been above 6%. So the “benefit” of high inflation would likely be offset by plunging valuations. With MarketCap/GVA currently about 3.6 times its historical norm, it would take 22 years of 6% growth to offset that headwind. That said, for those who insist on invoking “Argentina” and “Weimar” in ordinary market discussions, yes – hyperinflation would probably begin to benefit nominal stock market returns if the consumer price index more than triples.
The scatter below shows MarketCap/GVA vs. subsequent S&P 500 returns in data since 1928. Be careful not to imagine that by chasing stocks at record valuations and negative prospective returns, you are somehow “putting your money to work.”
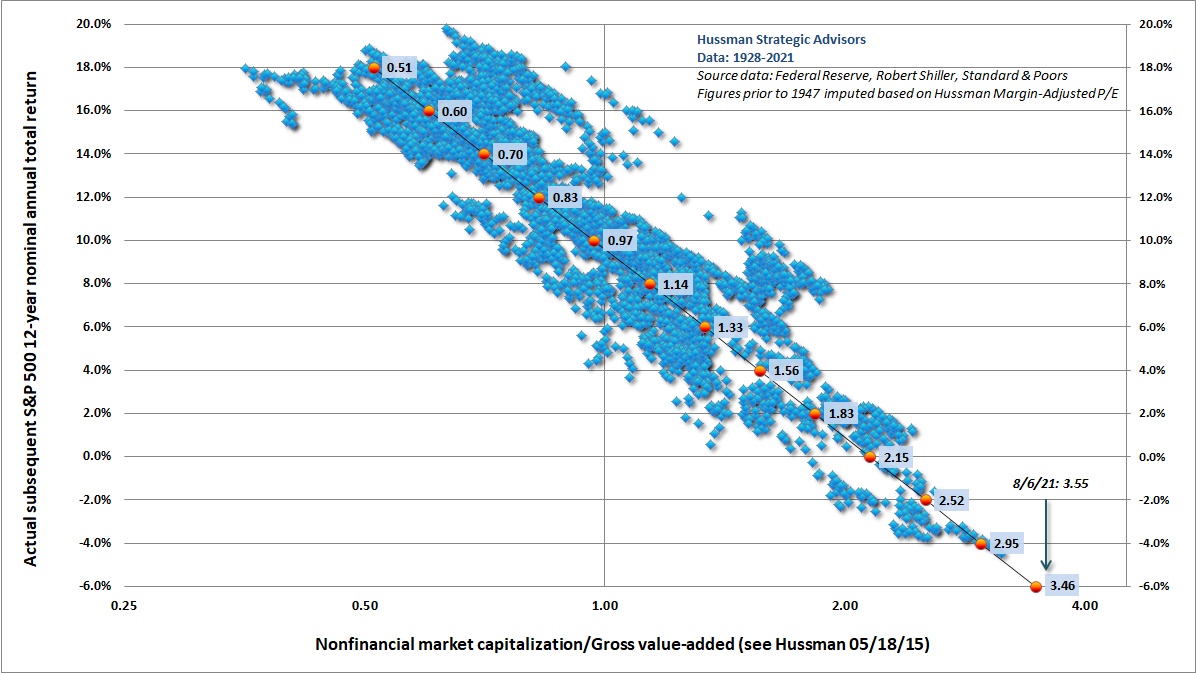
The problem with a speculative bubble is that you can’t make the short-term outcomes better without making the long-term outcomes worse, and you can’t make the long-term outcomes better without making the short-term outcomes worse. Now it’s just an unfortunate situation.
I was recently asked whether strong expectations for S&P 500 operating earnings, coupled with the current forward operating earnings P/E of 24, might be enough to avoid a severe correction. My immediate response was dismay at how investors have been led to believe that it’s ok to pay 24 times the highest forward operating earnings estimate in history, without also expecting more than a decade of negative total returns. The chart below is presented in 3D, to disabuse the notion that low interest rates mitigate the dismal prospects for expected market returns.
Keep in mind that the data in this scatter include points ranging from the secular low of 1982, the 2000 peak, the 2007 peak, and the 2009 market low. It should be a reminder that even the highest and lowest valuations in the past few decades have traced out a rather well-defined relationship with actual subsequent market returns.
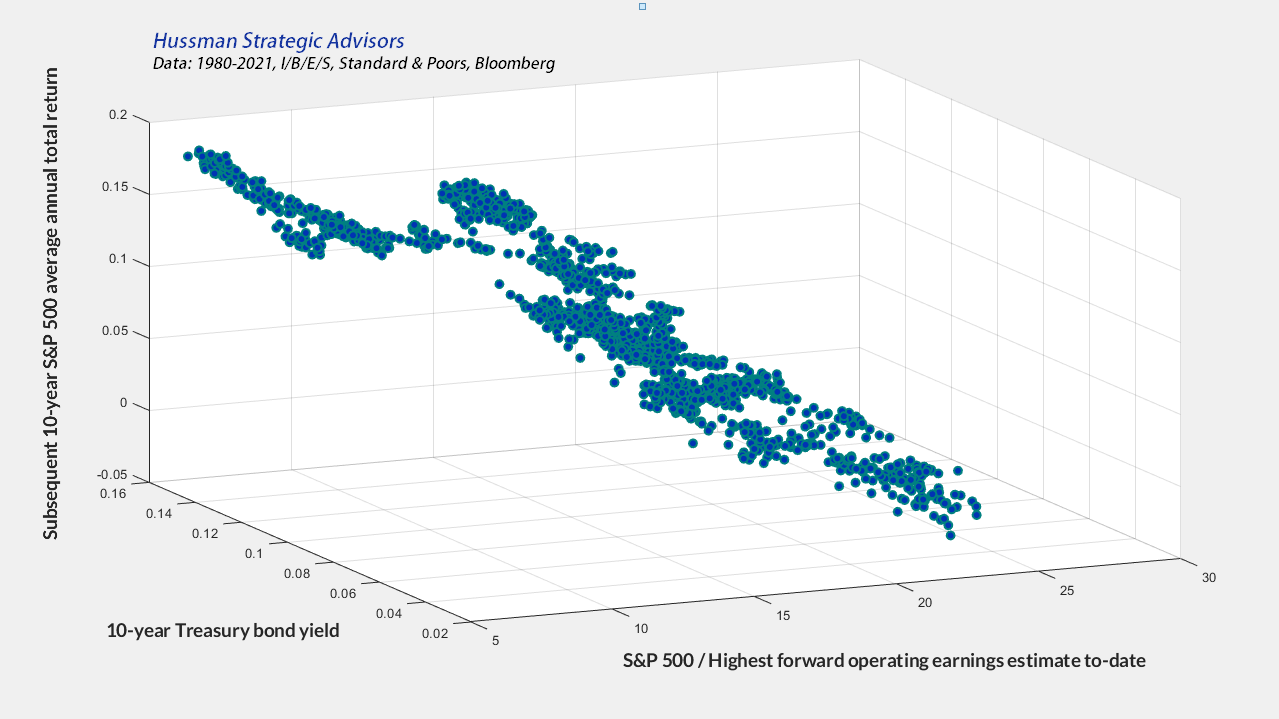
We won’t be able to plot the current point in the chart above until we know the actual S&P 500 total return for the coming decade, but the other coordinates suggest that this point will probably lie in the far lower right corner of the scatter. The chart is a testament to Ben Graham’s observation: “All my experience goes to show that most investment advisers take their opinions and measures of stock values from stock prices. In the stock market, value standards don’t determine prices; prices determine value standards.”
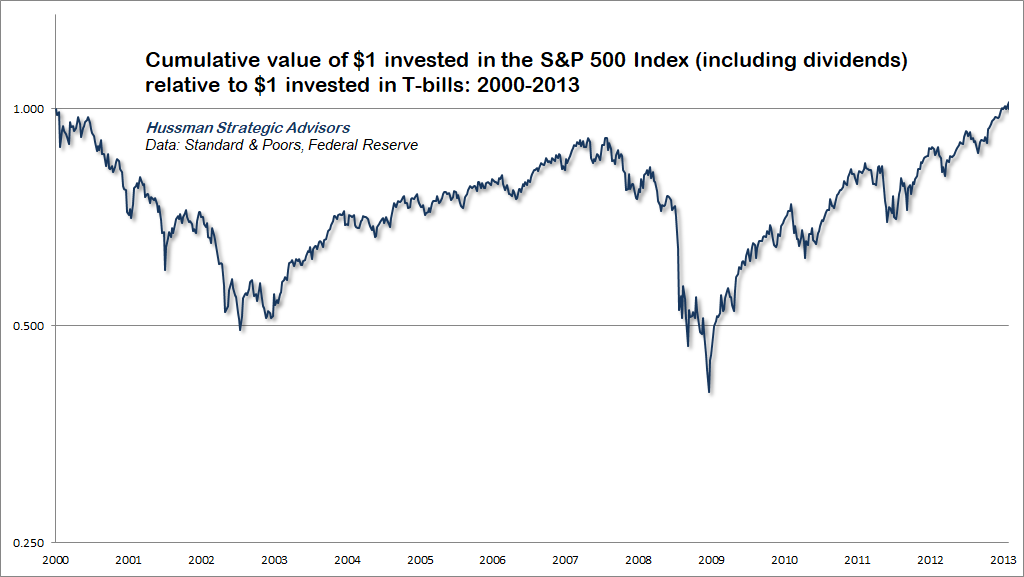
When extreme stock market valuations are the starting point, one often finds that bonds or even Treasury bills have outperformed stocks even a decade or two later. As I’ve often noted, the total return of the S&P 500 lagged even Treasury bills from 1929-1947, 1966-1985, and 2000-2013. That’s just what overvalued markets do.
The following charts present the cumulative total return of the S&P 500, in excess of Treasury bill returns, for each of those periods. Together, these episodes comprise about 60% of the 84-year period from 1929 to 2013.
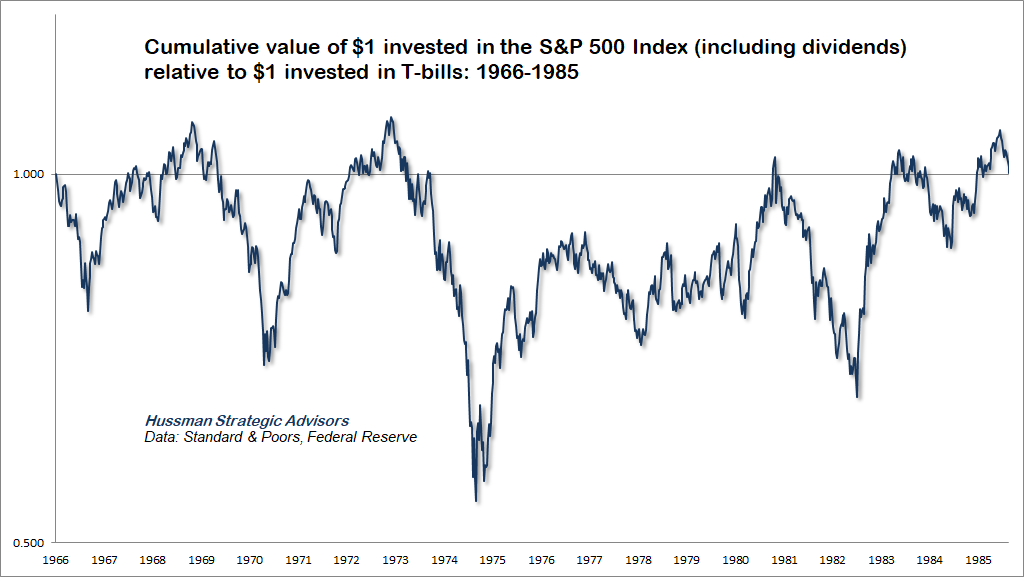
An important feature of going nowhere in an interesting way is the word “interesting” – even if the market goes nowhere on balance for quite a long time, good opportunities can regularly appear in the interim. As concerned as I’ve been about this bubble, even the peak-to-peak “mini-cycle” we’ve experienced since the February 19, 2020 pre-pandemic market high has been just fine for our flexible discipline.
“I’m just a cash flow, standing in front of a price, asking it to love me”
Speculators often prosper through ignorance; it is a cliché that in a roaring bull market, knowledge is superfluous and experience a handicap. But the typical experience of the speculator is one of temporary profit and ultimate loss. Optimism and confidence have always accompanied bull markets; they have grown as the bull market advanced, and they had to grow, otherwise the bull markets could not have continued to their dizzy levels – and they have been replaced by distrust and pessimism when the bull markets of the past have collapsed. All my experience goes to show that most investment advisers take their opinions and measures of stock values from stock prices. In the stock market, value standards don’t determine prices; prices determine value standards.
The more it changes, the more it’s the same thing. The economic world has changed radically and will change even more. Most people think now that the essential nature of the stock market has been undergoing a corresponding change. Would that fact assure the investor against a costly and discouraging bear market experience? It seems to me that this is most improbable. The central level of values will be raised, but the fluctuations around these levels may well be just as wide as in the past, in fact, one might expect even wider fluctuations – the stock market will continue to be a place where a big bull market is inevitably followed by a big bear market. In other words, a place where today’s free lunches are paid for doubly tomorrow.
– Benjamin Graham, Excerpted remarks, December 17, 1959
Every speculative bubble convinces investors that the world has changed in ways that make basic arithmetic irrelevant.
Imagine a world with no computers; no streaming video – certainly no color movies; no radios; no television; no internet; no semiconductors; no antibiotics – not even penicillin; no diagnostic blood tests; no air conditioning; no airplanes – certainly no commercial aviation; and no automobiles other than this classy little thing.

Countless innovations that we take for granted have emerged during the past century; the same century for which a very accessible record of stock market prices and cash flows is available. Value-conscious investors spend a lot of time staring at that sort of data, and it offers enormous insight into how investors and financial markets deal with disruptive innovation. Their most dangerous habit is to allow their imaginations to be so captured by novelty that they somehow forget basic arithmetic.
For example, despite breathless enthusiasm over glamour tech companies, disruptive innovation, network effects and the like, the growth of S&P 500 revenues – which captures all of it, including the impact of stock buybacks – has averaged just 3.2% annually over the past two decades. There’s no question that these innovations have altered the distribution of income across various companies (in some cases creating legitimate issues involving “natural” monopoly). It has also altered the distribution between profits and wages (though less than investors seem to imagine). But it’s not at all clear that one should place extreme valuations on the entire slow-growing pie just because a larger slice of it is apple.
Meanwhile, I cannot stress this often enough: for any given set of expected future cash flows, a higher valuation implies a lower long-term investment return. Period. Once you can actually observe the price that is being paid for the cash flows, changing the level of interest rates does not change the arithmetic that links valuations with expected returns.
For example, if I tell you that an IOU paying $100 a decade from today has a price of $82, you can directly calculate that the expected return is 2% annually. The prevailing level of interest rates is not required for that arithmetic. You can certainly compare the 2% expected return with interest rates, but low interest rates don’t somehow improve the expected return implied by valuations. If interest rates are low, all you’ve got now is poor expected returns all around.
Given some set of expected future cash flows, investors may very well respond to lower interest rates by raising valuation multiples. But those higher valuations are precisely the mechanism by which expected future market returns are driven lower, in order to align with the lower interest rates. Worse, if interest rates are low because growth rates are also low, no valuation premium is justified at all, because the lower growth rate has reduced expected returns already. In that situation, a valuation premium just adds insult to injury.
In short, once you know the estimated cash flows and the observable price, you can directly estimate the investment return that connects the two. Nothing else is required. There’s nobody else in the room. To paraphrase Julia Roberts in Notting Hill, “I’m just a cash flow, standing in front of a price, asking it to love me.”
The valuation gauge that we find best correlated with actual subsequent market returns across history, including recent decades, is the ratio of nonfinancial market capitalization to corporate gross value-added (including foreign revenues). Presently, MarketCap/GVA stands at 3.55, easily the highest level in history. This compares with a historical norm of 0.99 (a level that has historically been associated with subsequent 10-12 year S&P 500 total returns of about 10% annually), and a previous record of 2.43 at the 2000 bubble peak.
Assuming that U.S. nonfinancial gross value-added (including foreign revenues) grows at the same 3.7% annual rate as it has during the past 20 years, even a retreat to valuations no lower than the 2000 bubble peak would imply roughly zero change in the S&P 500 Index over the coming 10-year period.
The arithmetic here is: (1.037)*(2.43/3.55)^(1/10)-1 ~ zero.
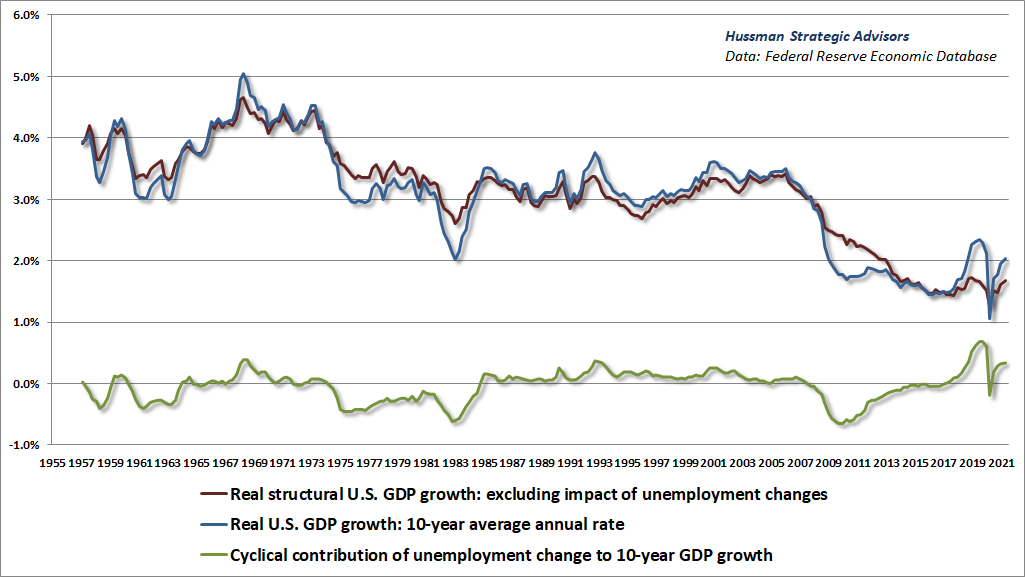
The chart below partitions real U.S. GDP growth into its structural component (reflecting by demographic labor force growth and trend productivity) and its cyclical contribution (reflecting fluctuations in the rate of unemployment). In recent decades, the structural growth rate of GDP has slowed considerably, to about 1.6% today – about 2% lower than the post-war average.
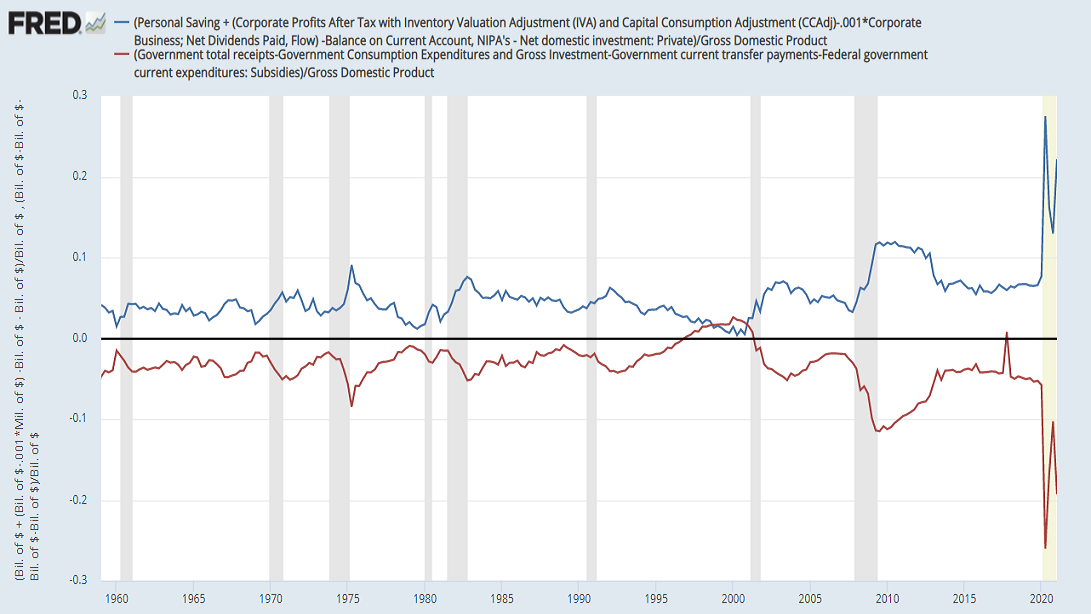
Amid the enthusiasm about record household savings and record corporate profits, seemingly “despite” record trade deficits, it’s clear that investors haven’t quite figured out how equilibrium works. If the government runs a record shortfall, the household, corporate, or foreign sectors must, in aggregate, run a record surplus (where the income of those sectors will exceed their consumption and net investment). That shortfall has been massive but temporary – representing trillions of dollars in pandemic relief in the form of transfer payments and corporate subsidies. If you think carefully about equilibrium, it will also become clear that those surpluses must, in aggregate, be invested in precisely the government liabilities that were issued to finance the shortfall. There’s your “cash on the sidelines,” and somebody’s got to keep holding it until it’s retired.
It may be the greatest collective error in the history of investing to pay extreme multiples for extreme earnings that reflect extreme profit margins and extreme government subsidies, while imagining that those multiples also deserve a “premium” for depressed interest rates that reflect depressed structural economic growth.
The chart below shows a 3D scatter of the raw forward operating P/E, the ratio of forward earnings to S&P 500 revenues, and the actual subsequent 10-year average annual nominal total return of the S&P 500. As a side note, while 2-dimensional scatterplots of P/E ratios against subsequent returns can look quite sloppy, they typically become rather beautiful when profit margins are included as a third dimension. That’s because the 3D chart visually reconstructs what investors should actually care about, which is the price/revenue ratio.
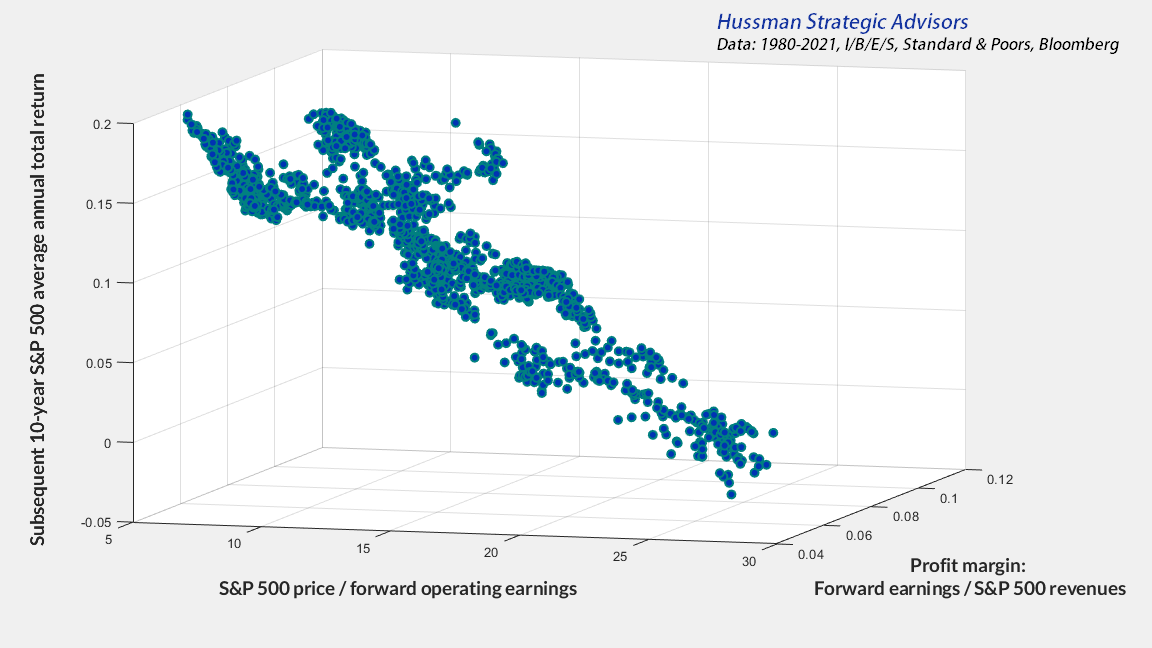
It may be the greatest collective error in the history of investing to pay extreme multiples for extreme earnings that reflect extreme profit margins and extreme government subsidies, while imagining that those multiples also deserve a ‘premium’ for depressed interest rates that reflect depressed structural economic growth.
Higher valuations imply higher volatility
Graham makes another observation that shouldn’t be missed. Even if one embraces the idea of a new economic era, “The central level of values will be raised, but the fluctuations around these levels may well be just as wide as in the past, in fact, one might expect even wider fluctuations.”
See, a high level of valuations means that investors have placed a greater price on a given set of expected future cash flows. But that also makes the price far more sensitive to small disappointments in expected cash flows, and to small changes in the expected returns required of investors.
For example, suppose that investors price the S&P 500 at 27 times dividends, reflecting the historical norm of a 3.7% dividend yield. How do you get 0.1% in additional long-term returns? You’ve got to drive the yield to 3.8%, which implies a price decline of (.037/.038-1=) -2.6%.
If instead investors price the S&P 500 at 74 times dividends, reflecting today’s dividend yield of 1.35%, how do you get 0.1% in additional long-term returns? You’ve got to drive the yield to 1.45%, which implies a price decline of -6.9%.
With the S&P 500 dividend yield at just 1.35%, even an increase to the very low 2% median since 2000 would imply a price decline of nearly one-third.
As I’ve noted before, the “duration” of the S&P 500 is approximately its price/dividend ratio. Just like a bond duration, it essentially tells you the weighted-average number of years it takes for your investment to be repaid by cash flows, and it also gauges the sensitivity of prices to small changes in the expected returns demanded by investors. Record valuations imply record durations and record price sensitivity. That’s exactly why the subsequent long trips to nowhere tend to be “interesting.”
Market internals have deteriorated
The 1929 boom was, in fact, quite a narrow and selective one. It was a boom of the handful of stocks that figured in the daily calculation of the Dow Jones and New York Times indices, and that was why those well-publicized indexes were at record highs. It was also a boom of the most actively traded stocks bearing the names of the most celebrated companies, the stocks mentioned daily by the newspapers and millions of times by the board room habitués – and that was why it was constantly talked about. But it was emphatically not a boom of secondary stocks in which perhaps as many investors were interested.
– John Brooks, Once in Golconda, 1969
When investors are inclined to speculate, they tend to be indiscriminate about it. For that reason, we find that the best gauge of investor psychology toward speculation or risk-aversion is the uniformity or divergence of market internals across thousands of individual stocks, industries, sectors, and security-types, including debt securities of varying creditworthiness. Our primary gauge of market internals has been unfavorable in recent months, but I’ve refrained from adopting a hard-negative outlook until recently, as divergences have become more obvious in the equity components. Now it’s serious.
During the mortgage bubble, I shared a quote by T.S. Eliot. “Only those who risk going too far can possibly find out how far one can go.”
Unfortunately, sometimes you learn the answer from broken bones.
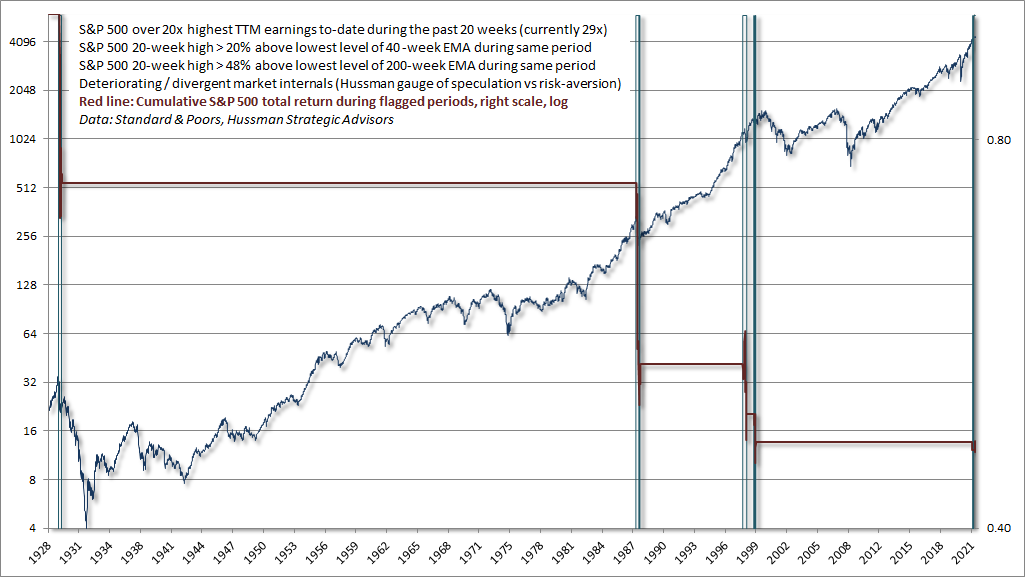
Presently, we are at the most optimistic point of the most overvalued market bubble in the history of the nation. The S&P 500 is at a rare point of overextension relative to its 40-week and 200-week averages, in the context of deterioration and divergence in our key gauge of internals, indicating that the market is dangerously narrowing, in a way that reflects emerging risk-aversion.
This bubble has been built on near-universal confidence that serious market losses can be ruled out, and that in Ben Graham’s words “any setbacks will be made up speedily.” Couple lopsided bullish sentiment with record margin debt relative to GDP, and you now have an “all-in” market. Unfortunately, that’s also a market where the first question speculators will hear as they enter their sell orders will be – “To whom?”
Speculation versus investment
Don’t kid yourself. If you’re fully invested in stocks here, you’re a speculator. If your exposure to stocks doesn’t meaningfully take account of valuations here, you’re a speculator. Now, there can be intelligent speculation, but there can also be reckless speculation. If your speculation is based primarily on the fact that prices have gone up in the past, it’s very likely that you’re speculating recklessly.
As Graham & Dodd observed in 1934, investment means buying a security at a valuation that is associated with a reasonable expectation of acceptable long-term returns, based on a careful analysis of the relationship between the current price and expected future cash flows. Speculation means buying a security in the expectation that its price will advance. In my view, intelligent investment requires careful consideration of the arithmetic that links current prices with future cash flows; and the historical evidence that relates reliable valuation measures to subsequent returns. Intelligent speculation requires careful consideration of the condition of investor psychology (which we gauge using market internals) as well as the extent, if any, that prices are compressed in a way that provides them substantial room to run.
The best possible situation is, of course, when market conditions provide both investment merit and speculative merit – a combination of undervaluation, price compression, and early improvement in market internals. I expect that even the coming quarters will provide good opportunities for rational speculation (mostly likely with a safety-net) well before we see this full combination, and that’s fine.
In any event, the worst possible situation is when market conditions provide neither investment merit nor speculative merit – a combination of hypervaluation, price overextension, and early deterioration in market internals. In my view, investors presently face the worst possible situation.
No forecasts are required
My impression is that the first leg down from recent market highs may be nearly vertical. Given that current extremes eclipse the dizziest heights of both 1929 and 2000, I suspect that a 30% down-leg in the S&P 500 from current extremes wouldn’t even break a sweat. The real question is how many further 20-30% losses may occur after consolidations and rallies. On that, I have no particular expectation. We could see a 1987 or 1998 type of “panic” decline, where the market experiences a vertical loss and speculators take the bit in their teeth again, or a decline could evolve into something more extended. The extended ones typically become intertwined with economic and credit disruptions, in which case the typical outcome is a whole series of steep losses punctuated by extended recoveries and then fresh declines. We’ll take the evidence as it comes.
Put simply, I believe that current risks are unusually pointed, and warrant a rare degree of seriousness. Yet it’s also critical to emphasize that no forecasts are required, and nothing in our current investment stance requires a market collapse. Our discipline is to align our investment outlook with the prevailing, observable condition of valuations, market internals, measures of price extension, and other measurable factors that help to define the expected market return/risk profile at each point in time. It isn’t necessary to make forecasts or construct scenarios. Our outlook will change as market conditions do.
Market valuations provide an enormous amount of observable information about likely long-term investment returns. Yet over shorter segments of the market cycle, investment returns are far more dependent on whether valuations are being pressed higher or lower. Indeed, these two factors – the level of valuations and the pressure on valuations – are closely tied to the very definition of total return: income plus price change. Our investment discipline is intended to capture these central elements of total return by focusing primarily on two objects:
- Prevailing market valuations, which are correlated with both dividend yields and long-term returns, and also provide a sense of how much distance there is between current valuations and their historical norms, and;
- The uniformity or divergence of market internals, which helps to gauge the extent to which speculative investor psychology is pressing valuations higher, or risk-averse psychology is pressing valuations lower.
Aside from our stock selection discipline, the strongest driver of our investment success in previous complete market cycles was the ability to navigate those two elements, balancing careful attention to both valuations and market internals.
Historically, there was also a third very useful consideration. In prior market cycles, there was typically a “limit” to speculation, which one could identify based on a combination of “overvalued, overbought, overbullish” conditions. Once those features of market action emerged, a panic, air-pocket or crash would typically follow in short order. These outcomes suggested that one should respond pre-emptively, without waiting for deterioration in market internals.
In the 1950’s, psychologist Paul Meehl – an advocate of well-validated models in decision making – called this sort of consideration a “broken leg case”:
If a sociologist were predicting whether Professor X would go to the movies on a certain night, he might have an equation involving age, academic specialty, and introversion score. The equation might yield a probability of .90 that Professor X will go to the movies tonight. But if the family doctor announced that Professor X had just broken his leg, no sensible sociologist would stick with the equation.
– Paul Meehl, 1957, When Shall We Use our Heads Instead of the Formula?
Following the global financial crisis (which we correctly anticipated), my insistence on stress-testing our methods against Depression-era data strengthened our attention to “overvalued, overbought, overbullish” features of market action, because of their historical reliability. The Federal Reserve’s deranged experiment with zero interest rates unfortunately created a perfect storm – it was like handing Professor X a handful of narcotics to kill the pain, to the point he would repeatedly hobble to the movies despite having a broken leg worse than Joe Theismann.
Our late-2017 adaptation did not require the introduction of clever or complex new elements. Instead, it required us to “unlearn” the warning signs that historically placed “limits” on speculation, and to instead prioritize valuations and market internals. We had to refrain from adopting a bearish market outlook in response to “overvalued, overbought, overbullish” broken leg conditions, until our measures of market internals also became unfavorable (as they are at present).
In short, we became content to gauge valuations, and the presence or absence of speculative or risk-averse investor psychology, without assuming that there is any well-defined “limit” to either. I certainly expect that we will periodically adopt a hard-negative outlook in hypervalued, overextended market conditions with deteriorating and divergent internals (as is presently the case). But faced with what we view as reckless monetary policies, we have learned to refrain from “fighting” even severely overextended speculation when the uniformity of internals suggests that investors still have the speculative bit in their teeth. The elements of our discipline that we continue to emphasize are also those that we consider to be directly related to the very definition of total return.
As usual, our outlook will change in response to a change in market conditions. In particular, an improvement in market internals would encourage a more neutral view here, and defer the rather extreme concern we have about a potential market collapse. Until that sort of improvement occurs, I believe that investors should seriously allow for the likelihood – not just the possibility, but the likelihood – of a near-vertical market loss.
Historically, when trend uniformity has been positive, stocks have generally ignored overvaluation, no matter how extreme. When the market loses that uniformity, valuations often matter suddenly and with a vengeance. This is a lesson best learned before a crash than after one.
– John P. Hussman, Ph.D., October 3, 2000
As a side note, given that most of my work in economics, finance, and science has involved some form of noise reduction, I was thrilled to see Meehl’s work cited in Noise, a new book by Daniel Kahneman, Oliver Sibony, and Cass R. Sunstein. If you’re looking for a great, thoughtful read, it’s one of my favorites so far this year.
Ruling out market losses
“They won’t let it go down,” speculators just replied in unison – a phrase that conveniently embeds the assumption that Fed policy holds the market up mechanistically, rather than purely by way of the yield-seeking carry-trade mentality of speculators.
Recall how quantitative easing operates:
The Fed buys U.S. Treasury or mortgage-backed bonds.
The Fed pays by creating base money (currency and bank reserves).
Someone in the economy has to hold that base money at every moment until it is retired.
A bank depositor decides to take “idle” cash out of the bank and “put it to work” in stocks.
That same base money goes right into the account of whoever sold the stock.
The base money isn’t “on the sidelines” because there are no sidelines. Somebody has to hold it.
It isn’t “looking for a home.” It’s already home.
It can’t “go into” the market without instantly coming back out. It can only change hands.
The cash is there because the Fed put it there. It will not go away unless the Fed retires it.
The main effect of Fed easing is simply to create a pile of zero-interest hot potatoes that someone in the economy has to hold at every moment in time. It may be useful to examine how that pile of zero interest money can encourage speculation, and also the conditions when Fed easing can ineffective or even useless in “supporting” the market.
Remember, the total return of a security is equal to the income it delivers, plus any capital gain. If investors become generally convinced that the capital gain cannot be negative – at least not for any extended period of time, then zero-interest money, by definition, becomes instantly inferior to any so-called “risky” asset. In that environment, valuations aren’t a consideration because price losses have been psychologically ruled out. No margin of safety is required of valuations, because investors demand no compensation for the risk of loss. Creating more zero-interest base money then provokes more speculation because somebody has to hold it, and nobody wants to do so.
The whole “mechanism” of QE amounts to nothing but the creation of zero-interest hot potatoes that investors view as inferior holdings, provided – and this bit is essential – that they’ve psychologically ruled out the possibility of capital losses. The moment risk-aversion comes in, all bets are off. That’s how the market could collapse in 2000-2002 and 2007-2009 while the Fed eased the whole way down. Once zero-interest liquidity becomes a desirable asset rather than an inferior one, creating more of the stuff does nothing to encourage speculation in riskier securities.
The ironic truth of the current bubble is this: it’s not the effectiveness of Fed policy that rules out market losses. Rather, it’s the willingness of speculators to rule out market losses that makes Fed policy effective.
For evidence on this point, along with extensive content on monetary interventions, “cash on the sidelines,” the illusion of Fed “support,” the destabilizing impact of activist Fed policy, and numerous related considerations, see the May comment, Counting the Chickens Twice, the June comment, Alice’s Adventures in Equilibrium, and the July comment, What Triggered the Crash?.
Despite the Fed’s ability to amplify speculative pressures, nothing changes the Iron Law of Valuation: the higher the price an investor pays for a given stream of future cash flows, the lower the long-term return an investor will receive as those cash flows are delivered. That’s just arithmetic. Yet provided that zero-interest money is treated as an inferior “hot potato” and investors don’t care about valuations, $100 delivered a decade from now may sell for $200 today.
Faced with a deranged Federal Reserve, it’s important to remember that easy money reliably “supports” the market only when investors have psychologically ruled out the possibility of sustained losses. Again, it’s not the effectiveness of Fed policy that rules out market losses. Rather, it’s the willingness of speculators to rule out market losses that makes Fed policy effective. We gauge that willingness based on the uniformity or divergence of market internals. Regardless of whether monetary policy has been easy or tight, the S&P 500 has historically underperformed Treasury bills, on average, when market internals have been unfavorable. Even during the peak-to-peak market cycle from the 2007 market high prior to the global financial crisis through Friday’s record high, the entire total return of the S&P 500 in excess of Treasury bills has accrued during periods when our primary gauge of market internals has been favorable.
One of the best indications of the speculative willingness of investors is the ‘uniformity’ of positive market action across a broad range of internals. Probably the most important aspect of last week’s decline was the decisive negative shift in these measures. Now, it also happens that once the market reaches overvalued, overbought, and overbullish conditions, stocks have historically lagged Treasury bills, on average, even when those internals have been positive (a fact which kept us hedged). Still, the favorable internals did tell us that investors were willing to speculate, however abruptly that willingness might end. Evidently, it just ended, and the reversal is broad-based.
– John P. Hussman, Ph.D., Market Internals Go Negative, July 30, 2007
It’s certainly possible for the market to decline when internals are favorable, and for the market to advance when internals are unfavorable. On average, however, severe market losses tend to occur when internals are divergent, while major gains tend to occur when internals are uniformly favorable. I’ve been very open about the adaptation that was required of our investment discipline during the recent cycle – abandoning our pre-emptive bearish response to previously reliable “limits” to speculation. In contrast, valuations and market internals continue to be essential considerations, even in a zero interest rate world. Our investment discipline focuses directly on those market conditions, rather than placing blind faith in “Fed support” that has historically been accompanied by market losses, on average, when investor psychology is risk-averse (as investors should remember from the 2000-2002 and 2007-2009 declines).
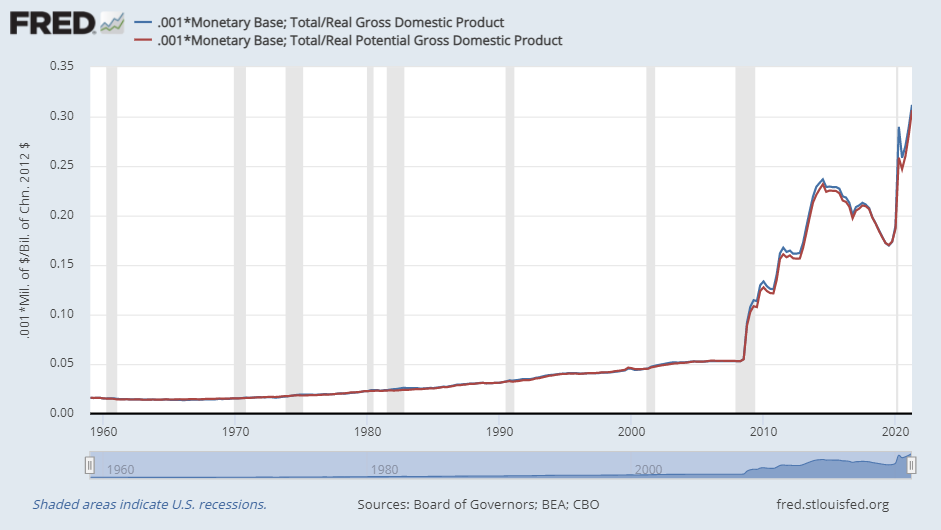
Meanwhile, it’s worth noting how wildly the Fed has strayed from its mandate under the Federal Reserve Act:
“The Board of Governors of the Federal Reserve System and the Federal Open Market Committee shall maintain long run growth of the monetary and credit aggregates commensurate with the economy’s long run potential to increase production”
– Federal Reserve Act, Section 2A
There’s a reason for that line. If a central bank allows base money to persistently expand at a dramatically higher rate than the output of real goods and services, it results in a chain of short- and long-term distortions that can include inflation, asset price bubbles, financial crises, loss of fiscal discipline, or a combination of all of them. The only question is which distortion comes first.
“Toto, I’ve got a feeling we’re not in Kansas anymore.”
In 1927 the Fed, as regulator of the economy, might have been expected to restrain wildly proliferating stock market credit by raising its master interest rate, the so-called discount rate, and reducing bank reserves. It did the opposite, and it was an action that has since been blamed for many unhappy events that followed.
– John Brooks, Once in Golconda, 1969
It’s fine for a low-growth economy to have low interest rates as well. But that’s also a situation that justifies no valuation premium, because the low growth rate already takes care of aligning expected equity returns with interest rates. In my view, the Fed could have avoided this yield-seeking speculative bubble, and the destabilizing effects of the collapse that will follow, simply by setting short-term interest rates near 2% instead of 0%. The difference may seem unimportant, but “0%” intentionally provokes speculation and disfigures investor psychology. The policy of zero interest rates, amplified by foisting a mountain of zero interest rate base money on investors through quantitative easing, is reckless, arrogant, and manipulative. The Fed will be responsible for the consequences even if it skirts the blame.
Now that we’ve reached the most extreme valuations in the history of the U.S. financial markets, all that needs to happen for Fed policy to become ineffective is for investors to consider the possibility of meaningful losses; to become concerned that others will attempt to take profits before they do, in a market where the bulls are all-in and the only ones out are historically-informed, value-conscious investors like us, whose skin is like the finest Corinthian leather, and who know that run-of-the-mill valuation norms are less than one-third of current levels. Nothing in our discipline relies on ever seeing those norms again, but we certainly expect a far more interesting trip ahead than many investors seem to have in mind.
The ironic truth of the current bubble is this: it’s not the effectiveness of Fed policy that rules out market losses. Rather, it’s the willingness of speculators to rule out market losses that makes Fed policy effective.
In a market downturn, the challenging part of the Iron Law of Equilibrium is that every share that’s sold also has to be bought. The market capitalization that everyone considers “wealth” is just the total number of outstanding shares times the price that the last buyer and seller traded even one of them.
A century of market history suggests that major losses are already effectively baked into current hypervalued extremes. The problem with a speculative bubble is that you can’t make the short-term outcomes better without making the long-term outcomes worse, and you can’t make the long-term outcomes better without making the short-term outcomes worse. Now it’s just an unfortunate situation.
Keep Me Informed
Please enter your email address to be notified of new content, including market commentary and special updates.
Thank you for your interest in the Hussman Funds.
100% Spam-free. No list sharing. No solicitations. Opt-out anytime with one click.
By submitting this form, you consent to receive news and commentary, at no cost, from Hussman Strategic Advisors, News & Commentary, Cincinnati OH, 45246. https://www.hussmanfunds.com. You can revoke your consent to receive emails at any time by clicking the unsubscribe link at the bottom of every email. Emails are serviced by Constant Contact.
The foregoing comments represent the general investment analysis and economic views of the Advisor, and are provided solely for the purpose of information, instruction and discourse.
Prospectuses for the Hussman Strategic Growth Fund, the Hussman Strategic Total Return Fund, the Hussman Strategic International Fund, and the Hussman Strategic Allocation Fund, as well as Fund reports and other information, are available by clicking “The Funds” menu button from any page of this website.
Estimates of prospective return and risk for equities, bonds, and other financial markets are forward-looking statements based the analysis and reasonable beliefs of Hussman Strategic Advisors. They are not a guarantee of future performance, and are not indicative of the prospective returns of any of the Hussman Funds. Actual returns may differ substantially from the estimates provided. Estimates of prospective long-term returns for the S&P 500 reflect our standard valuation methodology, focusing on the relationship between current market prices and earnings, dividends and other fundamentals, adjusted for variability over the economic cycle.