

Quit While You’re Ahead


John P. Hussman, Ph.D.
President, Hussman Investment Trust
March 2022
You cannot beat a roulette table unless you steal money when the dealer isn’t looking.
– Albert Einstein
The expected return from a roulette spin is negative: -5.26%. An operation that has a negative expected return is not an investment. It’s not even an intelligent speculation. It’s simply a gamble. Of course, you might get lucky, but on average you won’t. If you insist on playing anyway, the last useful resort is to follow the advice of Baltasar Gracián y Morales: “Quit while you’re ahead. All the best gamblers do.”
Why are you taking market risk? Whether you’re investing for yourself, or you’re a member of an investment committee making decisions for a pension fund or charitable organization, you’re responsible for asking that question. The natural answer is that you expect positive and adequate investment returns to compensate you for the risk. The next questions are then a) on what basis do you expect that investment return? and b) on what basis do you believe that the expected return is adequate and proportionate to the risk you’re accepting?
In their classic 1934 text, Security Analysis, Benjamin Graham and David Dodd described “investment” as buying a security at a valuation that is associated with a reasonable expectation of acceptable long-term returns, based on a careful analysis of the relationship between the current price and the assets and cash flows of the business. As Graham observed, “The habit of relating what is paid to what is being offered is an invaluable trait in investment.” In contrast, “speculation” involves buying a security simply on the expectation that its price will advance. If you are not using well-defined and historically reliable valuation measures as a basis for investment, and you don’t have a well-defined and historically validated basis on which to expect speculative behavior from other investors, you’re probably gambling.
Intelligent investing
In our own work, intelligent investing involves careful consideration of the arithmetic that links current prices with future cash flows; and the historical evidence that relates reliable valuation measures to subsequent long-term returns. Valuations also provide information about the potential market losses that investors may experience over the compete market cycle.
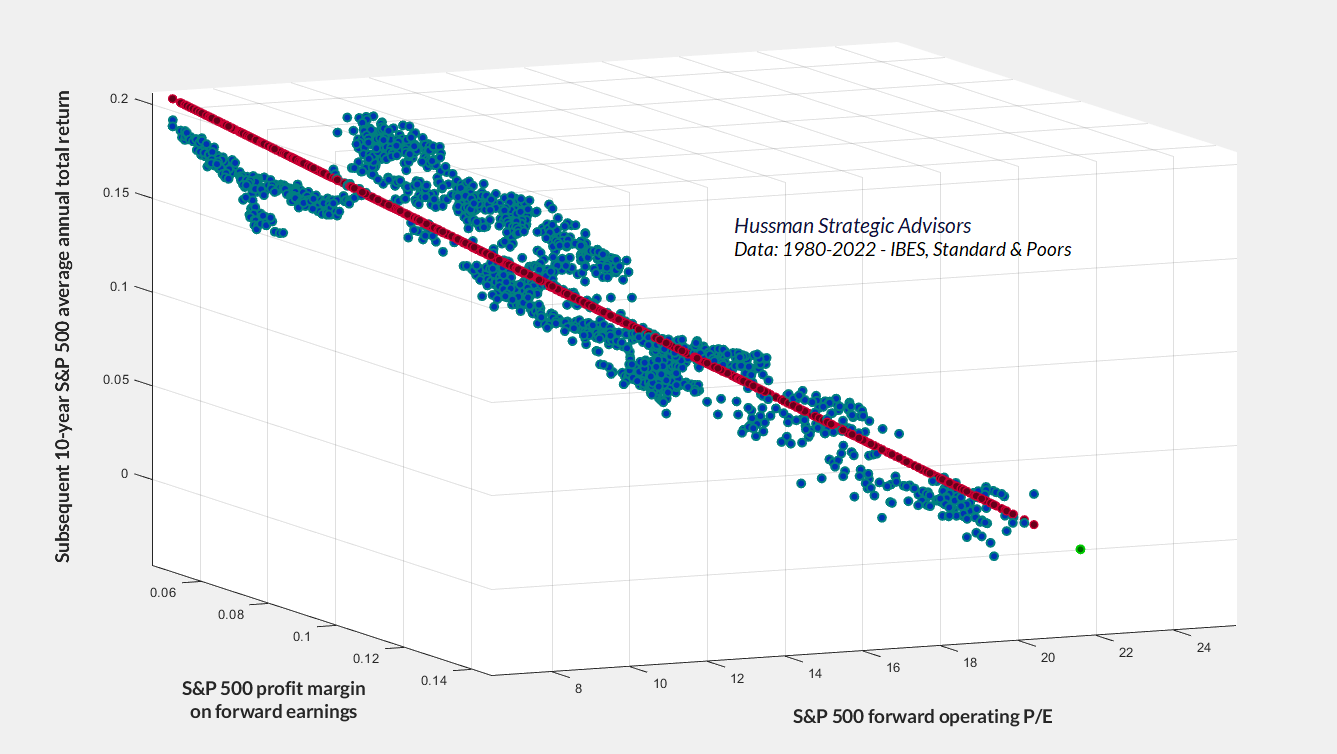
The problem with simple P/E ratios (or even P/E ratios based on year-ahead estimates of “forward” earnings) is that stocks are not claims on a single year of earnings. A good valuation measure is just shorthand for a proper discounted cash flow analysis, and relates the current price with observable fundamentals that are representative of decades of likely future cash flows. Indeed, as the title of last month’s market comment suggests, the most negative market returns follow periods when investors pay Top Dollar for Top Dollar: high P/E multiples on earnings that rely on elevated profit margins. Once a high P/E and a high profit margin are embedded into price, both have to be sustained indefinitely in order for prices to avoid very strong headwinds.
In this context, the attention that Wall Street pays to “forward operating P/E ratios” is cringeworthy. The chart below shows the reality of the situation, in data since 1980. The red scatter shows fitted regression values, and the chart is oriented in 3D to capture that linear relationship. The green dot in the lower right corner is the fitted value based on the current forward P/E and operating profit margin, and is clearly the worst fitted value in the dataset.
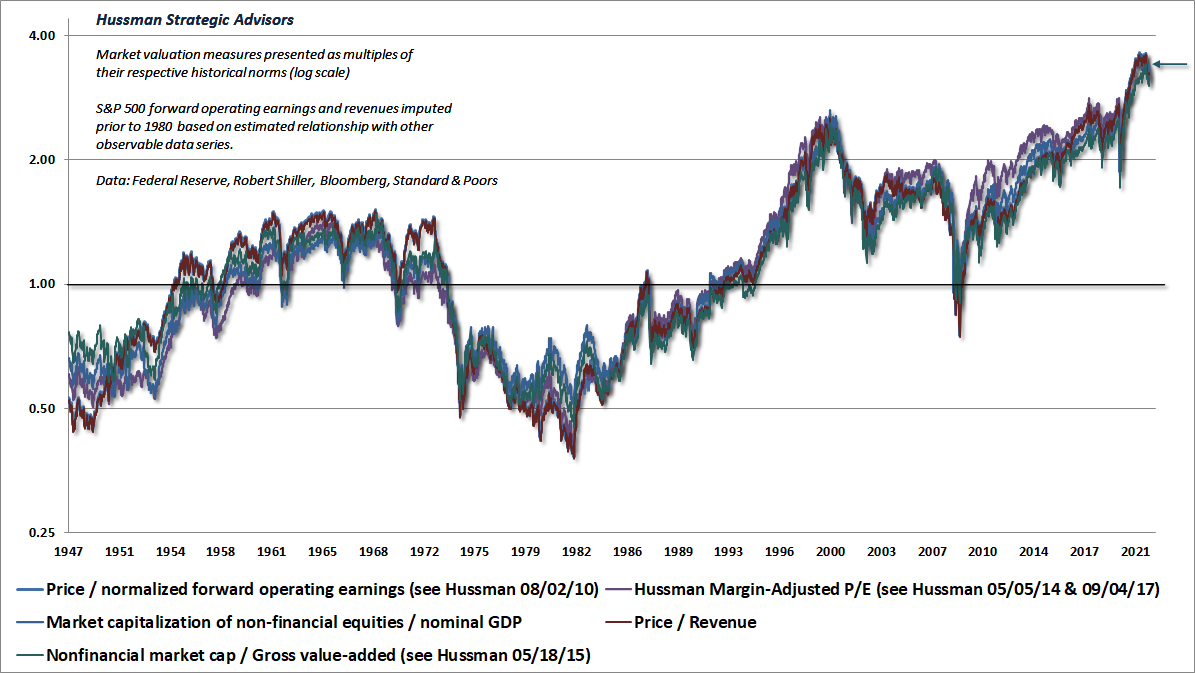
The chart below shows the valuation measures that we find best-correlated with actual subsequent returns across decades of historical market cycles. While the ratio of nonfinancial market capitalization to corporate gross value added, including estimated foreign revenues (a measure that I introduced in 2015) is most reliable across history, the lines are largely indistinguishable. The arrow shows the current level of valuations, and offers insight into just how much “opportunity” recent market weakness has created for investors.
The scatter plot below shows a variety of valuation measures versus actual subsequent S&P 500 12-year total returns. I’ve included the somewhat less reliable Shiller cyclically-adjusted P/E (CAPE), largely to illustrate that the implications aren’t highly sensitive to which measure one uses.
In the chart, the horizontal axis is on log scale, and shows each valuation measure as a ratio to its historical norm. Regardless of which measure you choose, you’ll find that the estimated 12-year average annual total return for the S&P 500 is negative based on the current level of valuations relative to their historical norms. The only debate is how negative. Investors do not somehow “put their money to work” by chasing stocks at record valuations.
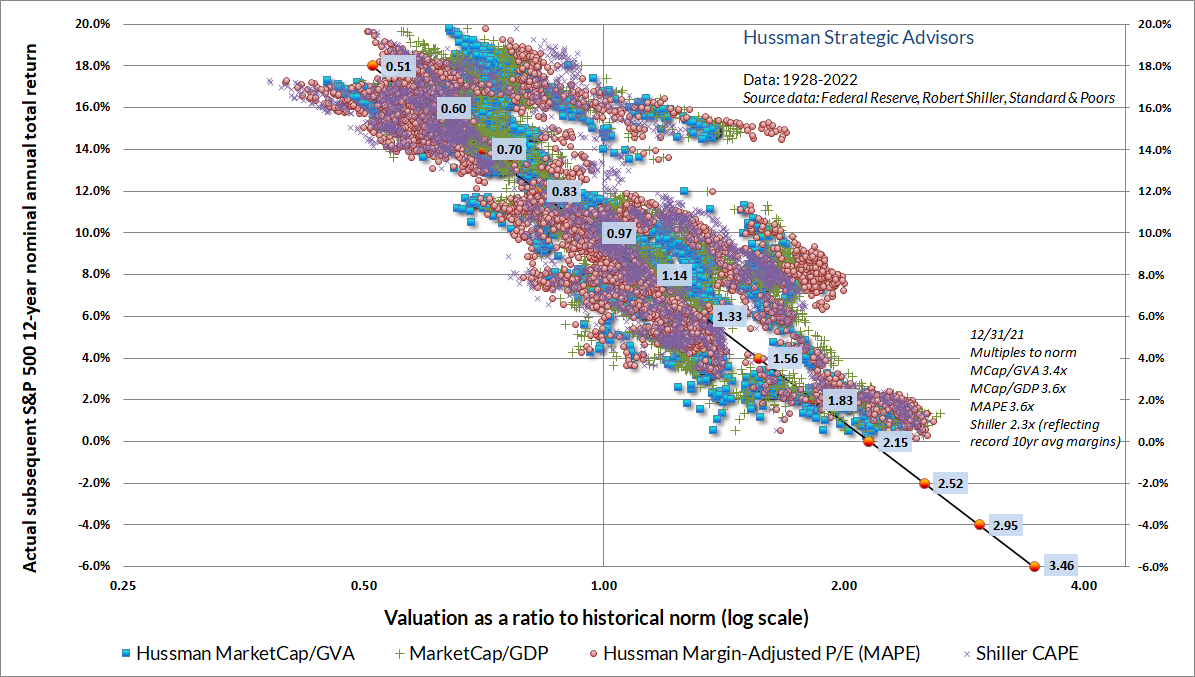
If we define “V” as the ratio of any given (reliable) valuation measure to its historical norm, you’ll notice that for all of these measures, historically normal valuations (V = 1.0 on the horizontal axis) are associated with historically normal S&P 500 subsequent total returns of about 10% annually.
Geek’s Note: Those of you who like math can quickly figure out from the chart that the slope of the best-fitting line is -0.10/[ln(2.15)-ln(0.97)] = -0.126. As a result, a handy rule-of-thumb estimate for expected S&P 500 10-12 year total returns is just 10% – 0.126*ln(V), where V is the ratio of your preferred valuation measure to its historical norm. If you’re unsure of what the correct norm actually is, estimate Y = a + b*ln(X), where Y is the S&P 500 annual total return over a horizon of 10-12 years, and X is your preferred valuation measure. Now solve for the valuation measure that gives you a historically run-of-the-mill expected return of 10%, and your valuation norm is just: exp[(0.10-a)/b].
One of the most overlooked and misunderstood aspects of investing is this: the rate of return that you use to discount future cash flows to present value is also the rate of return that you can expect to earn over time if those expected cash flows are actually delivered. Suppose a security will deliver a single $100 payment a decade from today. If you choose to discount that future cash flow to present value using a rate of 6% annually, you can quickly calculate that you’ll be willing to pay $100/(1.06)^10 = $55.84 today. The moment you pay that price, you can also calculate that your expected return is ($100/$55.84)^(1/10)-1 = 6% annually.
Did you need to “adjust” that expected return calculation for the level of interest rates? No, you did not. Given any set of future cash flows, the current, observed level of valuation is a sufficient statistic for the expected future return.
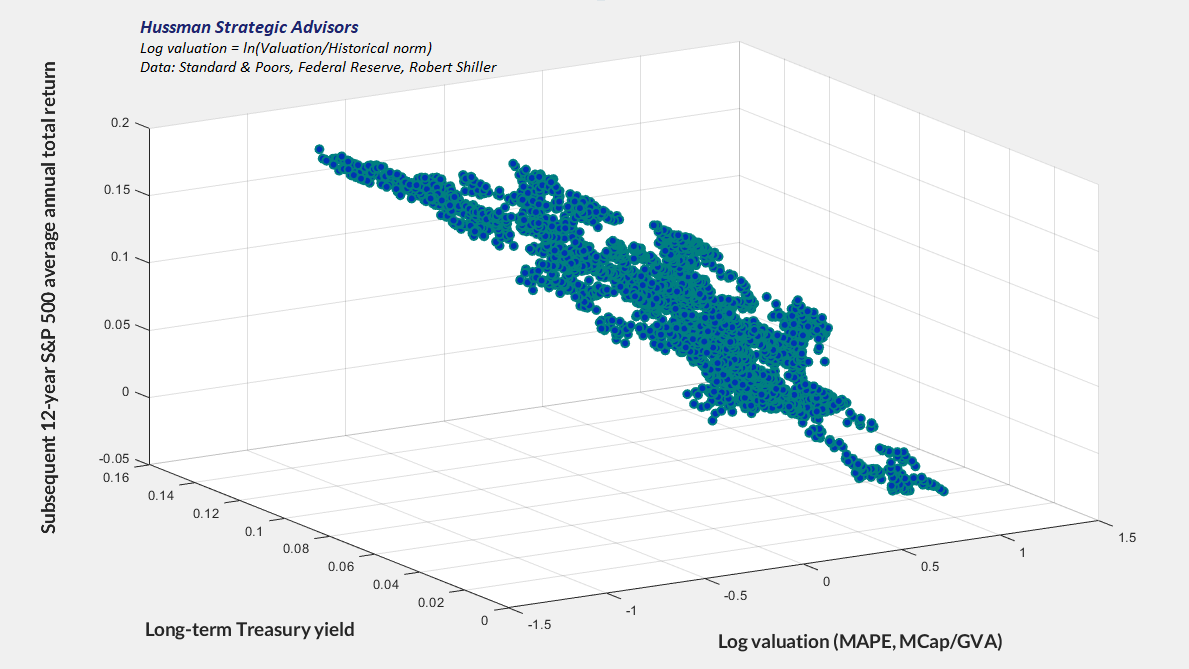
The fact that the discount rate is identical to the expected rate of return may seem obvious, but clearly it is not obvious to Wall Street. See, low interest rates may very well encourage investors to use a low discount rate to value stocks, and therefore to pay higher valuations. But once high valuations are in place, the low future expected returns are also in place! In other words, low interest rates may encourage rich valuations, but they do not mitigate the poor subsequent market returns that result from those rich valuations. The chart below illustrates this point, in historical data since 1928. Emphatically, the combination of low interest rates and rich valuations is not your friend.
All of this is why we find that the best way to estimate the expected “risk premium” for stocks, over and above Treasury yields, is to a) use reliable valuation measures to estimate subsequent S&P 500 total returns directly, and then b) subtract the prevailing level of Treasury yields. In contrast, risk-premium models that subtract bond yields from earnings yields, as if there is a one-for-one relationship between the two, are both ad-hoc and mis-specified.
Investors do not somehow ‘put their money to work’ by chasing stocks at record valuations.
The chart below shows our current estimate of the expected “risk premium” for the S&P 500, over and above Treasury yields. The current value is as negative as it was at the 1929 and 2000 market extremes. Not surprisingly, the entire total return of the S&P 500 in excess of Treasury bill returns (and then some) has occurred in periods when the estimated risk-premium was positive. The problem with a negative risk-premium isn’t that overvalued markets can’t advance – they can, and that’s why we use market internals to gauge speculative psychology – but rather that those speculative returns are almost invariably wiped out over the completion of the market cycle.
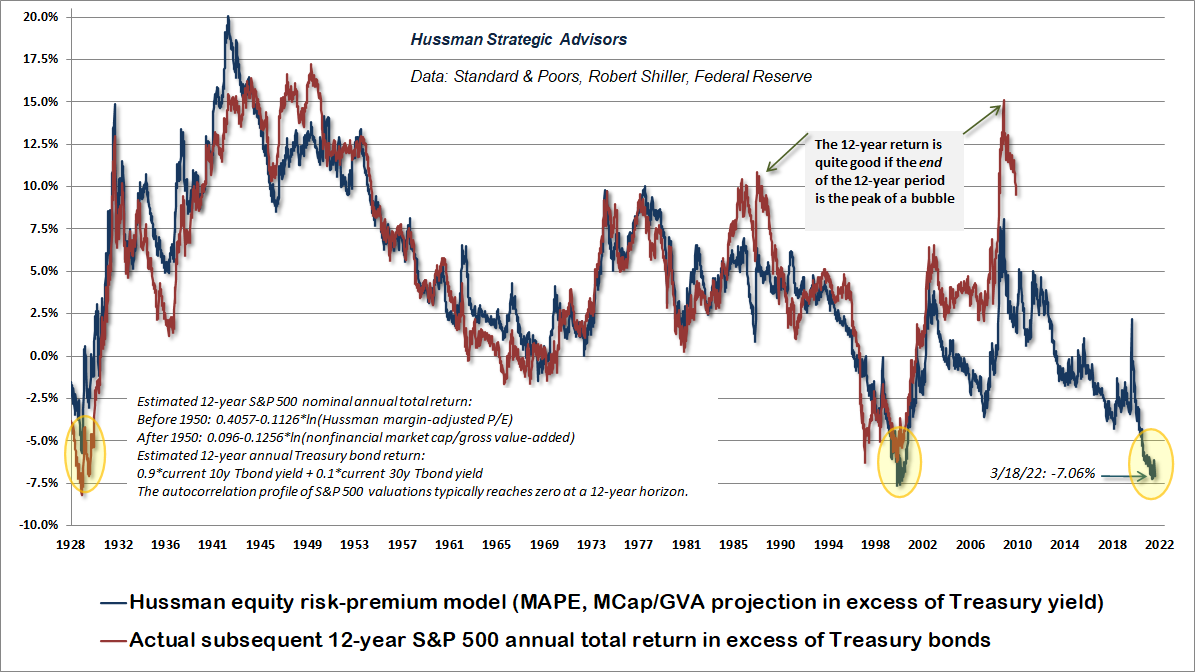
In the chart above, notice the “errors” in 1988 and 2009. There’s no question that if a 12-year period ends at the most extreme bubble valuations in history, the 12-year return over that period will be greater than one would have previously expected on the basis of starting valuations. Investors have a horrifying record of abandoning their attention to valuations because of those “errors,” and an extremely brief memory of the market collapses that followed those moments in history.
During the latter stage of the bull market culminating in 1929, the public acquired a completely different attitude towards the investment merits of common stocks… Why did the investing public turn its attention from dividends, from asset values, and from average earnings to transfer it almost exclusively to the earnings trend, i.e. to the changes in earnings expected in the future? The answer was, first, that the records of the past were proving an undependable guide to investment; and, second, that the rewards offered by the future had become irresistibly alluring.
Along with this idea as to what constituted the basis for common-stock selection emerged a companion theory that common stocks represented the most profitable and therefore the most desirable media for long-term investment. This gospel was based on a certain amount of research, showing that diversified lists of common stocks had regularly increased in value over stated intervals of time for many years past.
These statements sound innocent and plausible. Yet they concealed two theoretical weaknesses that could and did result in untold mischief. The first of these defects was that they abolished the fundamental distinctions between investment and speculation. The second was that they ignored the price of a stock in determining whether or not it was a desirable purchase.
The notion that the desirability of a common stock was entirely independent of its price seems incredibly absurd. Yet the new-era theory led directly to this thesis… An alluring corollary of this principle was that making money in the stock market was now the easiest thing in the world. It was only necessary to buy ‘good’ stocks, regardless of price, and then to let nature take her upward course. The results of such a doctrine could not fail to be tragic.
– Benjamin Graham & David L. Dodd, Security Analysis, 1934
Intelligent speculation
Over the long-term, and over the complete market cycle, valuations matter. A security is nothing more than a claim on some future set of cash flows that will be delivered into the hands of investors over time. The return that investors enjoy over the long-term is simply a mathematical relationship between the current price and those future cash flows.
Over shorter horizons, however, price fluctuations are driven almost entirely by the psychology of investors. Every dollar that a buyer puts “into” stocks comes right back “out” of stocks in the hands of a seller. The change in price isn’t driven by the amount of money that changes hands, but instead, by which person is more eager. If the buyer is more eager, the price goes up. If the seller is more eager, the price goes down. As a result, short-term market fluctuations depend heavily on whether other investors, in general, are more disposed toward speculation or toward risk-aversion.
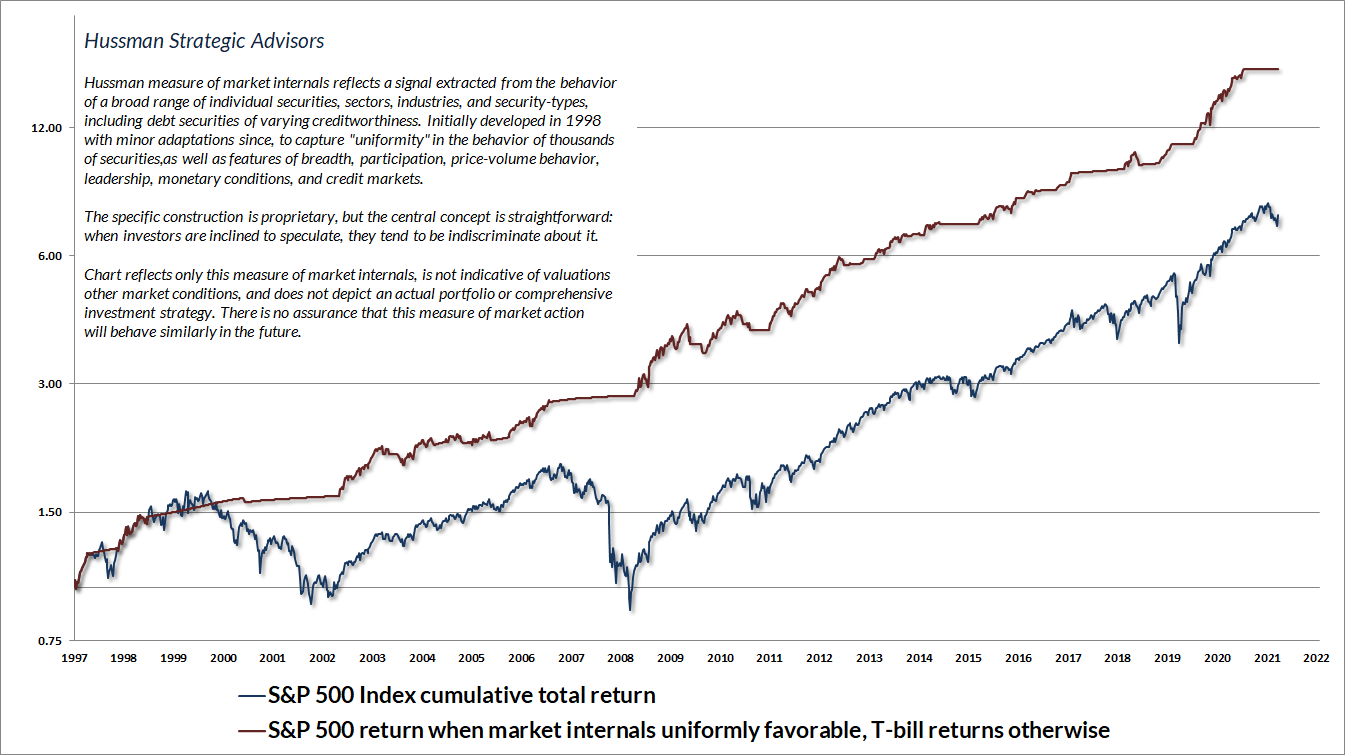
When investors are inclined to speculate, they tend to be indiscriminate about it. In contrast, when investors become risk-averse, they become increasingly selective. For that reason, our most reliable gauge of speculation versus risk-aversion is the uniformity of market internals across thousands of securities, industries, sectors, and asset classes, including debt securities of varying creditworthiness. I originally developed our gauge of market internals in 1998, and it was enormously helpful in navigating the collapses of the tech bubble and the mortgage bubble.
Historically, there was also a third very useful consideration. In prior market cycles, there was typically a “limit” to speculation, which one could identify based on a combination of “overvalued, overbought, overbullish” conditions. In the face of the Federal Reserve’s deranged experiment with zero interest rates, our response to those “limits” created quite a bit of difficulty for us. The frantic yield-seeking speculation of investors continued long after historically reliable warning signs emerged, and even after the 1929 and 2000 valuation extremes were exceeded.
Our late-2017 adaptation didn’t require us to introduce clever or complex new elements to our investment discipline. Instead, it required us to “unlearn” the warning signs that historically placed “limits” on speculation, and instead to prioritize valuations and market internals. In short, we became content to gauge valuations, and the presence or absence of speculative or risk-averse investor psychology, without assuming that there is any well-defined “limit” to either.
Still, it’s one thing to refrain from fighting speculation amid record valuations. It’s another thing to embrace speculation amid record valuations. When market internals are favorable, there can be a reasonable middle ground: to accept moderate amounts of market exposure – coupled with position limits or safety nets that constrain risk. These criteria fall into what Graham would describe as “intelligent speculation.” As I observed last September, these later refinements “basically amount to criteria for accepting moderate amounts of market exposure – coupled with position limits or safety nets that constrain risk – even in conditions where valuations imply poor long-term returns.” Taken together, the adaptations we’ve made during the recent bubble restore the strategic flexibility that allowed us to admirably navigate decades of complete market cycles, bubbles, and collapses, prior to the Federal Reserve’s experimental foray into zero-interest rate policy.
Unlike valuations, where we are extremely open about our methods, shifts in market internals are very discrete, and one doesn’t want to respond to market behavior at the exact moment everyone else does. That said, I’m very open about the underlying principles: 1) when investors are inclined to speculate, they tend to be indiscriminate about it, and 2) when two securities diverge, the dispersion provides information about factors that they do not share in common. Our own methods involve a very broad signal-extraction from market behavior, but the general features can be captured by examining multiple concepts of “uniformity” – breadth (advancing/declining issues), participation (% of stocks moving jointly), leadership (new highs/lows), price-volume behavior (sponsorship), trend and momentum-related indicators, credit spreads, and similar measures.
I noted last year that part of our response to zero-interest rate policy was to adopt a slightly more “permissive” threshold in our gauge of market internals when interest rates are near zero and certain measures of risk-aversion are well-behaved. A more permissive threshold captures the idea that tossing deranged Fed policy into the mix boosts the implications of a given improvement in market internals. The main effect is to promote a more constructive shift following material market losses. Presently, however, our assessment of market internals remains unfavorable.
The chart below presents the cumulative total return of the S&P 500 in periods where our measures of market internals have been favorable, accruing Treasury bill interest otherwise. The chart is historical, does not represent any investment portfolio, does not reflect valuations or other features of our investment approach, and is not an assurance of future outcomes. On average, our gauge of market internals shifts about twice a year, though about 25% of shifts persist for fewer than 6 weeks, and about 25% persist for 40 weeks or longer. We don’t attempt to forecast these shifts. We simply respond to them.
Baseless gambling
An investment operation is one which, upon thorough analysis promises safety of principal and an adequate return. Operations not meeting these requirements are speculative. The distinction between investment and speculation in common stocks has always been a useful one and its disappearance is a cause for concern. In most periods the investor must recognize the existence of a speculative factor in his common stock holdings. It is his task to keep this component within minor limits, and to be prepared financially and psychologically for adverse results that may be of short or long duration.
There is intelligent speculation as there is intelligent investing. But there are many ways in which speculation may be unintelligent. Of these the foremost are: (1) speculating when you think you are investing; (2) speculating seriously instead of as a pastime, when you lack proper knowledge and skill for it; and (3) risking more money in speculation than you can afford to lose.
– Benjamin Graham, The Intelligent Investor
The best possible investment situation is when market conditions provide both investment merit and speculative merit – a combination of undervaluation, price compression, and early improvement in market internals.
In contrast, the worst possible investment situation is when market conditions provide neither investment merit nor speculative merit – a combination of overvaluation, price extension, and early deterioration in market internals. That’s the combination that we observe at present, and our investment outlook is grounded in these considerations. That outlook will shift as the evidence does.
One of the best indications of the speculative willingness of investors is the ‘uniformity’ of positive market action across a broad range of internals. Probably the most important aspect of last week’s decline was the decisive negative shift in these measures… This is much like what happens when a substance goes through a ‘phase transition,’ for example, from a gas to a liquid or vice versa. Portions of the material begin to act distinctly, as if the particles are choosing between the two phases.
– John P. Hussman, Ph.D., July 30, 2007
The information contained in earnings, balance sheets, and economic releases is only a fraction of what is known by others. The action of prices and trading volume reveals other important information that traders are willing to back with real money. This is why trend uniformity is so crucial to our Market Climate approach. Historically, when trend uniformity has been positive, stocks have generally ignored overvaluation, no matter how extreme. When the market loses that uniformity, valuations often matter suddenly and with a vengeance. This is a lesson best learned before a crash rather than after one.
– John P. Hussman, Ph.D., October 3, 2000
As usual, no forecasts are required. Our discipline is to align our investment outlook with prevailing conditions, and to change our outlook when those conditions change. In my view, the challenge for investors is that until and unless we observe an improvement in the uniformity of market internals, or a retreat in market valuations, the only “opportunities” are likely to be purely tactical – involving minor changes in market exposure in response to short-term oversold conditions (as we observed briefly in recent weeks).
From the perspective of our own value-conscious, historically-informed, full-cycle investment discipline, valuations do not provide an environment for “intelligent investment” here, nor do market internals provide an environment for “intelligent speculation.” Aside from very minor tactical shifts, the main opportunity that investors have in the current environment is the opportunity for baseless gambling.
As I noted at the outset, for investors who insist on playing anyway, the last useful resort is to follow the advice of Baltasar Gracián y Morales: “Quit while you’re ahead. All the best gamblers do.”
Keep Me Informed
Please enter your email address to be notified of new content, including market commentary and special updates.
Thank you for your interest in the Hussman Funds.
100% Spam-free. No list sharing. No solicitations. Opt-out anytime with one click.
By submitting this form, you consent to receive news and commentary, at no cost, from Hussman Strategic Advisors, News & Commentary, Cincinnati OH, 45246. https://www.hussmanfunds.com. You can revoke your consent to receive emails at any time by clicking the unsubscribe link at the bottom of every email. Emails are serviced by Constant Contact.
The foregoing comments represent the general investment analysis and economic views of the Advisor, and are provided solely for the purpose of information, instruction and discourse.
Prospectuses for the Hussman Strategic Growth Fund, the Hussman Strategic Total Return Fund, the Hussman Strategic International Fund, and the Hussman Strategic Allocation Fund, as well as Fund reports and other information, are available by clicking “The Funds” menu button from any page of this website.
Estimates of prospective return and risk for equities, bonds, and other financial markets are forward-looking statements based the analysis and reasonable beliefs of Hussman Strategic Advisors. They are not a guarantee of future performance, and are not indicative of the prospective returns of any of the Hussman Funds. Actual returns may differ substantially from the estimates provided. Estimates of prospective long-term returns for the S&P 500 reflect our standard valuation methodology, focusing on the relationship between current market prices and earnings, dividends and other fundamentals, adjusted for variability over the economic cycle.