

Estimating Downside Market Risk


John P. Hussman, Ph.D.
President, Hussman Investment Trust
October 2022
I realize that the entire tenor of market commentary here is ‘A good investor rides out the storms. Hold for the long term and you’ll be fine.’ The problem is that market participants stopped being investors when they accepted the notion that stocks are always attractive regardless of the price paid for them. Though prices have moved down rapidly, I have not seen much evidence that investors have actually reduced their exposure. Yes, they feel pain, but they’re hoping that the pain will end without the necessity of doing anything. Again, the real problem is that they have no concept of value. They’re looking at how far prices have declined, and have decided that this must be enough. But unless they understand value, they do not realize how much lower prices would have to decline just to attain median historical valuations. Value is not measured by how far prices have declined, but by the relationship between prices and properly discounted cash flows. On that basis, the market could have a deep follow-through ahead. We’ll take our signals as they come.
– John P. Hussman, Ph.D., March 15, 2001
At the beginning of 2022, our most reliable stock market valuation measures stood at record levels, beyond even their 1929 and 2000 extremes. The 10-year Treasury yield was at 1.5%, the 30-year Treasury bond yield was at 1.9%, and Treasury bill yields were just 0.06%. By our estimates, that combination produced the most negative expected return for a conventional passive investment portfolio in U.S. history. Year-to-date through October 14, 2022, the S&P 500 has lost -23.9% including dividends, 10-year Treasury bonds have lost -18.1%, and 30-year Treasury bonds have lost -33.8%.
For any given set of future cash flows, the lower the price an investor pays today, the higher the returns the investor will enjoy in the future. The “good news” is that the declines in stock and bond prices this year have increased the long-term returns investors can expect. The bad news is that the “good news” is likely to get better.
At present, investors in Treasury bonds can at least look forward to earning an average of 4.02% annually over a 10-year horizon, and 3.99% annually over a 30-year horizon. Likewise, year-to-date stock market losses have been sufficient to bring our estimates of 10-12 year S&P 500 total returns from the most negative levels in history to – well, about zero. It’s a start.
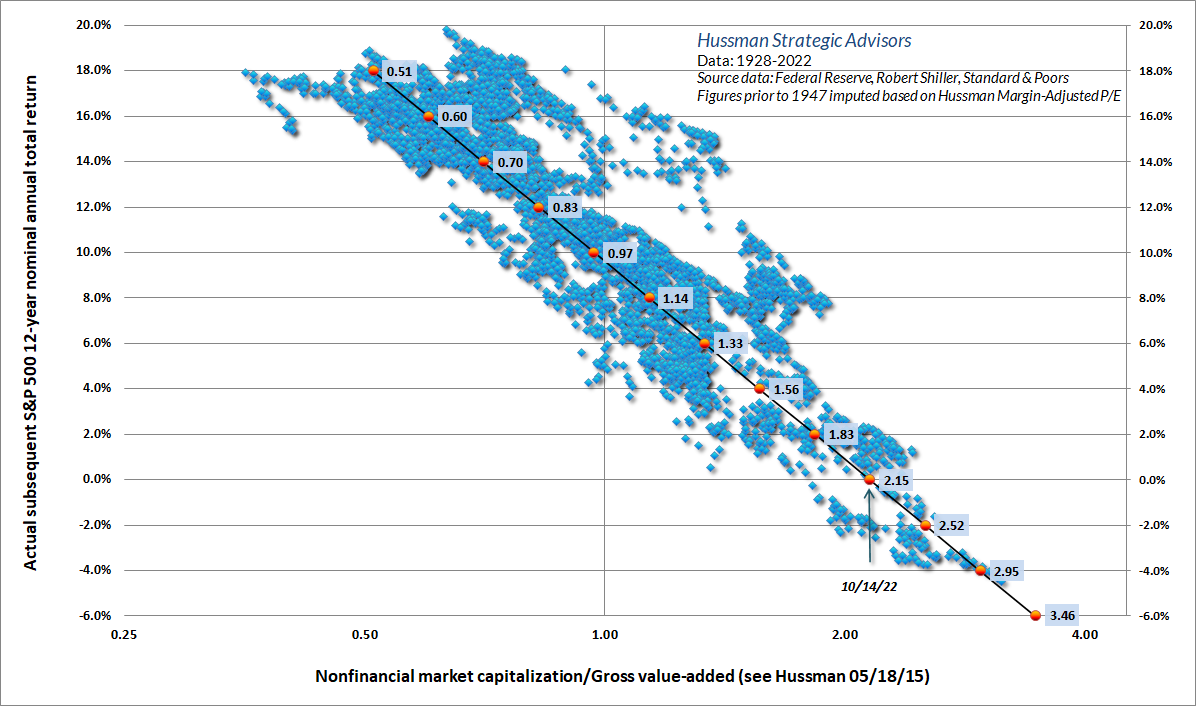
Generally speaking, rich valuations are associated with weak subsequent market returns, while depressed valuations are associated with strong subsequent market returns. The chart below illustrates this relationship, showing our most reliable measure: nonfinancial market capitalization to gross value-added, including estimated foreign revenues (MarketCap/GVA), versus actual subsequent 12-year S&P 500 nominal total returns, in data since 1928.
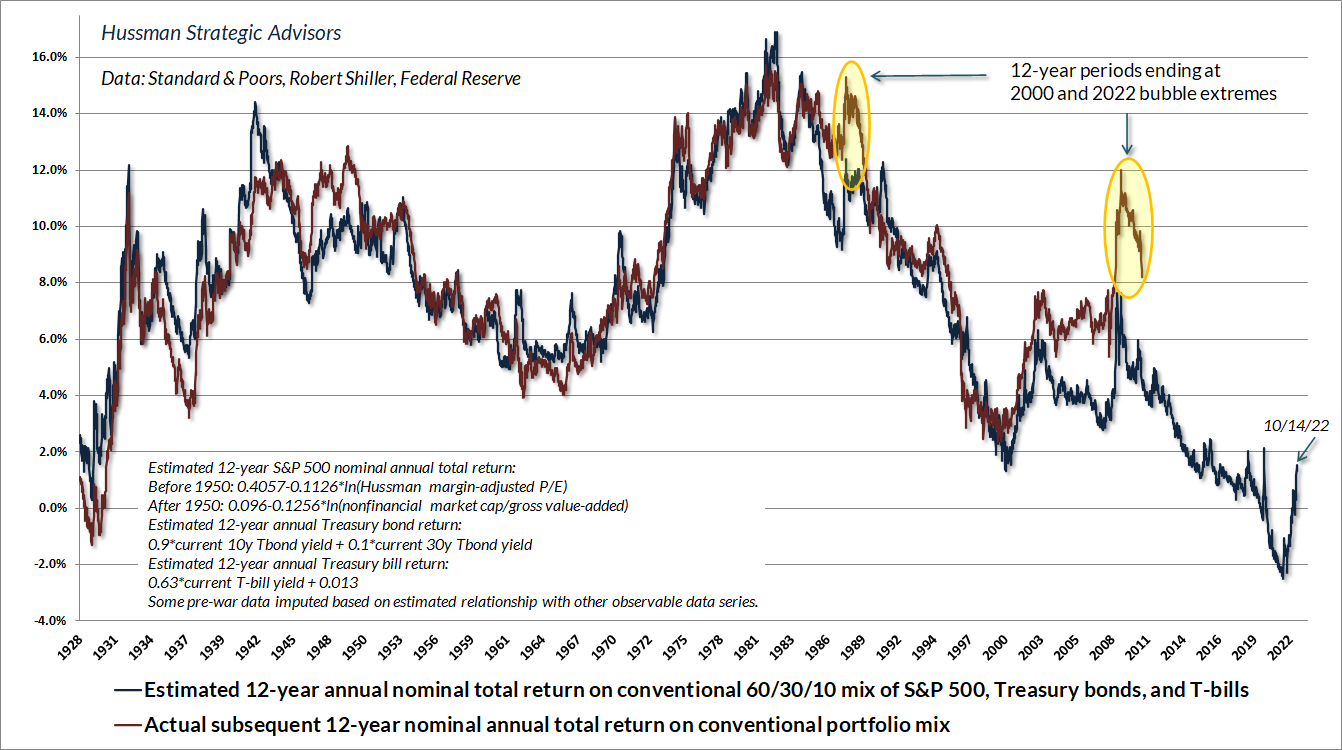
Taking stocks and bonds together, the chart below shows our best estimate of expected 12-year average annual nominal total returns for a conventional passive investment allocation invested 60% in the S&P 500, 30% in 10-year Treasury bonds, and 10% in Treasury bills. The red line (which obviously ends 12 years ago) shows the actual subsequent 12-year total return for this portfolio mix.
You can see the impact of year-to-date market losses both as an upward spike in estimated future returns (blue line), and as the surrender of past returns (red line). These losses have been enough to push our total return estimate for a balanced portfolio into slightly positive territory, though still not quite to the level we saw at the 2018 and 2020 market lows. At both of those lows, the Federal Reserve was able to rekindle yield-seeking speculation by rapidly expanding the amount of zero-interest base money that the public had to choke down (which someone has to hold, passing from one investor to the next like hot potatoes). With CPI inflation running at 8.2%, and core inflation measures running between 4.9% and 6.6%, the Fed no longer has that recklessly dangerous luxury.
The prospects for S&P 500 total returns have certainly improved since the beginning of the year, but they are still far from adequate. There are only two ways to make them adequate: either prices must decline further, or prices must stagnate for more than a decade while fundamentals catch up. My impression is that we’re likely to see a combination of both, resulting in what I’ve often called a “long, interesting trip to nowhere.” This outcome would mirror what investors experienced during 1929-1947, 1966-1985, and 2000-2013. In each case, the S&P 500 lagged Treasury bills for more than a decade. That’s 50 years out of 84. Starting valuations matter.
For any given set of future cash flows, the lower the price an investor pays today, the higher the returns the investor will enjoy in the future. The ‘good news’ is that the declines in stock and bond prices this year have increased the long-term returns investors can expect. The bad news is that the ‘good news’ is likely to get better.
Roots of a pension crisis
Given that the typical return assumption of U.S. pensions is in the range of 6.5-7% annually, the extreme valuations and compressed expected returns produced by a decade of zero-interest rate policy will likely result in growing strains among pensions. Year-to-date portfolio losses are just the warm-up, because unrealistic and price-insensitive return assumptions are likely to result in funding shortfalls. Similar difficulties are likely for a wide range of passive investment strategies that assume the historical returns of stocks and bonds are fixed numbers, regardless of price, ignoring that future returns are just the upside-down mirror image of (log) starting valuations.
The pension crisis in the United Kingdom provides a particularly stark example of the untold mischief caused by the combination of zero-interest rate monetary policy and price-insensitive investment behavior. Many U.K. pensions follow a strategy called “liability driven investment” (LDI) which seeks to invest in assets that have maturities matching the dates that various liabilities will need to be met. As I’ve discussed before, there’s a great deal of sense in matching the duration of assets with the duration of liabilities, particularly for liabilities that will need to be met within a limited number of years. For example, large expenses payable in the next year or two should not be matched with investments in 10-year bonds, or worse, the stock market.
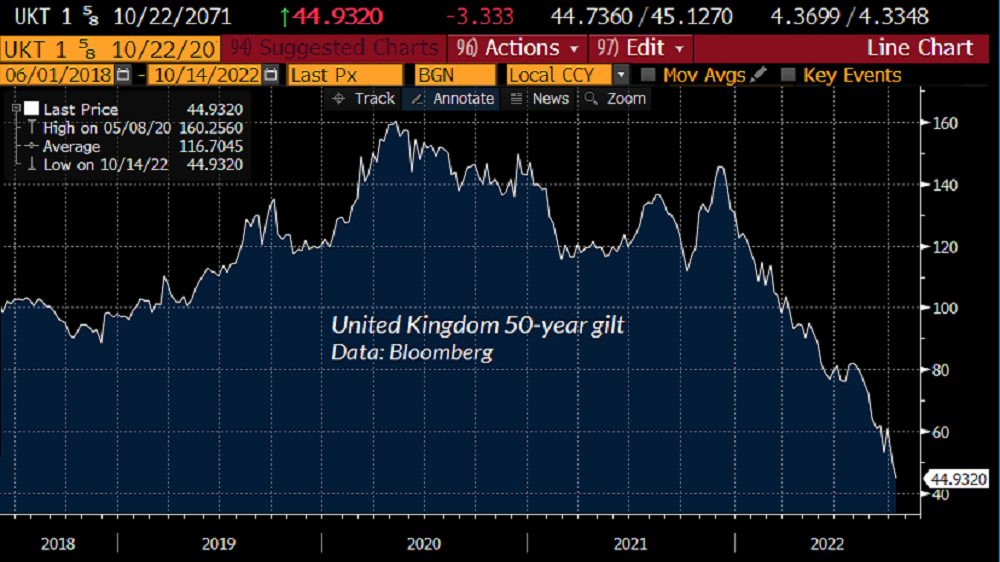
The danger comes when very long-term liabilities are funded with very long-term assets, with no regard for how those assets are priced. That’s exactly what many LDI funds have done, commonly holding 30-50 year gilts (U.K. government bonds) to finance their long-term liabilities. In the throes of yield-seeking speculation encouraged by zero-interest rate monetary policies, the yield on 50-year gilts fell to just 0.33% by mid-2020. By last week, that yield had increased to 4.37%. Now, one might not think that a 4.37% yield would be high enough to trigger a pension crisis. But remember that the increase in yield, for all those 50 years, has to be achieved by reducing the current price. From their 2020 peak, benchmark 50-year gilts have collapsed by -72%. Government bonds. Not a typo. From last December’s high, the popular 30-year inflation-linked gilt was recently down -77% (though with a bit of compensation for U.K. inflation).
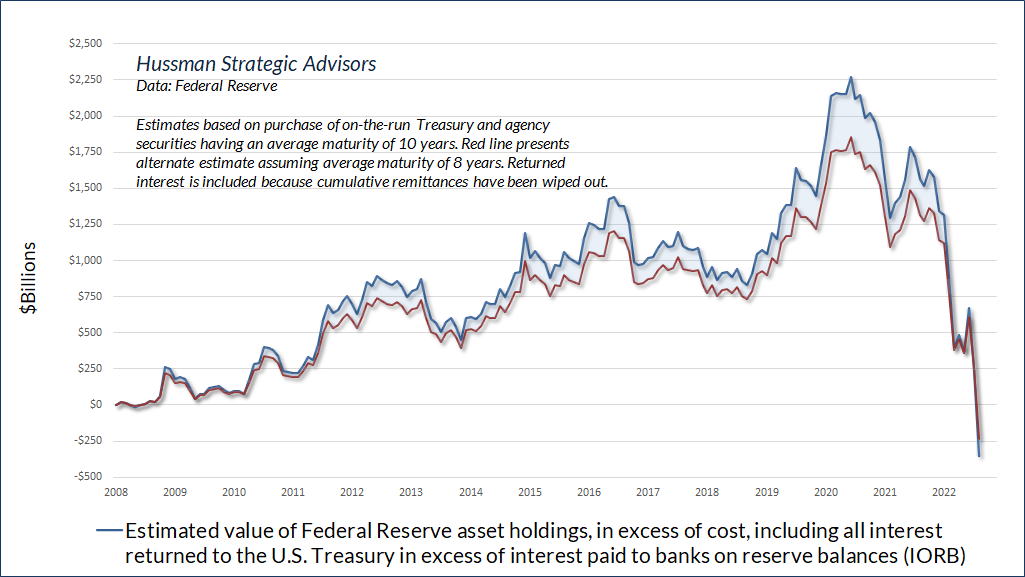
The situation is similar for the Federal Reserve’s own portfolio, though the average maturity of its holdings (based on SOMA data) is about 8-10 years, and the Fed does not mark its losses to market (assets are reported at face value). The chart below shows our estimate of the market value of the Federal Reserve’s asset holdings, over and above cost. These estimates reflect the actual date and quantity of assets purchased by the Fed since 2008. The blue line assumes a 10-year average maturity. The red line assumes an 8-year average.
In the estimate below, we’ve included the cumulative interest that the Fed has returned to the Treasury since 2008, to underscore that all of these cumulative remittances have also been wiped out. Treating the Fed’s balance sheet separately, the hole is much deeper than what’s shown below. You won’t see these losses on any of the Fed’s reports, because again, it books its holdings at face value, and doesn’t mark the value of its holdings to market.
By our estimates, the Fed has created government liabilities for which it no longer has offsetting assets, which means that the Fed has quietly gone insolvent – not that anyone cares given that this insolvency is opaque. Moreover, having forced the public to choke down trillions of dollars in base money – mostly held indirectly as bank deposits – the Fed can’t even conduct monetary policy without paying interest to banks on those reserves (otherwise, yield-seeking by banks would drive rates below the Fed’s targets). Leave aside the question of whether creating government liabilities without Congressional appropriation is even Constitutional. The fact is that the Fed can’t simply “print money” to make itself whole. Instead, the Fed will likely retain the interest it receives on its Treasury holdings, for years, and years, rather than returning it to the Treasury for public benefit – at least once it stops paying all that interest and more to banks as interest on reserve balances. Nobel Prize indeed.
If you want to give a Nobel Prize for ending the global financial crisis, give it to the Financial Accounting Standards Board (FASB), which suspended FAS-157 mark-to-market accounting in March 2009 – rediscovering Charles Ponzi’s principle that they don’t care you’re insolvent if they don’t see you’re insolvent.
All of this, unfortunately, is what relentless yield-seeking speculation has created for investors, not only in the U.S., but every country that followed Ben Bernanke’s deranged zero-interest rate lead. In the effort to avoid the discomfort of holding zero-interest rate hot potatoes (which investors had to choke down in the stunning amount of 36% of GDP at the beginning of 2022), investors drove stocks and bonds to valuations that also implied zero or even negative future returns. The real monetary “policy mistake” occurred years ago, by encouraging a gloriously fragile world of record valuations and dismal future investment returns – a world that relied on permanently depressed interest rates to “justify” those extreme valuations, yet where investors would still suffer poor long-term returns even if the low rates could be sustained. As Ben Graham would say, “the results of such a doctrine could not fail to be tragic.”
Estimating downside market risk
There are three principal phases of a bull market: the first is represented by reviving confidence in the future of business; the second is the response of stock prices to the known improvement in corporate earnings, and the third is the period when speculation is rampant – a period when stocks are advanced on hopes and expectations. There are three principal phases of a bear market: the first represents the abandonment of the hopes upon which stocks were purchased at inflated prices; the second reflects selling due to decreased business and earnings, and the third is caused by distress selling of sound securities, regardless of their value, by those who must find a cash market for at least a portion of their assets.
– Robert Rhea, The Dow Theory, 1932
The “completion” of a market cycle involves the repricing of valuations from rich or extreme levels that imply poor or dismal long-term expected returns – to run-of-the-mill or depressed lows that imply reasonable or outstanding long-term returns. In my view, the market losses that we have observed during 2022 to-date represent what Robert Rhea described in 1932 as the “first principal phase” of such a retreat – “the abandonment of hopes upon which stocks were priced at inflated prices” – in this case, the abandonment of the notion that the Federal Reserve could forever hold interest rates at zero without consequence. We have not yet observed “selling due to decreased business and earnings,” much less “distress selling of sound securities, regardless of their value.”
As I noted in March 2001 – after a -23% loss in the S&P 500, which would be followed by a further market collapse over the next 18 months, and more than a decade of S&P 500 total returns below T-bill yields – “They’re looking at how far prices have declined, and have decided that this must be enough. But unless they understand value, they do not realize how much lower prices would have to decline just to attain median historical valuations. Value is not measured by how far prices have declined, but by the relationship between prices and properly discounted cash flows.”
When the cash flows are very long-term in nature, as they are with 50-year U.K. gilts, or 30-year Treasury bonds, or common stocks, seemingly moderate increases in long-term return can imply profound market losses. When the deviation from median historical valuations is extreme, simply attaining those run-of-the-mill valuation norms can imply seemingly preposterous losses – then the market suffers seemingly preposterous losses anyway.
Over the past 5 years, the revenues of S&P 500 technology companies have grown at a compound annual rate of 12%, while the corresponding stock prices have soared by 56% annually. Over time, price/revenue ratios come back in line. Currently, that would require an 83% plunge in tech stocks (recall the 1969-70 tech massacre). The plunge may be muted to about 65% given several years of revenue growth. If you understand values and market history, you know we’re not joking.
– John P. Hussman, Ph.D., March 7, 2000
Just before, well, an 83% plunge in the tech-heavy Nasdaq 100 Index
The chart below provides some insight into the market loss we estimate would be required to restore even run-of-the-mill historical valuation norms. The blue line in the chart below is based on MarketCap/GVA (see the scatterplot near the top of this comment), showing the market loss necessary to bring expected S&P 500 returns to the higher of a) the 10% long-term historical norm, or; b) a 2% risk-premium over-and-above Treasury bond yields. The red shaded area shows the deepest actual loss of the S&P 500 over the subsequent 30-month period – that shading stops 30 months ago since we don’t yet know the deepest loss for more recent periods.
Notice that the 2000-2002 market loss did not quite restore historical valuation norms. Of course, the S&P 500 also posted a negative total return between its October 2002 low and its March 2009 low. Investors can run from overvaluation – defying it with speculation for extended periods of time – but ultimately, they can’t hide.
You’ll also notice that there’s often quite a bit of white space before the blue troughs become full of red ink. Those white spaces represent potential risk that has not yet been realized. Speculators have certainly enjoyed a great deal of white space in recent years. But it’s exactly that long period of speculation without consequences that makes potential market losses so deep. Seemingly preposterous, even.
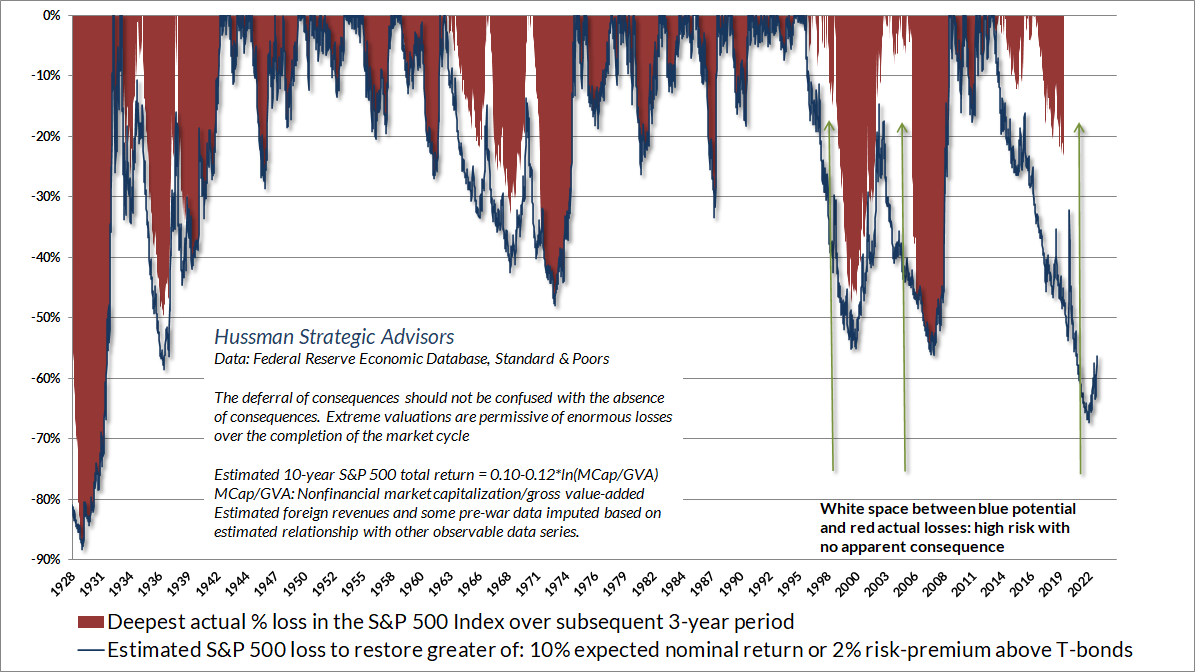
Restoring even historically run-of-the-mill valuations would require a loss of about -67% in the S&P 500 from its recent speculative peak. As I wrote just before the 2000 bubble collapsed, if you understand values and market history, you know we’re not joking.
When the cash flows are very long-term in nature, and the deviation from median historical valuations is extreme, simply attaining those run-of-the-mill valuation norms can imply seemingly preposterous losses. Then the market suffers seemingly preposterous losses anyway.
Returning to Robert Rhea’s 1932 observations, my impression is that year-to-date market losses represent the first phase of unwinding from the steepest speculative extreme in history. I’ve got no particular views about whether this phase is complete. Our own discipline is to respond to observable market conditions – primarily valuations and market internals – and to shift our investment stance as those conditions shift. No forecasts are required.
That said, I do believe that the second phase of this unwinding is likely to accompany an avalanche of earnings disappointments in the quarters ahead. We should certainly expect periods of market loss to be punctuated by clearing rallies, even extended ones, that are “fast, furious, and prone-to-failure.” Broad improvement in the uniformity of market internals could even support more extended periods of speculation. Still, valuations are nowhere near levels that we associate with satisfactory long-term market returns, so I suspect that more shoes will drop. In any event, we’ll respond to observable conditions as those conditions change.
Keeping monetary policy in context
Valuations are the most reliable gauge of long-term market returns, as well as potential losses over the completion of any given market cycle. Our best measures have a correlation of about 0.9 with subsequent 10-12 year S&P 500 total returns. Yet valuations often have little to do with market outcomes over shorter segments of the market cycle. If overvaluation alone was enough to stop a market advance, it would be impossible for the market to reach the obscene levels of hypervaluation we observed in 1929, 2000, and early this year.
Over shorter segments of the market cycle, market fluctuations are heavily affected by investor psychology – which we infer from market action. When investors are inclined to speculate, they tend to be indiscriminate about it. Since 1998, our most reliable gauge of speculation versus risk-aversion has been the uniformity or divergence of market internals across thousands of securities, industries, sectors, and security-types, including debt securities of varying creditworthiness.
– John P. Hussman, Ph.D., Are We There Yet? , July 7, 2022
In our evaluation of market conditions, it’s useful to consider market conditions from the standpoint of multiple time horizons. Expected long-term returns and potential full-cycle losses are driven most strongly by valuations. On the intermediate term, market internals are the most important gauge of speculative versus risk-averse investor psychology. Over the short-term, we also attend to the extent to which market action is overextended based on various combinations of valuations, price behavior, and investor sentiment. Even in recent months, when market losses have produced somewhat “oversold” price action and bearish sentiment, we’ve been willing to vary the extent of our defensiveness. The main challenge is that with both valuations and market internals still unfavorable, the potential return versus potential risk of an outright constructive position is still quite limited. That will eventually change.
If you learn anything from our difficulty amid zero-interest rate policy, it should be that even the most extremely overextended “limits” should take second place to the condition of market internals, particularly when monetary policy and internals are in alignment.
Amid zero-interest rate policy and favorable market internals, it proved detrimental to respond bearishly to any historically reliable “limit” to speculation.
Now, amid aggressive Fed tightening and unfavorable market internals, overly aggressive dip-buying may prove equally detrimental. Even as valuations retreat, it will be useful to retain a safety net – even if only to cover tail-risk – while market internals remain unfavorable.
Attending to market internals will be particularly important once the Federal Reserve eventually “pivots” to easing. Critically, Fed easing “works” by creating low-interest liquidity that investors view as “inferior” to risky assets. That doesn’t work at all in periods when investors are risk-averse, which is how bear markets can unfold with the Fed easing the whole way down. Recall that the Fed began easing cycles in July 1981, June 1989, January 2001, and September 2007. Yet easy money coincided with the 1981-82, 1990, 2000-2002 and 2007-2009 bear markets.
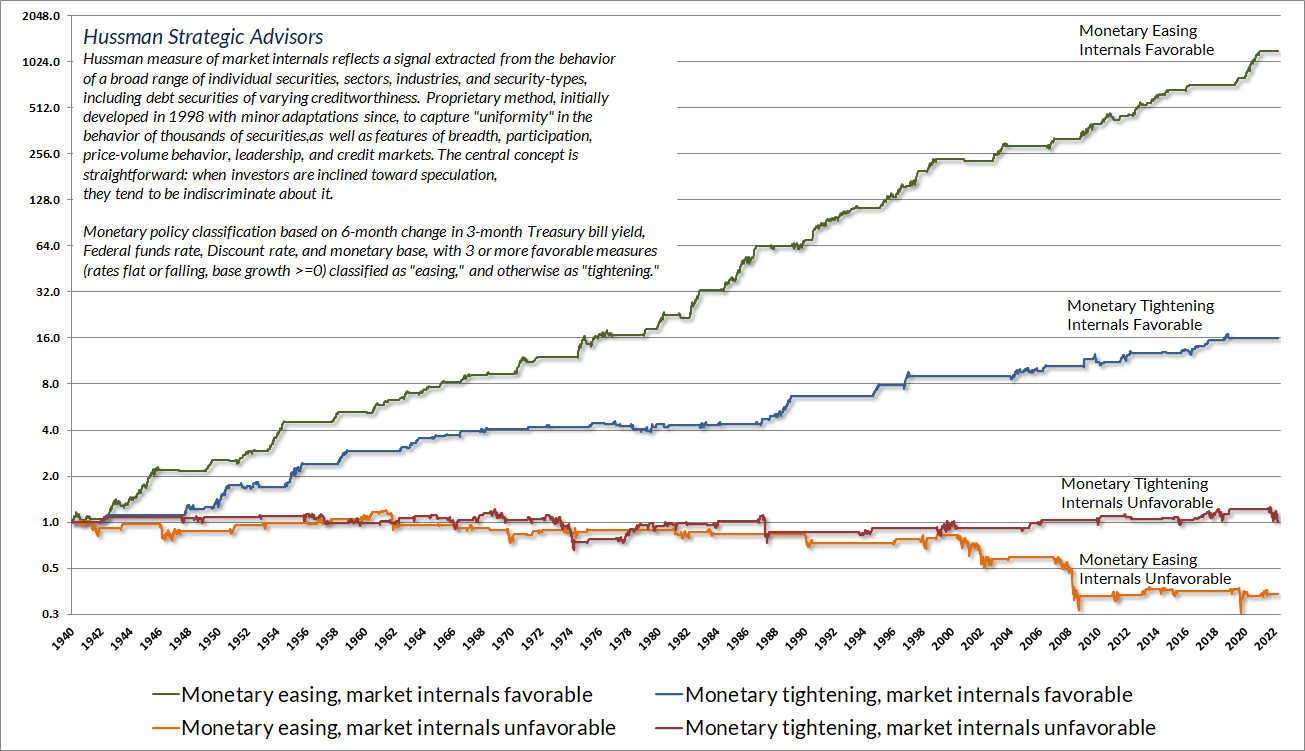
The chart below is a reminder that Fed easing, in and of itself, is insufficient to support stocks if investors are inclined toward risk-aversion. Likewise, Fed tightening, which often begins during the later part of bull markets, is insufficient to drive stocks lower if investors remain inclined to speculate. We find that the best way to gauge investor psychology is through the uniformity or divergence of market internals (what I called “trend uniformity” when I introduced this gauge to our discipline in 1998).
The chart shows the cumulative total return of the S&P 500 across four mutually exclusive combinations of monetary policy and market internals. If you’re waiting for a “Fed pivot” to tell you the coast is clear for stocks, you’re quietly relying on the assumption that Fed easing is sufficient to shift investor psychology from risk-aversion to speculation. That was certainly not the case in 2000-02 and 2007-09. Historically, we find that Fed pivots have a correlation of only about 0.2 with favorable shifts in market internals. The highest correlation is at the zero lag (contemporaneous), but that relationship is weak and unreliable. It’s best to respond directly to observable improvement in market internals.
The information contained in earnings, balance sheets, and economic releases is only a fraction of what is known by others. The action of prices and trading volume reveals other important information that traders are willing to back with real money. This is why trend uniformity is so crucial to our Market Climate approach. Historically, when trend uniformity has been positive, stocks have generally ignored overvaluation, no matter how extreme. When the market loses that uniformity, valuations often matter suddenly and with a vengeance. This is a lesson best learned before a crash rather than after one.
– John P. Hussman, Ph.D., October 3, 2000
One of the best indications of the speculative willingness of investors is the ‘uniformity’ of positive market action across a broad range of internals. Probably the most important aspect of last week’s decline was the decisive negative shift in these measures. Since early October of last year, I have at least generally been able to say in these weekly comments that “market action is favorable on the basis of price trends and other market internals.” Now, it also happens that once the market reaches overvalued, overbought and overbullish conditions, stocks have historically lagged Treasury bills, on average, even when those internals have been positive (a fact which kept us hedged). Still, the favorable market internals did tell us that investors were still willing to speculate, however abruptly that willingness might end. Evidently, it just ended, and the reversal is broad-based.
– John P. Hussman, Ph.D., July 30, 2007
Far from a pivot
Probably the most persistent topic on financial television is speculation about when the Federal Reserve will “pivot” to easy monetary policy. Fed easing only reliably supports stocks if investors are inclined to speculate, but we can certainly allow for the possibility that a Fed easing would be accompanied by improvement in the uniformity of market internals. Even so, my view is that we are nowhere near a Fed pivot.
Hopes for a near-term Fed pivot seem rooted in recency bias. A long period of low inflation and labor market slack gave the Fed latitude to pound on the monetary accelerator for more than a decade. Those conditions are gone. Inflation in Federal Reserve’s preferred measure – the core PCE (personal consumption expenditures) deflator – is currently running at 4.9%. Meanwhile, the U.S. unemployment rate is presently just 3.5%.
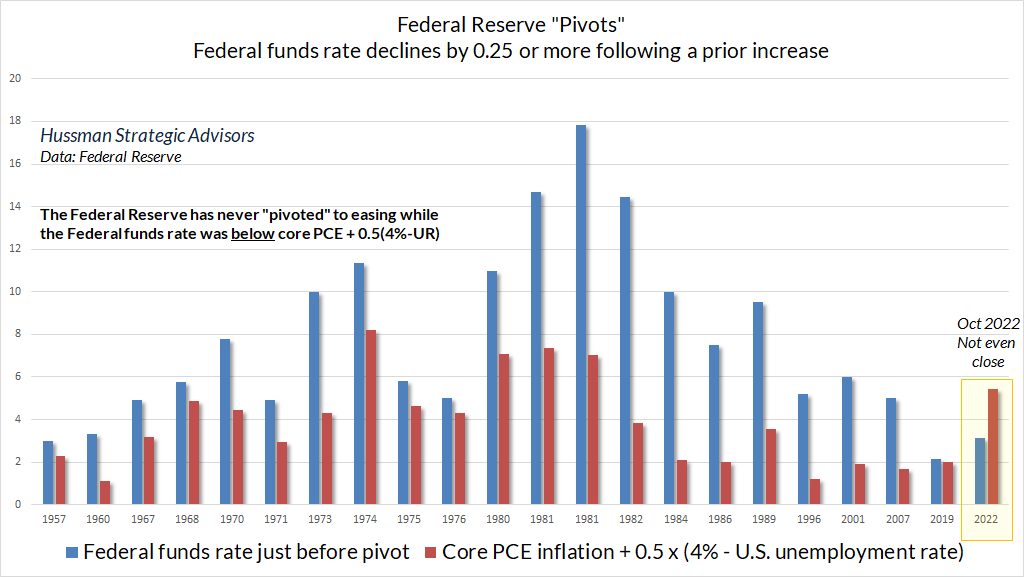
To place these figures in context, it’s useful to recognize that the Fed has only pivoted twice – 1975 and 1976 – with the Federal Funds rate below core PCE inflation. In both cases, the unemployment rate was over 7.5%, and even then, both pivots were short-lived.
Indeed, we can use PCE inflation and the unemployment rate to define something of a “lower bound” for the Federal Funds rate: core PCE inflation + 0.5 x (4% – unemployment). Essentially, an unemployment rate less than 4% has led the Federal Reserve to set the Fed Funds rate no lower than PCE inflation. Only when unemployment has been above 4% has the Fed been willing to cut Fed Funds below the inflation rate.
The chart below shows every “Fed pivot” since 1960, defined here as a decline in the Fed Funds rate of 0.25% or more following a prior increase. What’s notable is that the Fed has never “pivoted” to easing while the Fed Funds rate was below core PCE + 0.5 x (4% – unemployment). The current Fed Funds rate isn’t even close to reaching that threshold, which is currently at 4.9% + 0.5 x (4% – 3.5%) = 5.2%. The chart below also shows the Fed Funds rate implied by the Taylor Rule, a benchmark of systematic monetary policy introduced by Stanford economist (and one of my early mentors) John Taylor.
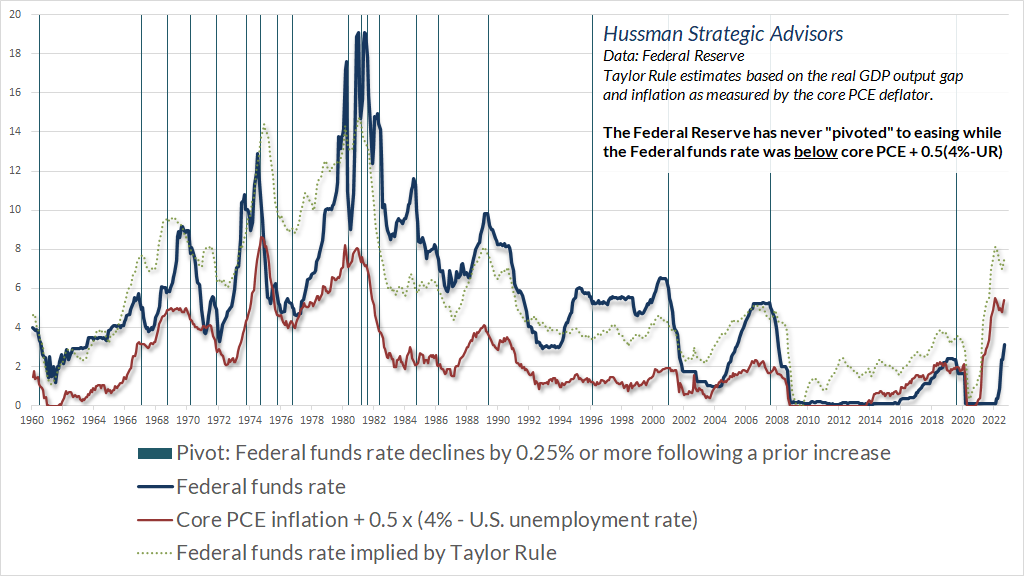
The chart below shows every Fed pivot since 1960, comparing the Fed Funds rate immediately before the pivot with the threshold defined above. We can’t rule out any action by the Fed, but from the standpoint of historical and even recent Fed behavior, the current Fed Funds rate is not even close to the level at which a pivot to lower rates would be minimally reasonable. That will change as the data for inflation and unemployment change. These measures are really what investors should attend to, if they are interested in being realistic.
That’s the part of the playbook that we’re in – when central banks are aggressively trying to attack inflation globally. Assuming they follow through, which is to bring inflation back to a reasonable level, you unequivocally want to favor cash. It’s so hard to take what we’ve learned from investing for the past 12 years and put it behind you, but you really have to. The market changes. It’s a completely different environment we’re in right now. All of a sudden, for the first time in 13 years, we’ve got a really attractive short-term rate.
Paul Tudor Jones, October 10, 2022, CNBC
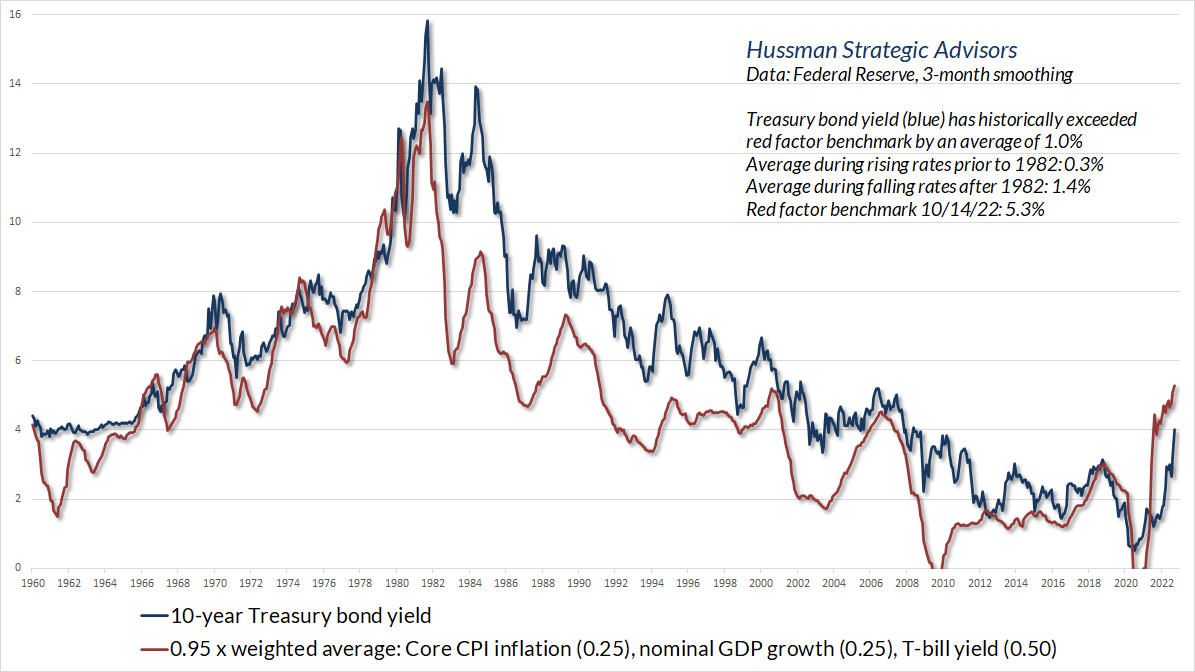
We can construct a similar threshold for the 10-year Treasury yield. Notably, the entire historical total return of 10-year bonds, in excess of T-bills, has accrued when bond yields have exceeded the average of core CPI inflation, nominal GDP growth, and T-bill yields. Indeed, 95% of that average has typically acted as something of a lower bound. Again, that level will change as inflation, GDP growth, and T-bill yields change, so it should be viewed as a lower “benchmark” implied by economic conditions, rather than a “forecast” for bond yields. Still, given that current, observable economic conditions are historically consistent with a 10-year Treasury bond yield of at least 5.3%, the potential for continued upward yield pressure shouldn’t be ruled out.
The bottom line depends on your investment horizon. From a short-term perspective, we should certainly expect periods of market loss to be punctuated by clearing rallies that are “fast, furious, and prone-to-failure.” We periodically reduce the extent of our defensiveness when the market becomes particularly oversold, but we’re not inclined to take outright bullish positions in an overvalued market with still-unfavorable internals. Broad improvement in the uniformity of market internals could signal fresh speculation, but we’ll respond to that sort of shift when we observe it. No scenarios or forecasts are required. From the standpoint of long-term returns and potential full-cycle losses, valuations are nowhere near levels that we associate with satisfactory outcomes.
Our most reliable equity market valuation measures project 10-12 year S&P 500 total returns near zero, implying that the “equity risk premium” relative to bonds is still negative. Likewise, bond yields remain inadequate relative to prevailing inflation, employment, and economic conditions. Meanwhile, market internals continue to suggest persistent risk-aversion among investors, and yield pressures – at least for now – remain upward. Taking these conditions together, it’s worth repeating that a market collapse is nothing but risk-aversion meeting an inadequate risk-premium; rising yield pressure meeting an inadequate yield. Short-term volatility and clearing rallies aside, our outlook remains defensive here.
Keep Me Informed
Please enter your email address to be notified of new content, including market commentary and special updates.
Thank you for your interest in the Hussman Funds.
100% Spam-free. No list sharing. No solicitations. Opt-out anytime with one click.
By submitting this form, you consent to receive news and commentary, at no cost, from Hussman Strategic Advisors, News & Commentary, Cincinnati OH, 45246. https://www.hussmanfunds.com. You can revoke your consent to receive emails at any time by clicking the unsubscribe link at the bottom of every email. Emails are serviced by Constant Contact.
The foregoing comments represent the general investment analysis and economic views of the Advisor, and are provided solely for the purpose of information, instruction and discourse.
Prospectuses for the Hussman Strategic Growth Fund, the Hussman Strategic Total Return Fund, the Hussman Strategic International Fund, and the Hussman Strategic Allocation Fund, as well as Fund reports and other information, are available by clicking “The Funds” menu button from any page of this website.
Estimates of prospective return and risk for equities, bonds, and other financial markets are forward-looking statements based the analysis and reasonable beliefs of Hussman Strategic Advisors. They are not a guarantee of future performance, and are not indicative of the prospective returns of any of the Hussman Funds. Actual returns may differ substantially from the estimates provided. Estimates of prospective long-term returns for the S&P 500 reflect our standard valuation methodology, focusing on the relationship between current market prices and earnings, dividends and other fundamentals, adjusted for variability over the economic cycle. Further details relating to MarketCap/GVA (the ratio of nonfinancial market capitalization to gross-value added, including estimated foreign revenues) and our Margin-Adjusted P/E (MAPE) can be found in the Market Comment Archive under the Knowledge Center tab of this website. MarketCap/GVA: Hussman 05/18/15. MAPE: Hussman 05/05/14, Hussman 09/04/17.