

Causes and Conditions


John P. Hussman, Ph.D.
President, Hussman Investment Trust
April 2026
Price is what you pay. Value is what you get.
– Benjamin Graham, as related by Warren Buffett
The defining feature of a Ponzi scheme is that it persuades investors to pay for future cash flows that, at least in part, don’t actually exist, while creating the impression that those cash flows imply an attractive return on the price investors pay.
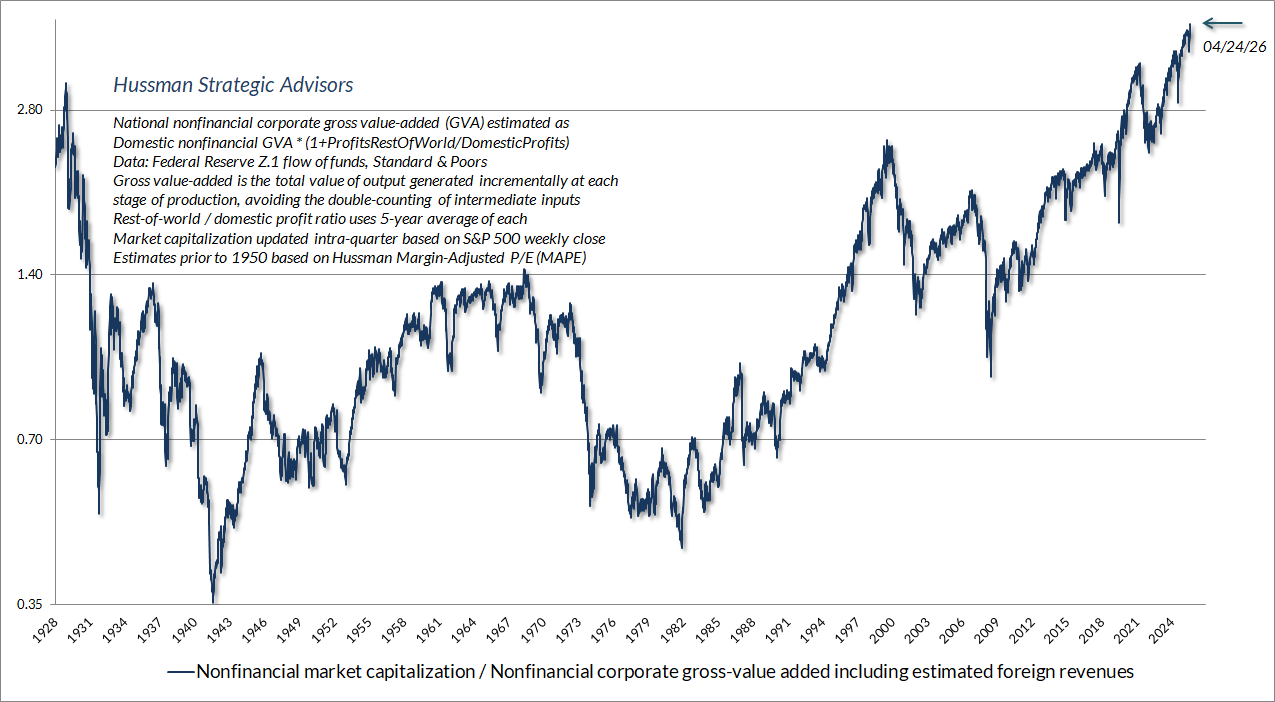
At present, our most reliable valuation measure (based on correlation with actual subsequent S&P 500 total returns over a century of market cycles) stands at the highest extreme in history. The chart below shows this measure in data since 1928: the ratio of nonfinancial market capitalization to gross value-added (MarketCap/GVA). Gross value-added is the sum of corporate revenues generated incrementally at each stage of production, so MarketCap/GVA might be reasonably be viewed as an economy-wide, apples-to-apples price/revenue multiple for U.S. nonfinancial corporations.
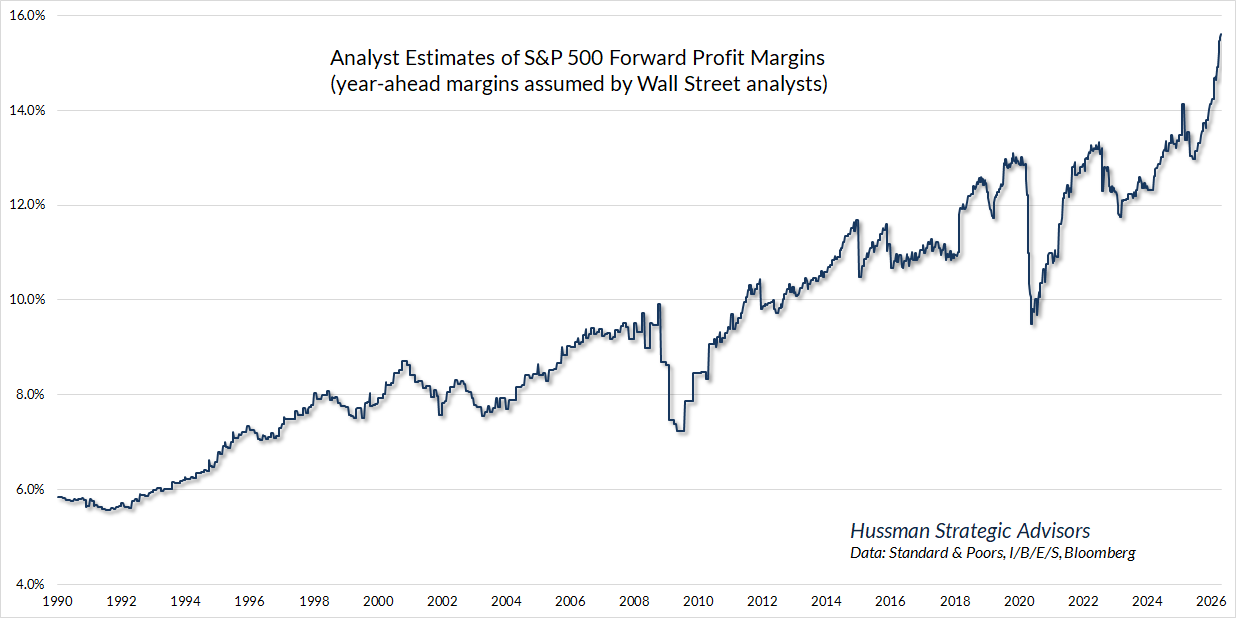
Meanwhile, Wall Street analysts currently assume year-ahead S&P 500 profit margins that are also easily the most extreme in history. The chart below gives a breathtaking view of how wildly optimistic these expectations have become (h/t Bill Hester).
The sudden ramp higher in these profit expectations has easily been our most frustrating headwind in recent weeks. Though the hedging component of our discipline required a great deal of adaptation during this bubble (detailed below), our stock selection discipline has cleanly outperformed the S&P 500 across decades of market cycles. Still, the near 20% spike in the tech-heavy Nasdaq 100 in recent weeks far outpaced the broad pool of stocks from which our investments are drawn. The equal-weighted S&P 500, for example, has lagged the NDX by 11.5% since March 30. Gaps like that tend to be short-lived episodes driven by fear-of-missing-out, but they’re never enjoyable for diversified hedged equity approaches.
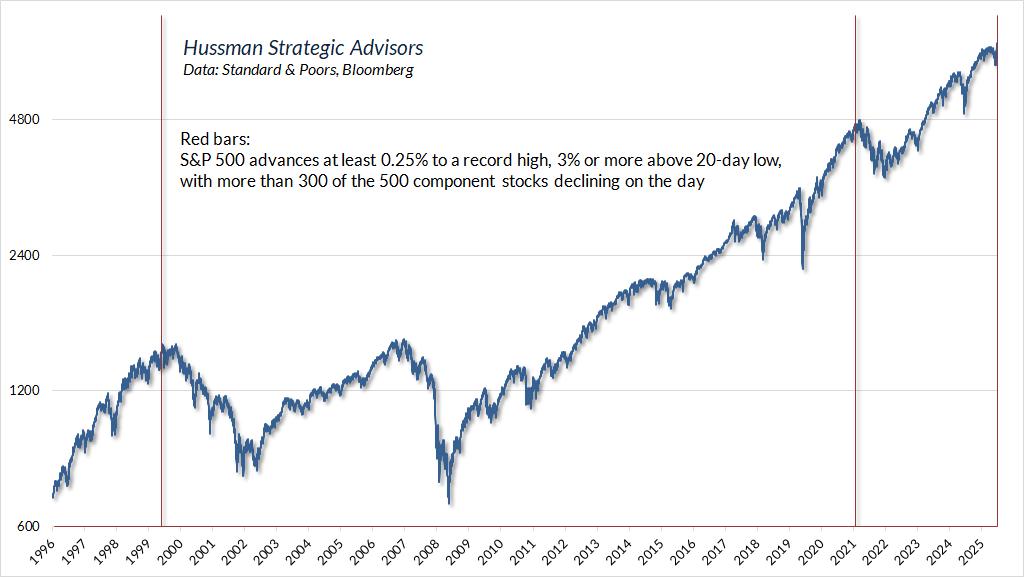
On Friday, April 24 my friend Jesse Felder observed “The S&P 500 Index is up about 0.75% to a new 52-week high, while more than 300 of its components are declining. This has never happened before. If we loosen the rate of advance a bit, though, we find that back on March 22, 2000 the index rose 0.45%, while at least 300 components fell.” The same two instances emerge if one examines points where the S&P 500 advanced even 0.25% to a record high at least 3% above its 20-day low, on similarly negative breadth. On those criteria, there’s one additional instance on November 18, 2021. As I observed at that time:
To be clear, none of this – none of it – imposes a limit on this bubble, or implies that it cannot become more extreme. The point of this special update is that there are certain features of valuation, investor psychology, and price behavior that emerge, to one degree or another, when the fear of missing out becomes particularly extreme and the focus of speculation becomes particularly narrow. We’ve suddenly hit a motherlode of those conditions. Emphatically, this is not a forecast. It’s a statement about current, observable conditions.
-John P. Hussman, Ph.D., Motherlode, November 20, 2021
On the valuation front, consider what the unprecedented expectations for forward profit margins mean for price/earnings multiples. Every valuation multiple, at its core, is just shorthand for a proper discounted cash flow analysis. One can take the multiple of price to X as a useful valuation multiple only if one believes that the denominator X is representative and proportional to the very, very long-term stream of cash flows that the security will deliver into the hands of investors for decades and decades to come. When investors look at a price/earnings multiple based on earnings driven by extreme and unprecedented profit margins, they can only take that P/E multiple at face value if they assume that the elevated profit margins will be permanent.
Though “forward earnings” only came into widespread use on Wall Street in the 1990’s – and data doesn’t even exist prior to the 1980’s – the forward P/E is correlated strongly enough with the (scaled) Shiller cyclically-adjusted P/E (CAPE) that we can reasonably infer its very long-term historical record. On that basis, even taking current record profit margins at face value, and assuming they are permanent, the S&P 500 presently trades at multiples that rival both the 1929 and 2000 peaks. The resulting price/forward earnings multiple, even in data since 1990, implies 10-year S&P 500 total returns well below Treasury bill yields. For numerous charts and data, see How the Bubble Manipulates Time.
Amid enthusiasm about AI, fear of missing out, and the confidence of investors that every dip below a record high is a dip to be chased, investors have been persuaded to pay for future cash flows that, to a large extent, are unlikely to exist, while believing that these cash flows imply an attractive return on the price investors pay.
With respect to investor risk-tolerance, we continue to observe divergence across market internals that’s consistent with fragile investor psychology, creating a base of conditions that leave record-low risk-premiums vulnerable to potentially abrupt upward revision. As I’ve observed across decades of market cycles, a market collapse is nothing more than risk-aversion meeting a market that’s not priced to tolerate risk.
No forecasts are required
Despite record valuations, and in my view, wildly over-optimistic analyst expectations for profit margins, we should be emphatically clear: our concerns about valuations do not imply any forecast for near-term market behavior. If there’s one thing that I hope investors have drawn from my market comments – particularly over the past two years – it’s that nothing in our investment discipline relies on any future retreat in market valuations, nor any end to the current speculative bubble.
Let me say that again. If the bubble continues forever, that will be just fine with us. We do prefer a certain amount of market fluctuation to a diagonal advance, but beyond that, we have no preferences at all about market direction. Now, my opinion remains that this bubble will go down in a ball of flames, but if it doesn’t, we don’t care because nothing in our discipline requires us to care. I’ll discuss this point in much greater detail later in this comment.
Understanding record profit margins
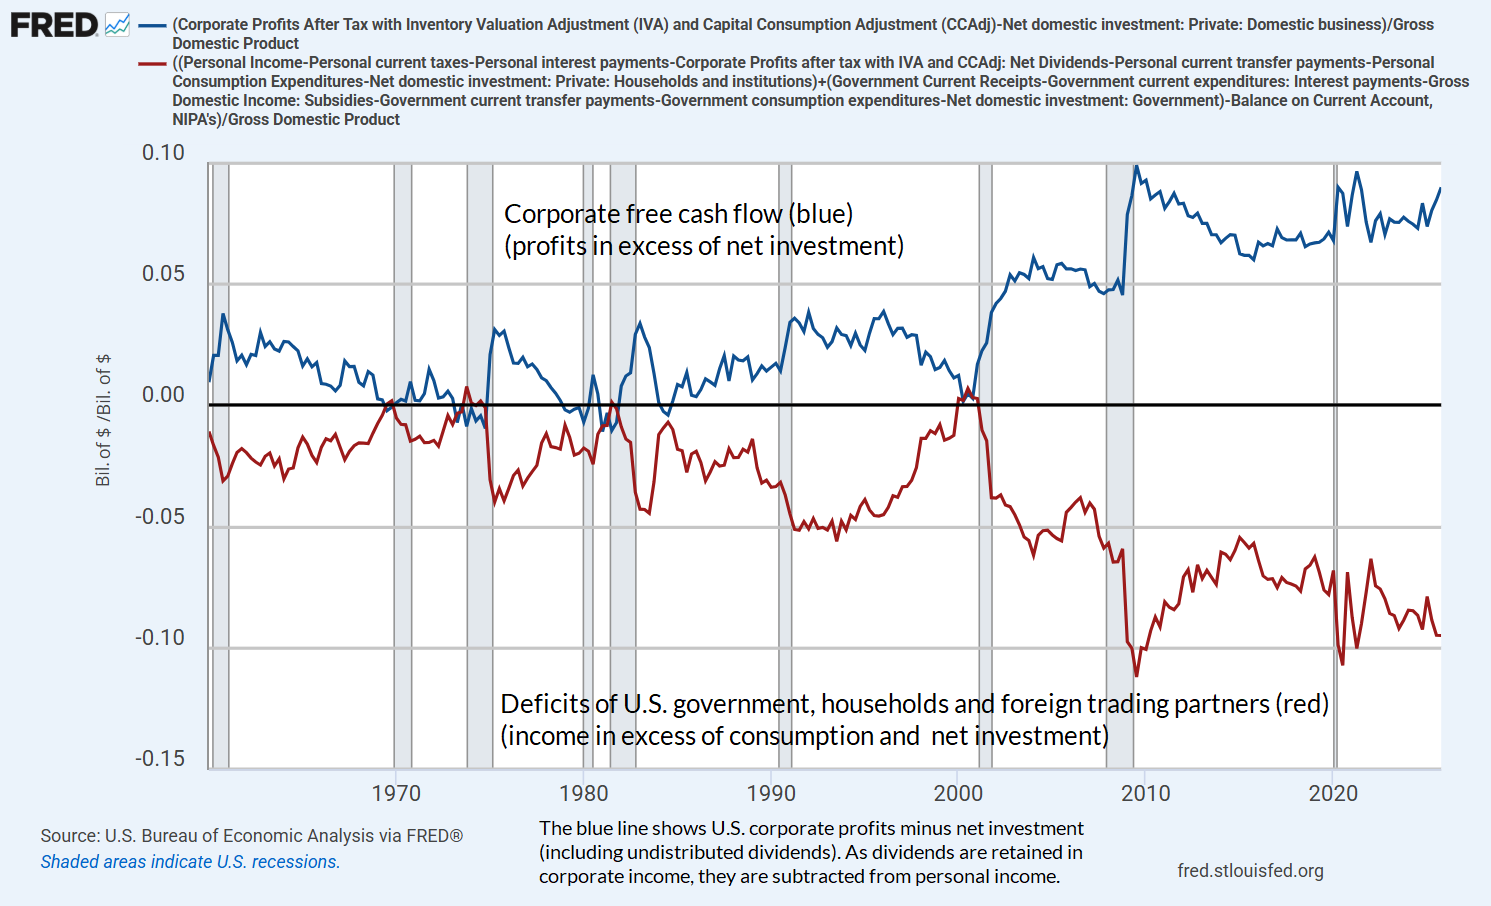
My impression is that Wall Street analysts have adapted to the rising profit margins of recent years by assuming that this diagonal trajectory is simply a new “structural” feature of corporate earnings. In fact, however, the elevated level of corporate profits actually has a clear and economically rigid structure: they are the exact mirror image of record deficits in the government and household sectors. This isn’t a theory, it’s an accounting identity. The chart below shows how this equilibrium works.
Now, it’s clear that a combination of offshore labor, just-in-time manufacturing, improved inventory management, and technological improvement has enhanced the ability of companies to generate growing revenues even as the wages and salaries of American families have fallen to a record low share of GDP. But it’s striking that over the past 25 years, real U.S. GDP growth has proceeded at the slowest compound annual rate in the history of the country.
The fact is that in recent decades, technology hasn’t contributed to broad economic growth. Productivity growth was much higher between 1950 and 2000 than it has been since then. Rather, even innovation has provided new, useful products that have changed in our way of life, the financial impact of technology has been primarily to widen income disparities. As households have become less and less capable of meeting their spending, retirement and health-care needs without government support to bridge the gap, the top 10% (who also own about 87% of corporate equities) essentially finance those shortfalls by accumulating new debt obligations issued by government and households. That’s how this whole house of cards remains standing.
It’s a bit naïve, if one is wealthy, to complain about government transfer payments and exploding government debt – because it’s precisely those payments that directly translate into corporate revenues and record profits. If the transfer payments were fall sharply, so would aggregate spending, revenues, and profits in the economy. It’s an equilibrium.
If we allow for the possibility that the U.S. will eventually move back to fiscal stability, it follows that corporate profit margins will also retreat from their current extremes. If we assume instead that we will remain in an equilibrium where the top 10% progressively accumulate the liabilities of government and households without limit – in order to preserve the current structure of taxes, corporate profits, and wage/salary shortfalls – the natural outcome will eventually be debt or inflation crises. But those crises may be far into the future. That’s the magic of a Ponzi scheme – everything works fine as long as nobody questions that the future cash flows are a-comin’.
The government debts required to bridge the gap between household incomes and household expenditures are largely a reflection of lopsided expansion in profits and financial gains relative to wages and salaries in recent decades, and much of this reflects the vastly preferential tax treatment of one versus the other. We have deficit problems for the government, and solvency issues in Social Security and Medicaid, largely because we aren’t actually willing to tax a dollar of income as a dollar of income.
Meanwhile, in a world where an enormous amount of corporate profit derives from network effects, hyperscale, and “rents” (exploitation of prior innovation that generates income without the need for additional employment or real investment), it may be worthwhile to rethink the way that corporate profits themselves are taxed.
Suppose a company develops a software platform that becomes something of a “hub” for other users. I use it because you use it. You use it because I use it. Because of those network effects, the platform becomes something of a “black hole” that draws in an increasing user base. The company’s revenue skyrockets while the basic innovation and workload (other than the number of servers) remains largely the same. This is what economists would describe as a “rent.” In a traditional business, like a bakery, doubling your customers would force you to hire more bakers, install new ovens, and buy more flour – expansion of the business is largely equivalent to expansion in real investment and employment. But for many giant companies today, the extra billions they rake in are “economic rents” – surplus income they collect because they own a digital space that distributes information and enjoys network effects that are largely created by the public itself.
In my view, a more reasonable corporate tax structure would be to apply corporate taxes to gross value added (revenues less intermediate inputs) minus a generous normal return allowance (r x Capital Base) on the company’s stock of real investment and R&D, minus an allowance for labor compensation (up to some fixed amount like $150,000 per employee). It’s simple math, but in this way, you incentivize real investment, R&D, and employment, but you tax the surplus “dominance rents.” Meanwhile, any regressive impact of a value-added tax can (and typically is) reduced by providing an exemption from income taxes on some initial amount. Similarly, support at lower incomes is provided by earned income tax credits, and a basic social safety net.
Causes and conditions
When conditions are sufficient, things manifest in a particular way. When conditions are no longer sufficient, things no longer manifest in that way. They wait until the moment is right for them to manifest again.
– Thich Nhat Hanh
A week ago, my son JP and I planted seeds in the raised garden in our backyard. JP is 32, with autism, and gets a lot of joy from nature, and how things change over the seasons. Looking at the tiny seeds in our hands, the soil, the sun, the clouds, one could already see the whole garden there – all that was needed was for all of those causes and conditions to come together. Even a week later, the sprouts are already manifesting.
If we look carefully at the record valuation extremes in the equity market, and the wildly elevated profit margins that investors appear to view as permanent, we can already see the potential for difficult, even tragic outcomes for investors. Thus far, conditions have not been sufficient for those outcomes. Unlike other market cycles that devolved from lesser extremes, this cycle included a long period of zero interest rates, which encouraged investors to believe that no price was too high for assets that had the hope of returns any higher than zero. The cycle included the deepest deficits in history across the household and government sectors, which have their mirror image in record profits that investors have assumed to be permanent. The introduction of artificial intelligence, and the associated race to build capacity, has further deferred and offset the causes and conditions that, in prior market cycles, would long ago have contributed to a collapse.
We’ve adapted the implementation of our discipline in recent years, to the point where nothing in our discipline requires a retreat in valuations. That doesn’t mean leaving ourselves vulnerable to that sort of outcome, but it does mean that we’ve found ways – as I detailed in February – to embrace even a perpetually expanding bubble, without discrimination. I’ll review those adaptations in the next section.
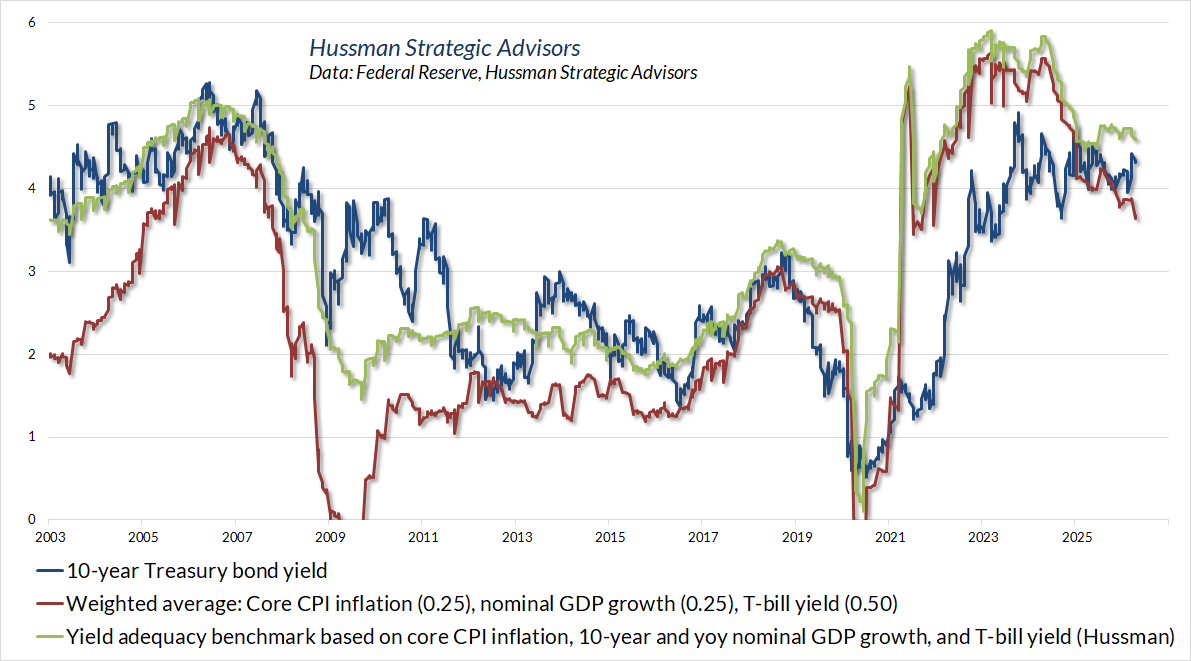
The situation has been easier in the bond and precious metals markets, where we’ve continued to have a 5-Star investment record. For bonds, the primary driver of expected return is, not surprisingly, the adequacy of yields themselves. The chart below shows where the 10-year Treasury yield stands relative to simple benchmarks that we often use to illustrate yield adequacy. Our actual bond market discipline has much broader elements, but yield adequacy is a central consideration. Presently, bond yields remain marginally acceptable, but we still classify them as “inadequate” relative to our benchmarks.
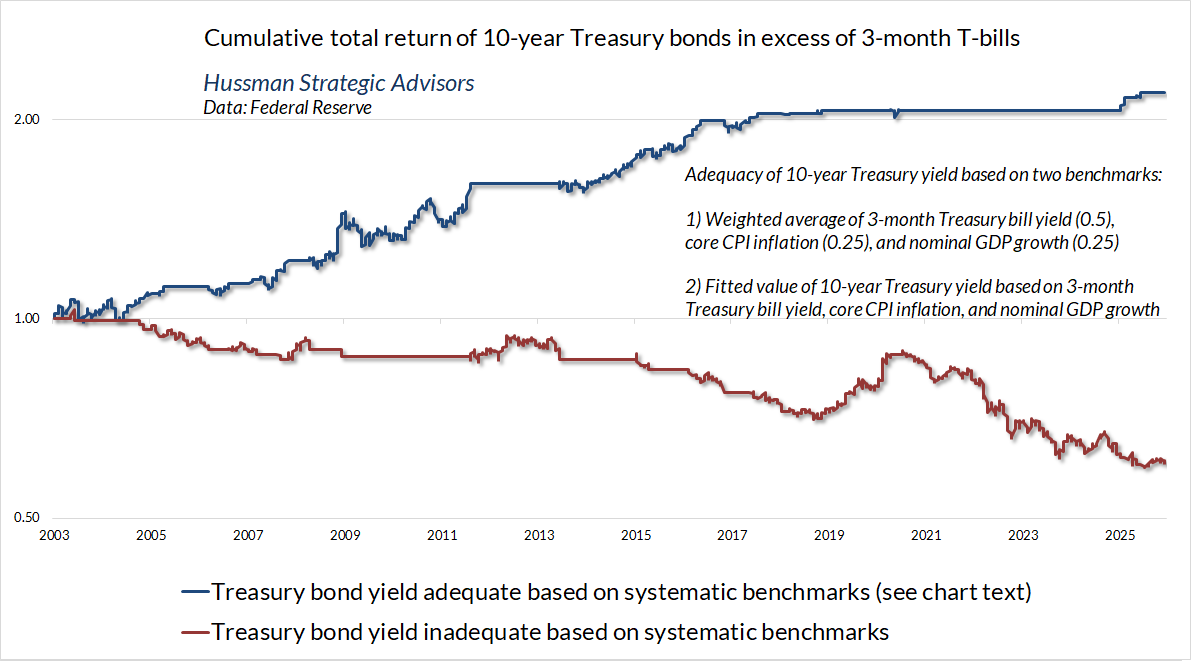
The chart below shows why yield adequacy matters. The entire total return of Treasury bonds in excess of Treasury bills has accrued in periods when bond yields have been adequate even on these simple benchmarks. That’s been true not only in recent decades, but across the entirety of U.S. financial history.
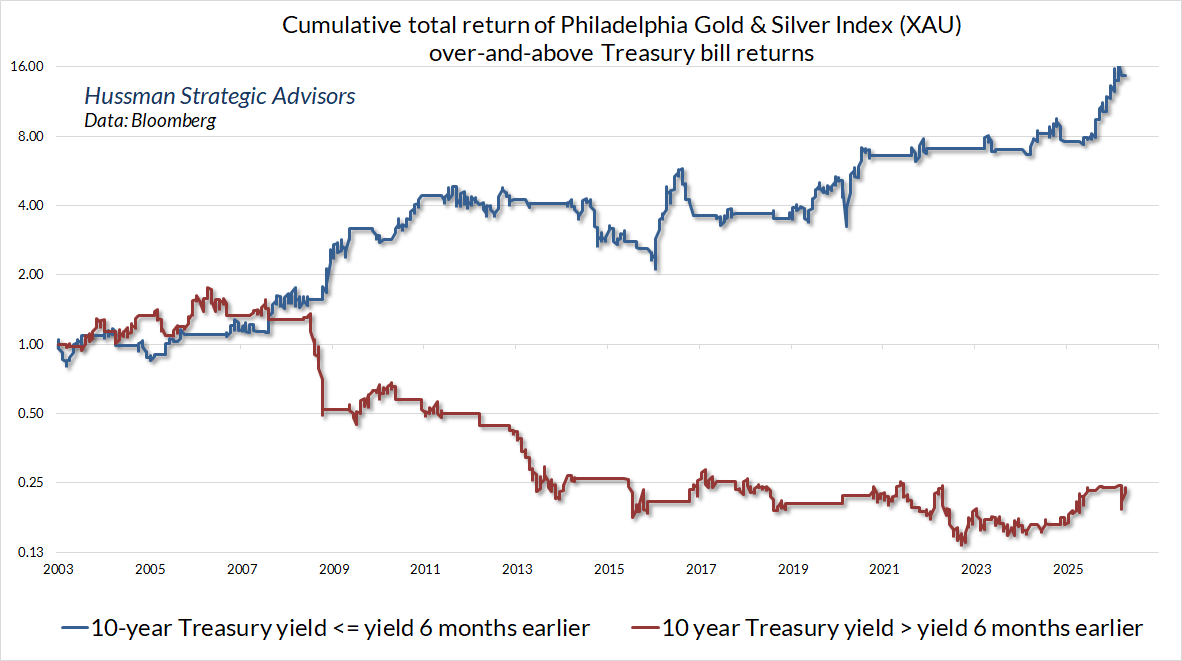
In precious metals stocks, the basic causes and conditions of favorable performance center primarily on factors that place upward or downward pressure on real interest rates. Other considerations are important, including valuations and economic conditions, but one of the simplest features that distinguishes favorable versus unfavorable outcomes for the Philadelphia Gold & Silver Index (XAU) is simply whether the 10-year Treasury yield is above or below its level of 6-months earlier. That simple factor has a lot of impact on the exchange value of the U.S. dollar, and in turn, on the pressures in the precious metals market. While this condition certainly isn’t an investment approach in itself, it’s a useful element of the “causes and conditions” that we include in our discipline.
In the stock market, we’ve had considerable challenges during this bubble, because the features that typically have come together in prior market cycles to drive valuations lower haven’t been sufficient. As a result, we’ve progressively adapted the implementation of our discipline in ways that rely less and less on a market retreat. In February, we finally reached the point where we don’t have any need at all for a retreat in valuations, now or at any time in the future. Even ordinary market fluctuation within a permanently advancing uptrend should be enough to serve us well. I don’t believe a permanent bubble is likely, but we can fully embrace even that prospect.
On that point, it’s important to understand exactly how we altered our hedging implementation in September 2024, and more fully in February of this year.
Recall that prior to 2024, the central focus of our investment adaptations was on periods when our key gauge of market internals was favorable – increasing the frequency that we could be constructive even if valuations were extreme. By contrast, in late-2024, we changed our hedging implementation to vary the intensity of our bearish outlook even amid the most aggressively negative market conditions, when both valuations and market internals are hostile (for a broad discussion, see the section titled “The Martian” in The Turtle and the Pendulum). As a result, we’ve been able to benefit from an advancing market since late-2024, despite persistently extreme valuations and persistently divergent market internals – in a speculative bubble at record highs. That alone has been helpful, but it wasn’t quite enough to give us the expectation of significant “upside capture” in the event of a never-ending bubble.
In February, we extended that implementation to capture not only opportunities to vary the intensity of our downside hedges, but opportunities to adopt a constructive stance, albeit with a safety net, even in conditions that we’ve labeled as bearish “garbage”. For a full discussion, including some of the considerations that help to distinguish these periods, see How I Learned To Love the Bubble (Even Before it Bursts).
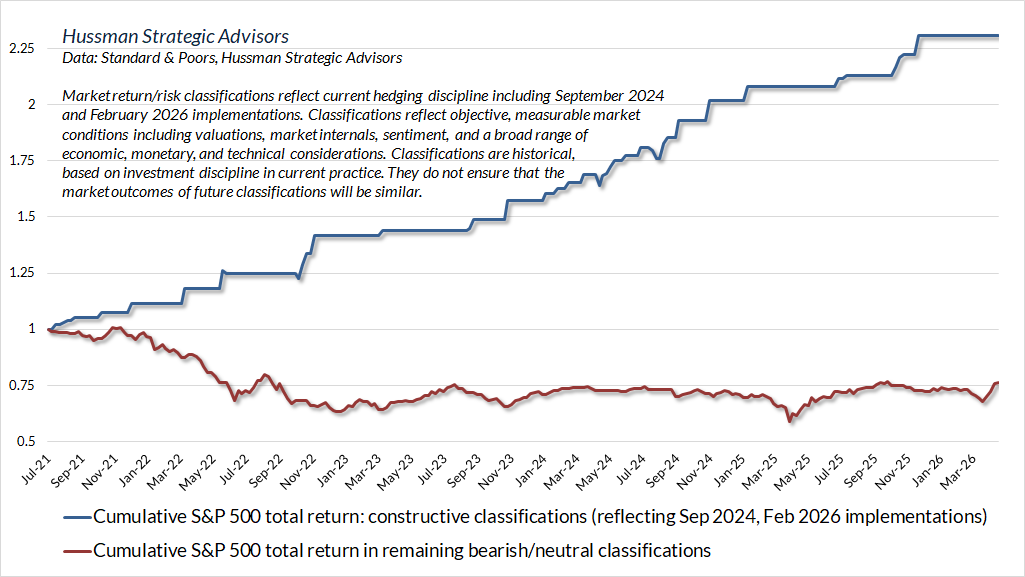
The chart below shows the cumulative total return of the S&P 500 in periods that our present methods classify as constructive, versus the cumulative total return in periods that our present methods classify as neutral or defensive, in data since July 2021. While the entire period has been characterized by historically elevated valuations and divergent market internals, our present methods identify about 15% of weekly periods here as constructive. The “causes and conditions” that distinguish these outcomes include a broad variety of other factors – but the key insight in February, frankly, was the decision to look at the bubble with the eyes of nondiscrimination – accepting the capacity for “roses” to flourish even in conditions that a century of history convinced us were bearish “garbage.” I hope you’ll read those sections from the February comment again, because that that same insight can be helpful in nearly every situation we encounter in life.
The defining feature of a Ponzi scheme is that it persuades investors to pay for future cash flows that, at least in part, don’t actually exist, while creating the impression that those cash flows imply an attractive return on the price investors pay. If we look carefully at the record valuation extremes in the equity market, and the wildly elevated profit margins that investors appear to view as permanent, we can already see the potential for difficult, even tragic outcomes for investors.
Thus far, conditions have not been sufficient for those outcomes. We’ve adapted the implementation of our discipline in recent years, to the point where nothing in our discipline requires a retreat in valuations. That doesn’t mean leaving ourselves vulnerable to that sort of outcome, but it does mean that we’ve found ways to embrace even a perpetually expanding bubble, without discrimination.
The criteria that define these “roses in the garbage” are sensitive to the depth and nature of market pullbacks, the amount of bearish sentiment they reflect (in this case, it’s actually preferable when investors cling to lopsided bullish sentiment amid a market retreat), and the average status of scores of individual models I’ve developed over the past four decades. We haven’t seen any constructive instances since I published that piece in February – we will soon enough – but the instances we classify as constructive in recent years – about 15% periods since mid-2021 – account for the entire total return of the S&P 500 over the past 5 years. Even the handful of 8 constructive weeks since September 2024 comprise an S&P 500 total return of nearly 20%. Going forward, I expect we can be constructive enough, even in a continuing bubble, to be quite happy.
While there’s no assurance that future instances based on these criteria will reward a constructive outlook, the consistency of market gains in these periods suggests a clear benefit in reversing the hedge from mildly bearish to “constructive with a safety net” – removing the “upside cap” on potential returns, while setting a safety net at modestly lower levels. There’s still risk, of course, but that’s why the safety net is there.
Put simply, the February “roses amid garbage” adaptation doesn’t mean shifting to a static bullish outlook, or even removing our downside safety nets. Rather, it involves identifying periodic opportunities (perhaps 15% of the time in current conditions) that we expect to markedly increase our “upside capture” regardless of where we stand in the market cycle.
Whacking the dandelions
This is, because that is
This is not, because that is not
They are like this, because we are like that
They are not like this, because we are not like that– Buddha
Amidst ongoing uncertainties and conflicts, whether with other countries, within our own nation, or elsewhere in our lives, it helps to recognize that – in whatever situation we encounter – nothing exists by itself, alone. Everything has causes and conditions, and there’s rarely only one cause, one thing to credit, one thing to blame.
Everything that grows, whether it’s an apple tree or a bush of thorns, is there because its seeds have been planted, watered, maybe even cultivated. So, the basic practice is to look at the situation and recognize what seeds have been planted, and watered, and to examine how we might cultivate something better.
Try to clear a dandelion field by whacking them with a club, and you’ll only spread the seeds in all directions, into the future. Dandelions tell us the soil is imbalanced, hardened and lacks nutrients. Exterminating the species does nothing to transform the ecosystem. Hatred, violence and war are like that.
It’s easy to believe that hatred is born whole. In truth, where hate exists, it’s because seeds like fear, wrong views, division, injury, and perceptions of injustice have been fed and even cultivated. Throughout history, intelligent, good-natured people have periodically been drawn toward self-serving despots, nationalistic autocrats, and Supreme Leaders, because they promise relief that doesn’t seem available elsewhere. No nation is immune. Even at the edges of war, when we see that hate grows from that kind of seed, cultivated in hardened soil, we see better what to do and not to do – still in ways that are consistent with our own security. We can always begin by refraining from needlessly amplifying suffering, by taking small steps to cultivate this instead of that, before more and more people harden and move toward the extremes.
Even the aspiration to become a nuclear power isn’t born whole. The best way to reduce the number of countries seeking a nuclear weapon is to refrain from actions that make other countries believe they need a nuclear weapon. When either side kills the children, takes the homes, or threatens the other’s civilization, it gives war yet another breath.
Once we’ve progressed to the point that I am at Defcon 1 and you are at Defcon 1, de-escalation is a path, not an event. We see that this is because that is – each side has fears, resentments, injustices motivating them. When we admit that “they” also suffer we can gradually step toward actions that defuse conflict.
I do have deep concern that because we’re not on that path, we’re choosing to kick the can of violence, war and retribution into the future, in ways that we’ve seen again and again across history, but we haven’t come to understand as a cycle – as a continuation. My sense is that the rhetoric of our society has moved to the point where, when someone proposes taking the land, homes and natural resources of people in another country, the only question for many of us is “Great, but will it work?” My impression is that it will not. Indeed, the unrestrained habit of conquest, extraction, coercion, division, and self-enrichment is how empires fall.
Even in our own country, we’re often unwilling to ask how the other “side” suffers. If we’re progressive, we may only think we’re embracing the differences of others, defending the vulnerable, and recognizing that we’re a nation of immigrants, but we may ignore the concerns of those who feel we’ve gone beyond that, in ways that threaten their culture, or faith, or security – and we do nothing to find the middle.
If we’re conservative, we may only think we’re encouraging economic prosperity and defending our values, but we can ignore the concerns of those who feel we’ve exploited the defenseless, twisted our spirituality into a weapon, abandoned diplomacy for domination, and subordinated even our basic humanity to financial interests – and we do nothing to find the middle. It doesn’t help that the rhetoric of our media and our politicians is often little more than outrage theatre that marinates us in fear, resentment, and division.
There’s a difference between being out-voted and being unheard. If we use our power like a crowbar to pry, force, and separate – rather than as a loom to unify, elevate, and mend, the unheard simply wait for their turn.
This deadline that the President has set, it’s 8 PM, he’s threatened to destroy a civilization.
How does an investor process that? Is it a bigger upside risk or downside risk?
CNBC Anchor, April 7, 2026
Keep Me Informed
Please enter your email address to be notified of new content, including market commentary and special updates.
Thank you for your interest in the Hussman Funds.
100% Spam-free. No list sharing. No solicitations. Opt-out anytime with one click.
By submitting this form, you consent to receive news and commentary, at no cost, from Hussman Strategic Advisors, News & Commentary, Cincinnati OH, 45246. https://www.hussmanfunds.com. You can revoke your consent to receive emails at any time by clicking the unsubscribe link at the bottom of every email. Emails are serviced by Constant Contact.
The foregoing comments represent the general investment analysis and economic views of the Advisor, and are provided solely for the purpose of information, instruction and discourse.
Prospectuses for the Hussman Strategic Market Cycle Fund, the Hussman Strategic Total Return Fund, and the Hussman Strategic Allocation Fund, as well as Fund reports and other information, are available by clicking Prospectus & Reports under “The Funds” menu button on any page of this website.
The S&P 500 Index is a commonly recognized, capitalization-weighted index of 500 widely-held equity securities, designed to measure broad U.S. equity performance. The Bloomberg U.S. Aggregate Bond Index is made up of the Bloomberg U.S. Government/Corporate Bond Index, Mortgage-Backed Securities Index, and Asset-Backed Securities Index, including securities that are of investment grade quality or better, have at least one year to maturity, and have an outstanding par value of at least $100 million. The Bloomberg US EQ:FI 60:40 Index is designed to measure cross-asset market performance in the U.S. The index rebalances monthly to 60% equities and 40% fixed income. The equity and fixed income allocation is represented by Bloomberg U.S. Large Cap Index and Bloomberg U.S. Aggregate Index. You cannot invest directly in an index.
Estimates of prospective return and risk for equities, bonds, and other financial markets are forward-looking statements based the analysis and reasonable beliefs of Hussman Strategic Advisors. They are not a guarantee of future performance, and are not indicative of the prospective returns of any of the Hussman Funds. Actual returns may differ substantially from the estimates provided. Estimates of prospective long-term returns for the S&P 500 reflect our standard valuation methodology, focusing on the relationship between current market prices and earnings, dividends and other fundamentals, adjusted for variability over the economic cycle. Further details relating to MarketCap/GVA (the ratio of nonfinancial market capitalization to gross-value added, including estimated foreign revenues) and our Margin-Adjusted P/E (MAPE) can be found in the Market Comment Archive under the Knowledge Center tab of this website. MarketCap/GVA: Hussman 05/18/15. MAPE: Hussman 05/05/14, Hussman 09/04/17.