

Motherlode


John P. Hussman, Ph.D.
President, Hussman Investment Trust
Interim Comment: November 21, 2021
Given observations over at least one complete market cycle, we regularly find that the strongest average return/risk profile was associated with periods that one could identify in advance as having favorable valuation and (already) favorable market action, and that the poorest subsequent return/risk profile was associated with the bucket of periods having unfavorable valuation and unfavorable market action. Over the complete market cycle, this knowledge has generally been enough to achieve strong full-cycle returns with moderate risk. I generally try to avoid near term forecasts of market direction. The predictable amount of market return over a one-week period is overwhelmed by short-term volatility, and forecasts based on longer time horizons implicitly assume that the Market Climate we identify will not change over the forecast period. Given my general avoidance of forecasts, there are very few situations when I would state my views about the market as a ‘warning.’ Unfortunately, in contrast to more general Market Climates that we observe from week to week, the current set of conditions provides no historical examples when stocks have followed with decent returns. Every single instance has been a disaster. We can’t rule out the possibility that investors will adopt a fresh willingness to speculate (which we would observe through an improvement in market internals). Such speculation might prolong the current advance modestly, but even this would not substantially alter the risks that have ultimately been associated with overvalued, overbought, overbullish conditions.
– John P. Hussman, Ph.D., Warning – Examine All Risk Exposures, October 15, 2007
The S&P 500 had peaked a few days earlier, and would plunge by more than 55% during the global financial crisis. It is essential to learn the right lesson (discussed below) about the interaction between market internals, zero-interest rate policy, and overextended syndromes.
My first job in the financial markets was when I was 18, preparing high-low-close-volume charts by hand for an investment advisor, out of my dorm room at Northwestern. Fascinated by various regularities in the data, I spent countless hours in libraries and obscure record rooms, surrounded by stacks of books, files, and microfiche slides, making long-distance friends with statistical staff at the New York Stock Exchange, who would kindly send batches of historical market data, and typing all of it onto punch cards to run studies on the huge mainframe computer in the old Vogelback building. From those studies, I gradually developed the stock selection methods, valuation measures, and gauges of market internals that are essential elements of our investment discipline today.
Over the past four decades, I’ve also collected scores of interesting syndromes and relationships that tend to occur at market extremes, which I often discuss using terms like “overextension,” “dispersion,” and “reversal.” Occasionally, these are significant enough to prompt an interim update, outside of my regular market comments.
Well, on Friday, November 19, we hit the motherlode. Across four decades of work in the financial markets, and over a century of historical data, I’ve never observed as many historical indications of a market peak occurring simultaneously. Noise reduction is always a process of drawing a common signal from multiple, partially correlated sensors, even if each individual sensor might be imperfect. The reason that we follow boatloads of these syndromes is the same reason we base our gauge of market internals on thousands of securities – uniformity conveys information.
Emphatically – and this is important – my intent here is not to “call the top” of this bubble. Yes, this is a bubble in my view. Yes, I believe it will end in tears. Yes, the price investors pay for a given stream of future cash flows is inseparable from the long-term returns they can expect. Yes, if this bubble is ever to actually have a top, this would be a perfectly reasonable moment to expect one. Still, my present intent is simply to share what we’re observing.
No forecasts are required
Our investment discipline doesn’t rest on forecasts, or projections, or market calls. Valuations certainly inform our view about long-term returns, and market internals certainly inform our view about investor psychology, but our focus is on measures we can objectively gauge in the present. Our discipline is to align our investment outlook with prevailing market conditions – most importantly, the combination of observable valuations and observable market internals, reflecting the behavior of thousands of stocks, industries, sectors, and security types, including debt securities of varying creditworthiness.
Provided that market internals are deteriorating or divergent, various syndromes of overextension, such as “overvalued, overbought, overbullish” conditions, can also be enormously useful. Our key adaptation in recent years was adding that “Provided” phrase. In other cycles across history, that phrase wasn’t necessary. Once the market became sufficiently overextended, it would croak on its own accord.
That attention to valuations, internals, and overextended conditions allowed us to admirably navigate decades of complete market cycles – regularly shifting to constructive or leveraged investment stances near market lows, and moving to defensive or bearish stances at bubble peaks. In the recent bubble – unfortunately – adopting a bearish outlook based on overextended “limits” was persistently detrimental, because the frantic attempt of investors to find alternatives to zero-interest rates removed every reliable “limit” to speculation – at least while market participants had that bit in their teeth.
We’ve adapted in recent years by prioritizing the condition of market internals ahead of those overextended “limits.” Even if this bubble never ends, I expect we’ll be fine – though I would expect to concentrate our risk-taking during periods that market internals are uniformly favorable. The problem, at present, is that despite speculative highs in the S&P 500 and Nasdaq indices, our gauges of internals reflect persistent divergence here, with notable deterioration in recent weeks. The preponderance of warning flags we observe here are occurring in the context of the most extreme valuations in history, coupled with market internals that are already divergent.
Motherlode
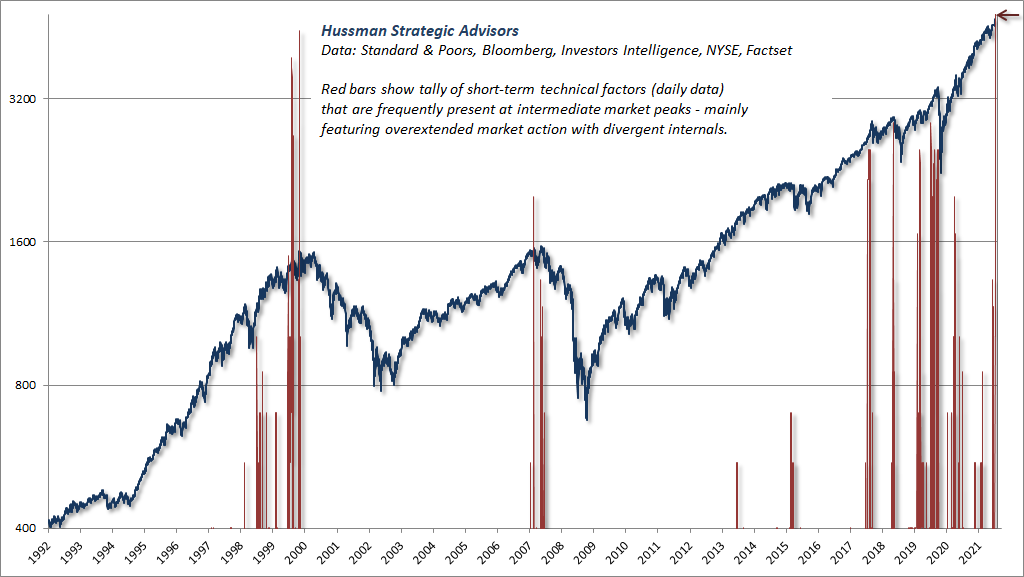
The first chart presents one of scores of various syndromes that we monitor. I’ve presented this one separately to illustrate certain features we often see in overextended markets. The syndrome below isn’t an investment strategy or even a material consideration in our investment strategy – it’s a single, imperfect classifier among scores that we monitor. This one reflects points where the S&P 500 was overextended on various short and long-term measures, coupled with a certain amount of internal divergence. In this case, internal divergence is measured simply as a significant number of stocks setting both new 52-week highs and new 52-week lows, coupled with modest deterioration in participation, as measured by the percentage of stocks above their own respective 200-day averages. We observed this combination on Friday, November 17th, for the first time since the cluster in late-2019 and early-2020.

The syndrome above has typically been followed by market losses of 6% or more within the following 6 weeks (indicated by the red bars with yellow shading). Not always so immediately, but often enough to be interesting as an intermediate-term classifier. Frankly, I don’t view any of one these syndromes as highly predictive or reliable on its own. The reason for this interim comment is that on Friday, November 19, we observed dozens of them simultaneously. What’s noteworthy is the uniformity.
The chart below is based on daily data. The red bars are actually presented on log scale because the tally is beyond anything we’ve ever observed. The previous record was March 27, 2000, the day after the tech bubble peaked.
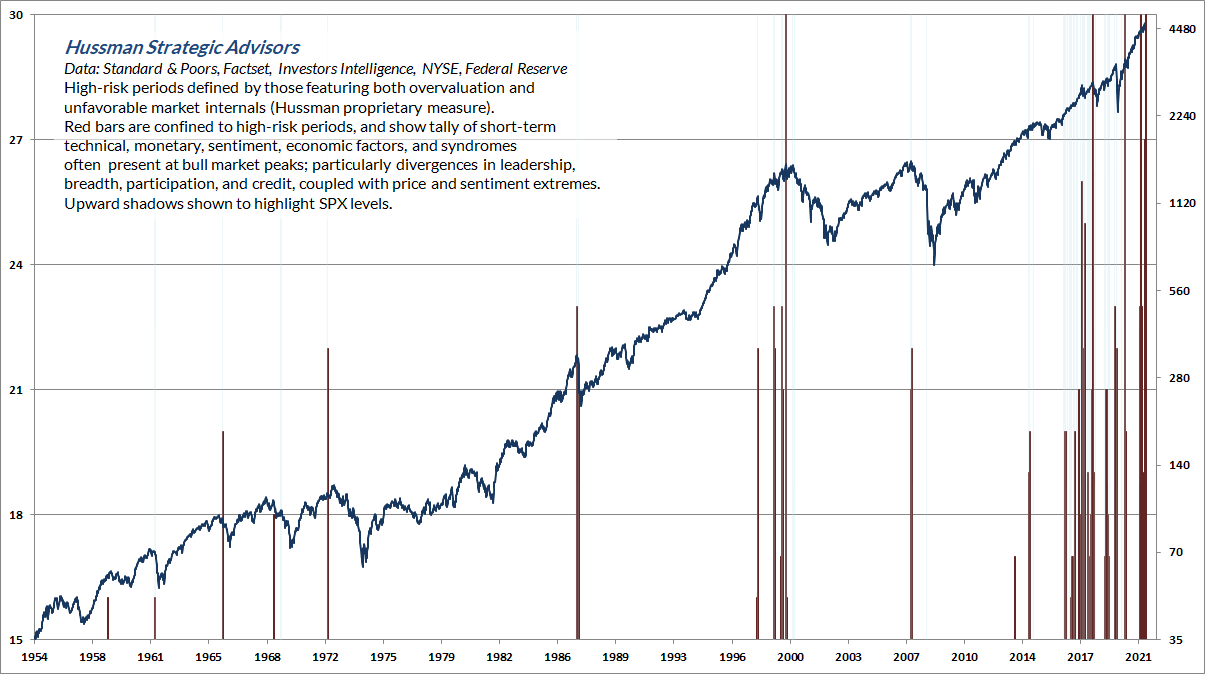
The chart below features a tally of different syndromes and criteria, though capturing similar considerations – extreme valuations, overbought conditions, ragged internals, lopsided bullish sentiment, rising interest rates in some syndromes, inflation pressures in others, divergent or reversing leadership, deteriorating participation, and so forth – in this case, based on weekly data.
Investors might respond with, “yes, but the ISM is above 50,” or “yes, but the yield curve isn’t inverted,” or “yes, but we’re not in a recession,” or “yes, but earnings are estimated to increase,” or with a dozen other “yes, but” considerations. The problem is that many of the things that investors associate with market losses emerge only after the market has turned lower. As investors should remember from the 1987 crash, a recession isn’t required. Given present extremes, it’s not even clear that “bad news” would be necessary for a steep market decline – a concerted attempt to take profits would be enough. Once a leveraged and wildly bullish crowd gets the smallest inkling to sell, the challenging question becomes – “to whom?”
Likewise, many popular measures – particularly the difference between the S&P 500 operating earnings yield and the 10-year Treasury yield – are weak, noisy, and often wholly misleading gauges of valuation and prospective market outcomes. So while the current motherlode of warning signs may or may not be followed by a severe market decline, it would be unwise for investors to assume that one condition or another provides a litmus test that rules out potential losses.
Valuation review
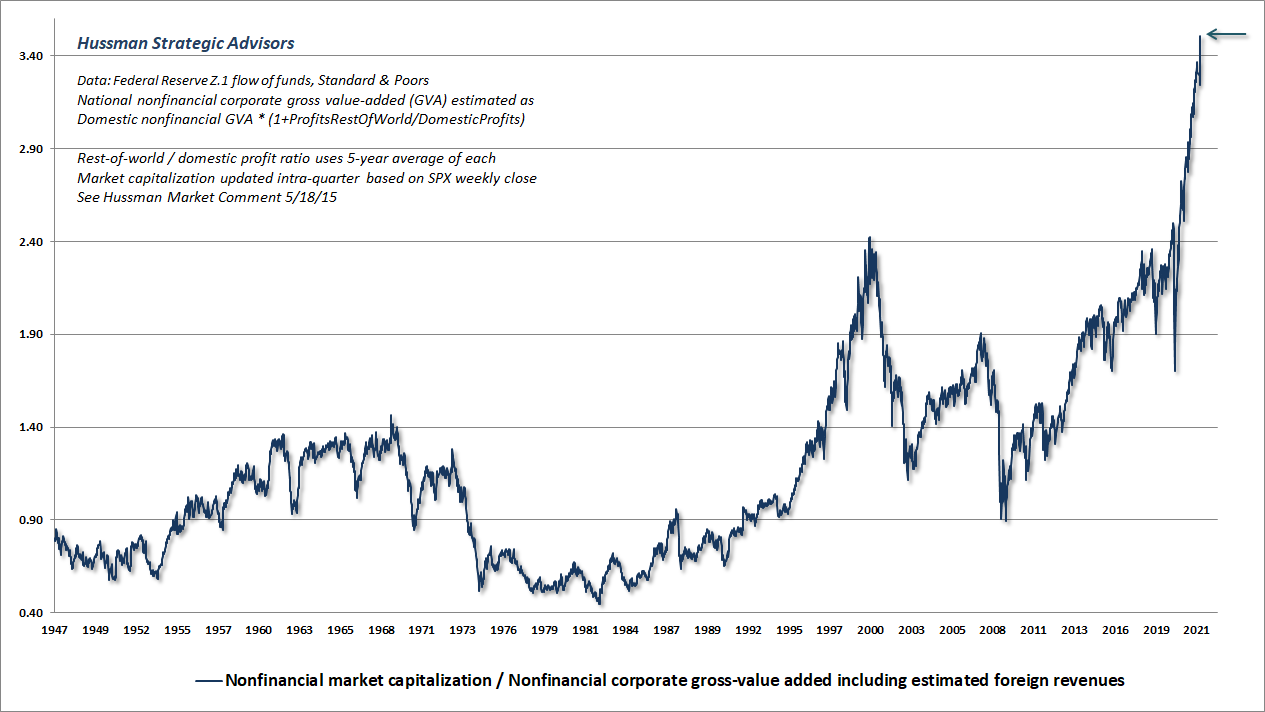
As a reminder of where reliable gauges of market valuations stand, the chart below shows the measure we find best-correlated with actual subsequent market returns across history: the ratio of U.S. nonfinancial market capitalization to corporate gross value-added, including our estimate of foreign revenues (MarketCap/GVA).
The scatter below shows the relationship between valuations and subsequent market returns in data since 1928. I’ve included the level of interest rates to underscore the fact that, while low interest rates can often accompany extreme market valuations, low interest rates do absolutely nothing to mitigate the unfavorable implication that extreme valuations have for subsequent market returns.
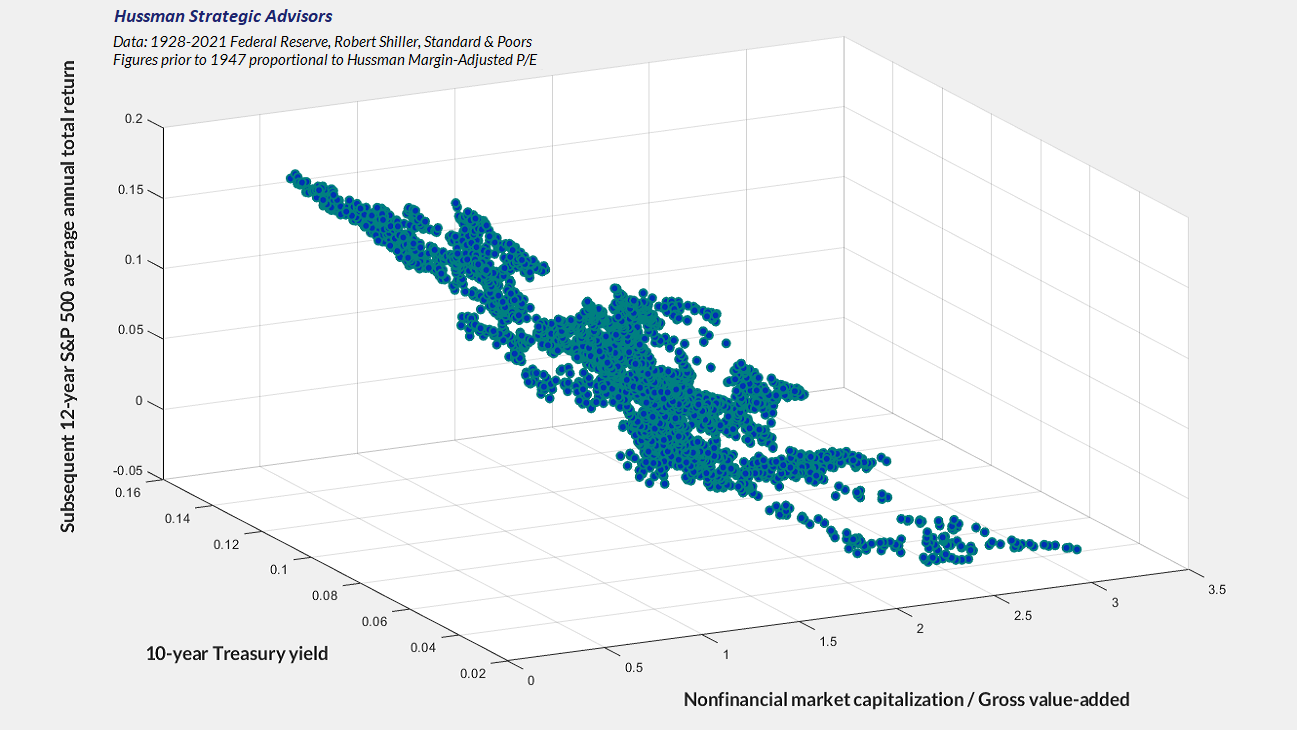
On Friday, November 19, our measure of MarketCap/GVA stood at 3.5, the highest level in history. We can’t plot the current point because the “subsequent return” coordinate isn’t known yet. The valuation and interest rate coordinates already place it in the far right corner of the chart above – implying the most negative projected return in history. Indeed, the 10-12 year S&P 500 total returns implied by our most reliable valuation measures are presently about 8% below Treasury bond yields (see When Bubble Meets Trouble for more).
To be clear, none of this – none of it – imposes a limit on this bubble, or implies that it cannot become more extreme. The point of this special update is that there are certain features of valuation, investor psychology, and price behavior that emerge, to one degree or another, when the fear of missing out becomes particularly extreme and the focus of speculation becomes particularly narrow. We’ve suddenly hit a motherlode of those conditions. Emphatically, this is not a forecast. It’s a statement about current, observable conditions.
Risk without return
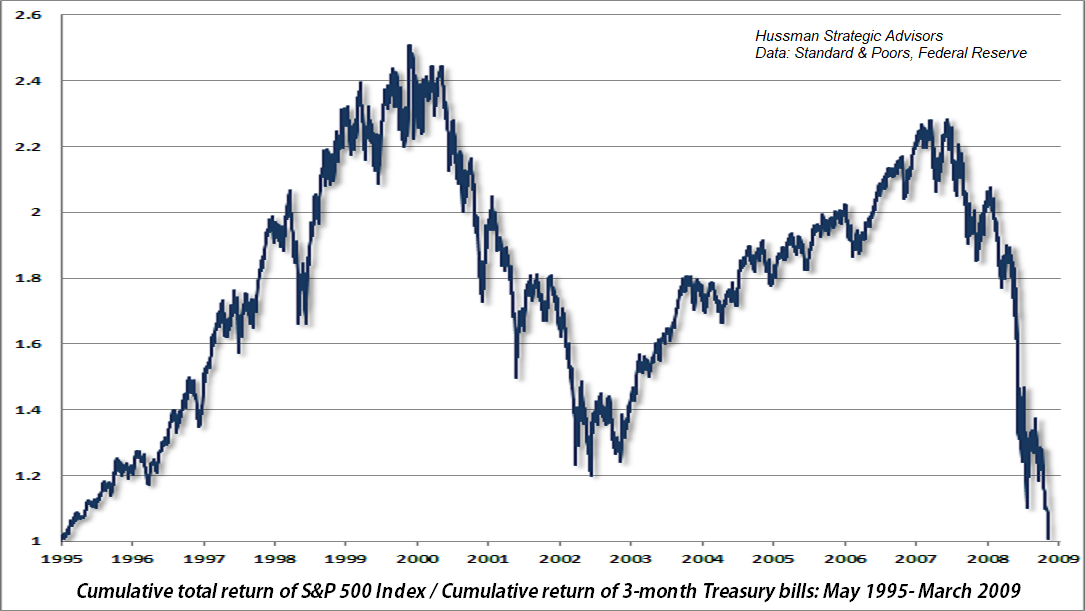
Investors don’t want to believe this, but every bit of the cumulative total return of the S&P 500, over and above T-bill returns, has accrued during periods when reliable valuation measures implied expected 10-12 year returns at least 2% above prevailing interest rates. Considerations like market internals can help enormously, but even from a strict valuation standpoint, once reliable gauges like MarketCap/GVA have implied 10-12 year returns less than 2% above prevailing interest rates, every bit of additional S&P 500 cumulative total return over T-bills – from the 1920’s to-date – has ultimately been wiped out. Indeed, The S&P 500 lagged T-bill returns from 1929-1947, 1966-1985, and 2000-2013. That’s 50 years out of an 84-year period. Each of those spans began with expected 10-12 year S&P 500 total returns at or below the prevailing level of interest rates, as we estimate they are today.
Instead of examining periods that began at elevated valuations (my preference, since starting valuations are observable in real-time), one can examine periods that ended at market troughs. The dates change, but the facts do not. The S&P 500 lagged T-bills from November 1916 to May 1932, February 1961 to August 1982, and from May 1995 to March 2009 (despite two intervening bubbles). That’s 50 years out of a 93-year period.
The chart below shows what this looks like. There was certainly a period before the late-1990’s, and again after the 2000-2002 market collapse, and again after the market collapsed in 2008, when valuations alone projected likely market returns adequately above interest rates.
To be clear, none of this – none of it – imposes a limit on this bubble, or implies that it cannot become more extreme. The point of this special update is that there are certain features of valuation, investor psychology, and price behavior that emerge, to one degree or another, when the fear of missing out becomes particularly extreme and the focus of speculation becomes particularly narrow. We’ve suddenly hit a motherlode of those conditions. Emphatically, this is not a forecast. It’s a statement about current, observable conditions.
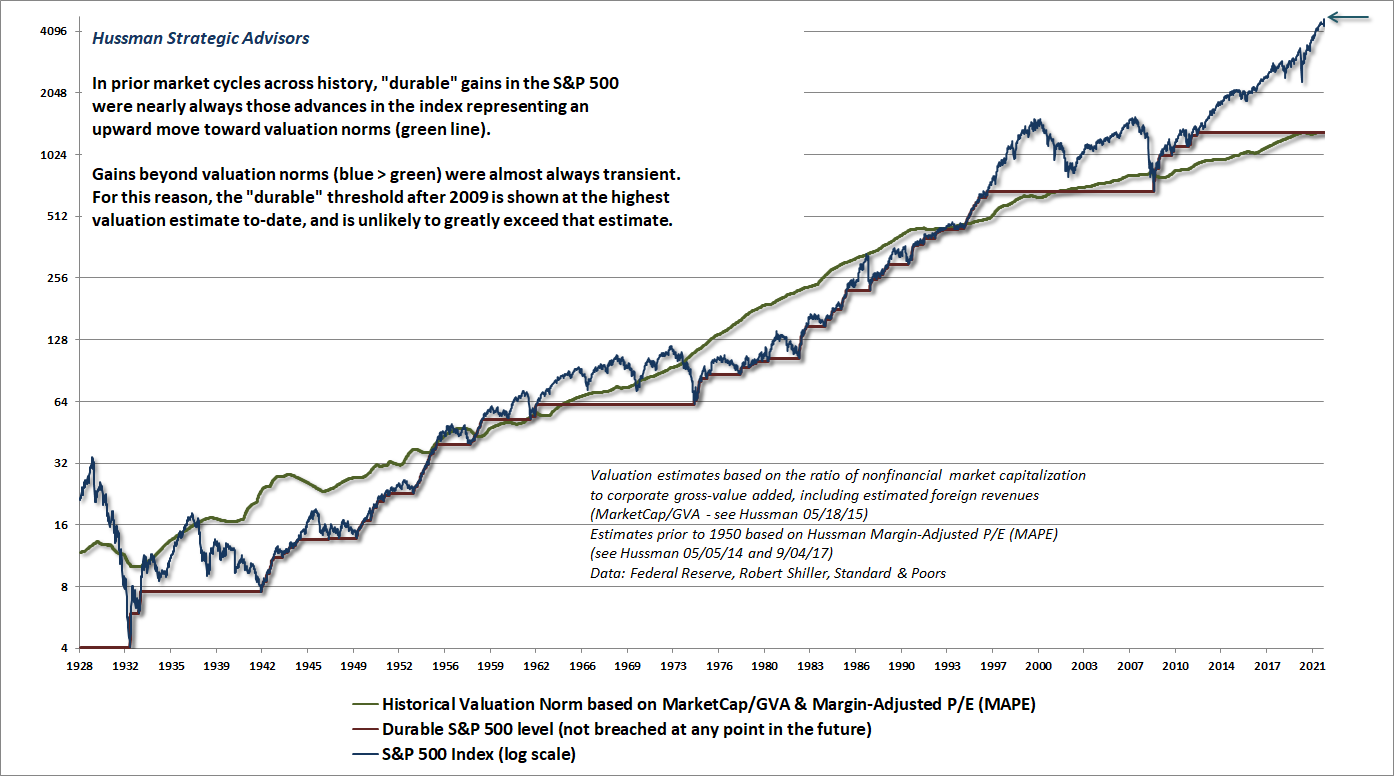
The chart below illustrates that market advances extending well beyond historical valuation norms tend to be transient, while market advances that take stocks up toward those norms tend to be durable. Presently, the S&P 500 is at about 3.5 times the valuation norms that are associated with historically run-of-the-mill long-term returns (about 10% annually), and about twice the level that would be associated with expected 10-12 returns even 2% above Treasury yields.
Learn the right lesson
I’ve been very clear about what I consider a definition of success – and that is only that, sooner or later, you will have made money to have sidestepped the bubble phase.
– Jeremy Grantham, GMO
While investing strictly “by the method of valuation,” as Benjamin Graham called it, may be effective over the long run, it can also be excruciating and untenable over more limited periods, particularly amid repeated bubbles. Fortunately, it’s not necessary to limit one’s investment discipline to valuation alone. Additional factors – particularly the uniformity of market internals – can be enormously helpful in identifying periods when market risk is “effective” from a return/risk perspective.
Today is not among those periods. The increasing dispersion between the broad market and the major indices has been the main headwind for hedged-equity strategies since March, and particularly in recent weeks. That sort of dispersion tends to end badly for the major indices.
A critical piece of advice: learn the right lesson from this bubble. There’s no question that my own bearish response to overextended “limits” was detrimental in recent years, particularly in periods when our measures of market internals were constructive. The only truly “different” feature of the recent bubble is that zero-interest rates encouraged persistent speculation even in the face of previously reliable “overvalued, overbought, overbullish” conditions. One had to become content simply to gauge the presence or absence of speculative pressures, based on the behavior of market internals, without assuming any well-defined “limit.” That’s the right lesson to learn from a yield-seeking bubble driven by zero-interest rate policy.
In contrast, it’s dangerous and incorrect to imagine that the lesson of this bubble is to ignore valuations and market internals, and to dismiss overextended conditions even when both valuations and internals are unfavorable – as they are today. Imagining that every risk can be ignored because “Hussman was wrong” is a wild misinterpretation of an error that I openly admit, regularly discuss, and have adapted our discipline to address. It’s always amusing that people think they know me for being a “permabear,” when the fact is that investors wouldn’t even know my name if our approach hadn’t been so successful in navigating decades of complete market cycles, prior to the Federal Reserve’s deranged foray into zero-interest rate policy during the recent incomplete half-cycle.
It’s worth noting that nothing in our own discipline relies on the prospect of severe market losses, even though we do expect that outcome. Fresh uniformity in our measures of market internals would encourage a more neutral near-term outlook, even though extending this bubble would worsen expected long-term market returns. An improvement in market internals following a material retreat in valuations – even nowhere near historical norms – would encourage a constructive outlook, though possibly with a safety net depending on other conditions, particularly the extent to which valuations have retreated.
As I’ve discussed in recent comments, much of our recent work has focused on ways to take larger and more frequently constructive outlooks, even if we never approach historical valuation norms again. One of them is to adopt a somewhat more “permissive” threshold in our gauge of market internals when interest rates are near zero – the effect being to become constructive earlier, and for a longer period, following V-shaped market declines like we observed in late-2018 and early-2020. See the final section of my October comment for more discussion). As always, no forecasts or scenarios are necessary. We’ll respond to the evidence as it shifts.
Market capitalization isn’t wealth, and it can quickly evaporate
Again, if this bubble is ever to actually have a top – and I believe it will – this would be a perfectly reasonable moment to expect one. From the standpoint of record valuations, it’s certainly the single most opportune moment that investors have ever had to obtain a “wealth transfer” from other investors, by selling. Still, the intent of this interim comment is only to share what we’re observing here.
As I’ve regularly noted, there’s no “getting out” of the market in aggregate – someone has to hold every share of stock outstanding, so there’s no point in advising investors to “sell.” Market capitalization is nothing but the price at which the most recent buyer and seller traded even a single share, multiplied by the total number of shares outstanding. Currently, the market capitalization of U.S. financial and nonfinancial equities stands at roughly $68 trillion, about 3 times the $23 trillion level of U.S. GDP. At the 2000 market peak, the record was about 1.9 times GDP. Indeed, the present ratio of U.S. market cap to GDP is nearly 50% above levels that were never observed prior to last year.
Market capitalization isn’t “wealth.” It’s the latest price, times shares outstanding. Blotches of ink on paper. Flashing pixels on a screen. If a dentist in Poughkeepsie buys a single share of Apple at a price that’s 10 cents higher than the previous trade, $1.6 billion in market capitalization emerges from thin air. If a single share trades 10 cents lower, $1.6 billion evaporates just as quickly. Whatever happens, every security in existence has to be held by someone until it is retired. Ultimately, the wealth inherent in a security is the future stream of cash flows it will deliver to its holder(s) over time. Price fluctuations don’t change those underlying cash flows. They just provide opportunities for the transfer of savings between investors. High valuations favor the sellers. Low valuations favor the buyers. Investors have never paid higher prices for those future cash flows, or accepted prospective returns so low.
Put simply, the bubble hasn’t changed the wealth, and a collapse won’t change the wealth. What will change is the market cap. I suspect that the erasure of market cap in the coming years, and possibly the coming quarters, may be brutal. Still, no forecasts are required, and our own attention will remain on observable valuations, market internals, and other factors. Meanwhile, even if an investor sells at these extremes, the only thing that will change is who holds the bag.
The main consideration, then, is to make sure that your own investment position is actually aligned with our own investment horizon and risk-tolerance. In the event that you choose to be heavily invested in stocks, at least take a moment to write out your reasons, and to clearly identify the evidence you’re using.
The wealth is in the future cash flows that stocks will deliver to investors over time. Investors have never paid higher prices for those future cash flows, or accepted prospective returns so low. The bubble hasn’t changed the wealth, and a collapse won’t change the wealth. What will change is the market cap.
Here and now, market conditions are characterized by:
- The most extreme valuations in U.S. history, on the measures we find best-correlated with actual subsequent market returns over the past century, and even in recent decades, coupled with lopsided bullish sentiment and historic levels of margin leverage;
- Deterioration and divergence across measures of market internals that we believe to be reliable gauges of investor psychology toward speculation versus risk-aversion;
- The largest preponderance of overextended syndromes – typically associated with intermediate or cyclical market peaks – that we’ve ever observed in history.
Not a forecast. Not a “limit.” Not a market call. Just sharing what we’re seeing.
Still, it’s fair to add that we’ve never seen such a thing.
Keep Me Informed
Please enter your email address to be notified of new content, including market commentary and special updates.
Thank you for your interest in the Hussman Funds.
100% Spam-free. No list sharing. No solicitations. Opt-out anytime with one click.
By submitting this form, you consent to receive news and commentary, at no cost, from Hussman Strategic Advisors, News & Commentary, Cincinnati OH, 45246. https://www.hussmanfunds.com. You can revoke your consent to receive emails at any time by clicking the unsubscribe link at the bottom of every email. Emails are serviced by Constant Contact.
The foregoing comments represent the general investment analysis and economic views of the Advisor, and are provided solely for the purpose of information, instruction and discourse.
Prospectuses for the Hussman Strategic Growth Fund, the Hussman Strategic Total Return Fund, the Hussman Strategic International Fund, and the Hussman Strategic Allocation Fund, as well as Fund reports and other information, are available by clicking “The Funds” menu button from any page of this website.
Estimates of prospective return and risk for equities, bonds, and other financial markets are forward-looking statements based the analysis and reasonable beliefs of Hussman Strategic Advisors. They are not a guarantee of future performance, and are not indicative of the prospective returns of any of the Hussman Funds. Actual returns may differ substantially from the estimates provided. Estimates of prospective long-term returns for the S&P 500 reflect our standard valuation methodology, focusing on the relationship between current market prices and earnings, dividends and other fundamentals, adjusted for variability over the economic cycle.