

When Bubble Meets Trouble


John P. Hussman, Ph.D.
President, Hussman Investment Trust
November 2021
I think it’s clear that we’re deep into bubble territory. Bubbles are characterized typically at the end of a long bull market by a period where they accelerate, and they start to rise at two or three times the average speed of the bull market, which they did last year of course. Of course, they’re always extremely overpriced by average historical standards. There are a few people who would still argue that 2000 was higher, but most of the data suggests that this is the new American record for highest priced stocks in history. Then there’s the most important thing of all, which is crazy behavior, the kind of meme stock, high participation by individuals, enormous trading volume in penny stocks, enormous trading volume in options, huge margin levels, peak borrowing of all kinds, and the news is on the front page. This is all characteristic of the handful of great bubbles that we’ve had.
We’ve checked off all the boxes. Now the question is how high is high? Very hard to tell always what the peak will be, but what you do know is that how high the peak is has no bearing at all on what the fair value is. What it does change is the amount of pain that you get to go back to fair value and below. You profoundly do not wish for a super high level to your bubble, and you profoundly do not wish for more than one asset class to be bubbling at the same time. I’ve been very clear about what I consider a definition of success – and that is only that, sooner or later, you will have made money to have sidestepped the bubble phase.
You can very seldom identify the pin that pops it. 1929, no one has agreed yet what the pin was. The biggest cage rattler of all is everything else you haven’t thought about that could go wrong. And my guess is that’s probably the cause, in the end, of most of the bubbles deflating. The mechanics of a bubble is you have maximum borrowing, maximum enthusiasm. And then the following day, you’re still enthusiastic but not quite as enthusiastic as yesterday. A week later, you’re not quite as enthusiastic as last week and last month. And gradually, the enthusiasm level drops off a bit, you have no more money to borrow, you’re fully borrowed, and the buying pressure gradually slows down. And that’s it.
The next time we’re pessimistic, we have more potential to write down asset prices than we have ever had in history, anywhere.
– Jeremy Grantham, GMO, The Top of the Cycle, August 2021
Jeremy Grantham recently observed “Seriousness is flagged by the language that you use. I’ve always tried to make a big difference, but the difference is often wasted because people don’t remember what you sounded like when you were serious. The difference I’m trying to make is just the routine ‘the market is expensive,’ and the significant. The significant is three bubbles. This is serious.”
My own concerns here share that sort of pointed seriousness. I expect that the coming decade – and possibly even the next 12 months – will be a disaster for the U.S. stock market. Emphatically, our own investment discipline doesn’t require forecasts or rely on projections. Rather, our investment stance will change as valuations, market internals, and other observable factors change. My real concern is for passive investors – particularly charitable organizations whose missions would be compromised by a loss of over 50% in their equity investments (and whose missions might be enhanced by avoiding even part of that), and retirees who have barely enough to enjoy their future, but with most of it dependent on the temporarily bloated prices they see printed on a page or flashing on a screen.
Measured from current extremes, I expect that the unwinding of this bubble will drag S&P 500 total returns below Treasury bill returns for least a decade, and possibly two. Yet like other bubbles, I expect that most of the damage will come off the top, resulting in market conditions that are reasonably investable within a year or two. Presently, the valuation measures we find best correlated with actual subsequent market returns are at the most extreme levels in U.S. history. Moreover, as I’ve detailed before, the low level of interest rates does nothing to improve those prospective returns. For a review, see the section titled “The mapping between observable valuations and expected returns is independent of the level of interest rates” in Alice’s Adventures in Equilibrium.
Valuation review
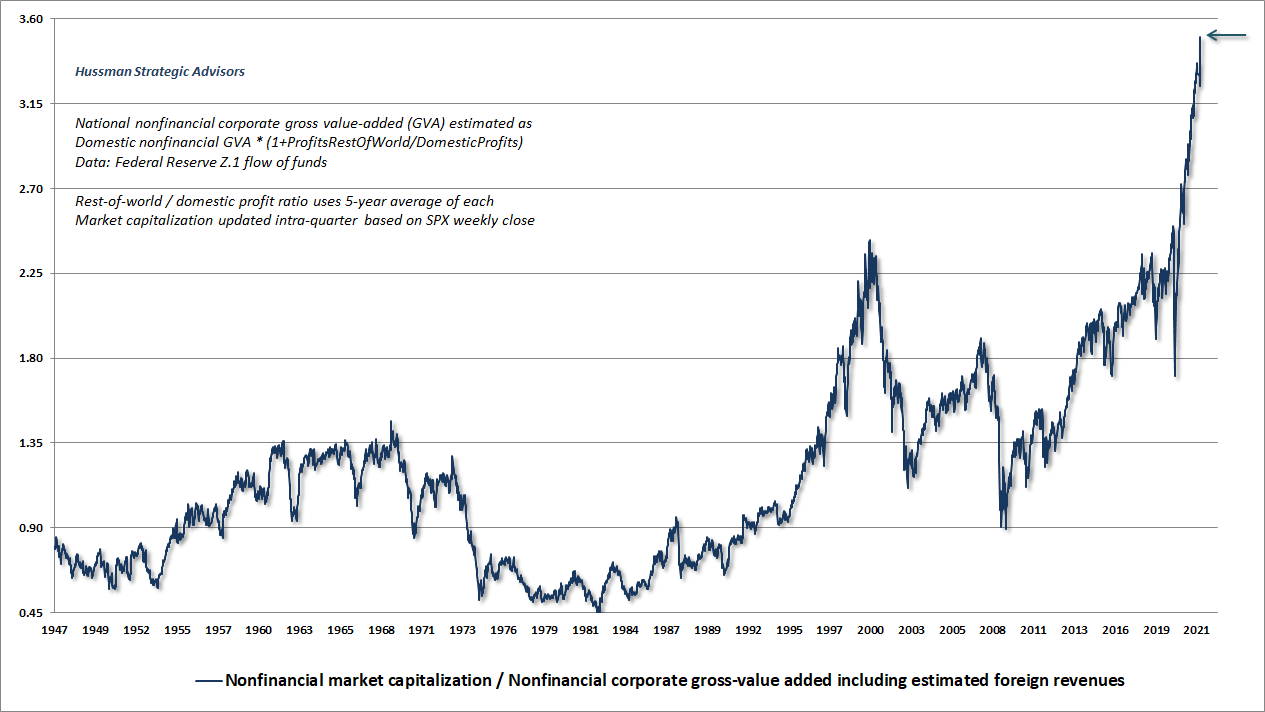
The chart below shows the valuation measure we find best correlated with actual subsequent market returns in market cycles across history – the ratio of U.S. nonfinancial equity market capitalization to corporate gross value-added, including our estimates of foreign revenue (MarketCap/GVA). This measure is now 50% above levels that were never seen in history prior to last year.
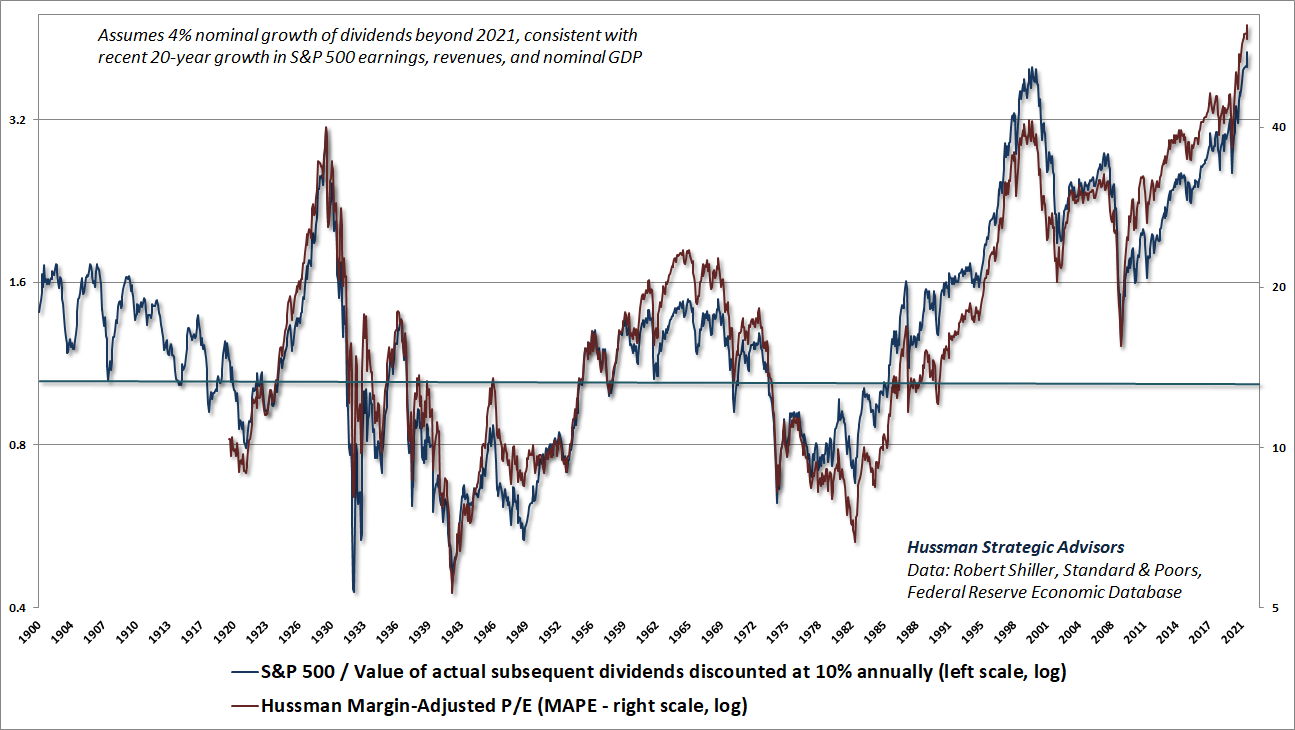
The next chart shows two companion measures. The blue line shows the ratio of the S&P 500 to the present discounted value of actual S&P 500 per-share dividends since 1900, using a fixed discount rate of 10% (Price/DDV). The chart assumes that dividends beyond 2021 grow at a nominal rate of 4% annually, consistent with the trend of S&P 500 revenues, earnings, and nominal GDP over the past two decades. The red line shows our Margin-Adjusted P/E (MAPE), which is also at extremes that eclipse the 1929 and 2000 bubble peaks.
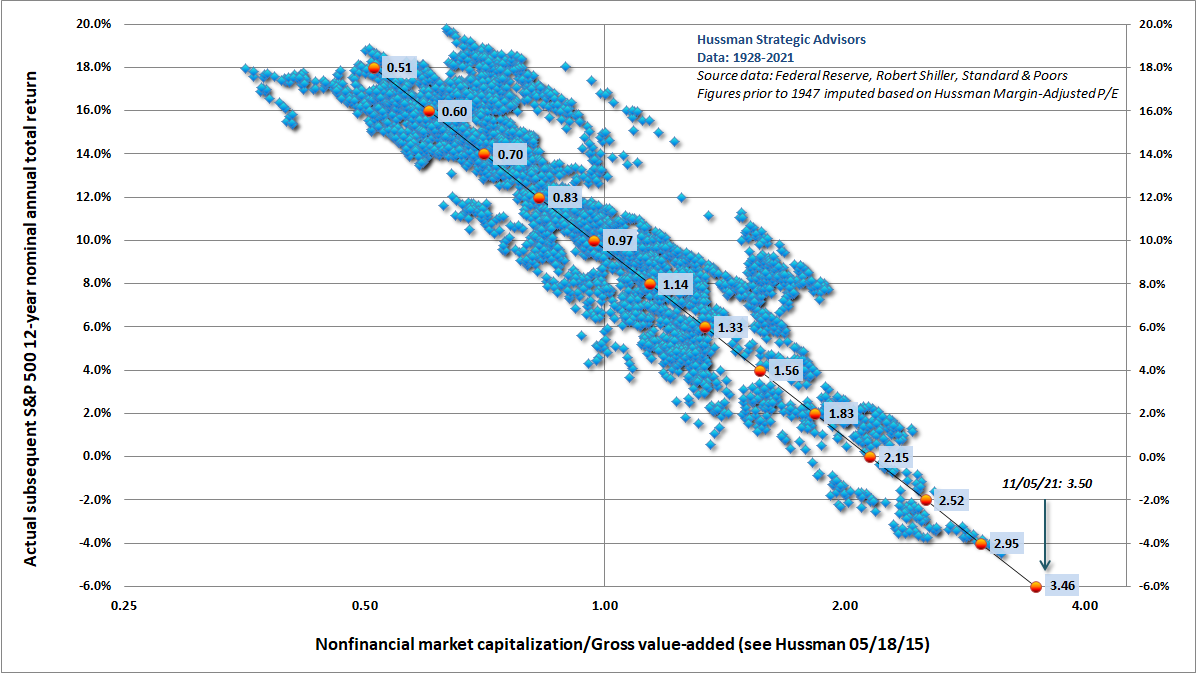
The chart below shows the correlation between these valuation measures and actual subsequent S&P 500 12-year total returns, in data since 1928. Even if actual S&P 500 total returns exceed these projections by the same amount that they have during the 12-year bubble period from 2009-2021 (which would essentially require valuations to permanently remain above the 1929 and 2000 extremes), the total return of the S&P 500 would be roughly zero.
Notably, more rapid nominal growth would not improve likely market returns. The level of U.S. long-term interest rates is strongly correlated with trailing nominal GDP growth. Faster growth – whether due to real GDP or inflation – is associated with higher interest rates (and more normal equity market valuations) at the end of the period. As I observed last month, even if we examine the times in U.S. history that growth in nominal GDP, S&P 500 revenues, or cyclically-adjusted earnings averaged over 10% annually for a decade or more, or that 10-year CPI inflation averaged even 4% annually, S&P 500 valuations at the end of those 10-year periods were always at or below historical norms – on average more than 30% below those norms.
Think about it this way. MarketCap/GVA is now 3.5, compared with a 2000 peak of 2.4, an extreme that was not exceeded until last year. Over the past 20 years, whether one measures to the pre-pandemic peak or the current one, U.S. nonfinancial gross value-added has grown at just 4% annually. Now allow the current level of valuations to slip – not too far – not even below the 1929 or 2000 extremes. Even in that event, the resulting 10-year annual gain in the S&P 500 index would be:
1.04*(2.4/3.5)^(1/10)-1 = 0.15%
Fortunately, the dividend yield of the S&P 500 is 1.30%, so as long as bubble valuations can be reliably sustained, at least investors will have that.
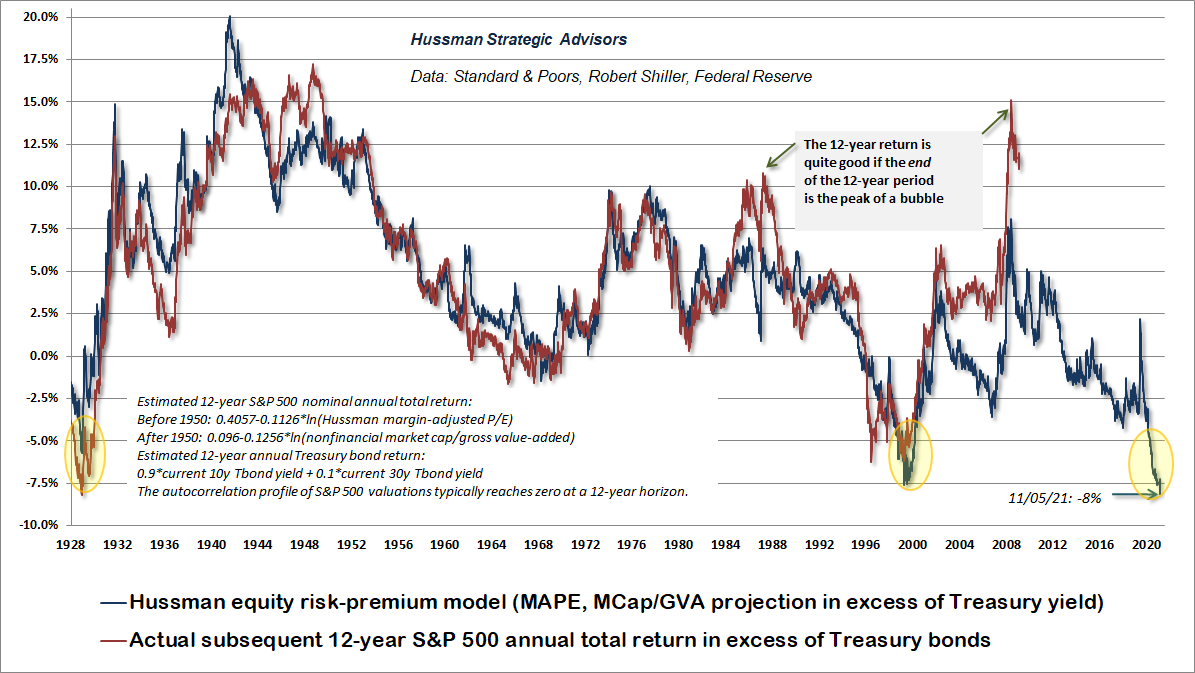
It is a fiction that stocks, at any price, are better than low-yielding bonds. If you want to make that argument to investors – here I’m speaking directly to analysts on Wall Street and the Fed – at least have the intellectual decency to test your estimates against decades of actual subsequent market returns, and show them side-by-side. By our estimates, the S&P 500 is likely to lag Treasury bonds by about 8% annually over the coming decade – the largest gap in history, and slightly worse than the outcomes after 1929 and 2000. For a discussion of equity risk premium (ERP) models, including the Shiller-Black-Jirav “excess CAPE yield”, see A Good Response to a Bad Situation.
Yes, bond yields are lower than they were in 2000, but equity valuations are also more extreme. The end result for relative returns is likely to be similar to that of previous bubbles. Even an “error” as large as the one we’ve seen in the past 12 years (which would require future valuations to remain at bubble extremes) would leave S&P 500 total returns at or below the lowly returns on Treasury bonds. The main thing the Federal Reserve has accomplished is to create a yield-seeking bubble that has driven both bonds and stocks to valuations that imply dismal future outcomes.
Another word to analysts: never discount the expected future cash flows of a long-term security using a rate of return that you don’t actually believe investors will accept over the entire life of that security – or that is wildly inconsistent with the long-term returns that investors have historically required – and then have the audacity to call the resulting price “fair value.” It’s just not right.
When bubble meets trouble
A few of Jeremy Grantham’s observations about speculative bubbles should not be missed. Not just because they agree with our own thinking, but because hearing the same concepts in different words, from a different speaker, can often deepen ones understanding.
“How high the peak is has no bearing at all on what the fair value is. What it does change is the amount of pain that you get to go back to fair value and below. I’ve been very clear about what I consider a definition of success – and that is only that, sooner or later, you will have made money to have sidestepped the bubble phase.”
This is a point I’ve emphasized often, but it can’t be repeated enough: amplifying a bubble doesn’t somehow avoid its consequences – it makes those consequences worse. Amplifying a bubble doesn’t even create “wealth” for the economy as a whole, only temporary opportunities for wealth transfer between individuals. That’s because the wealth isn’t in the price – it’s in the future stream of cash flows. If one holder sells, the next buyer has to hold the bag, and ultimately it’s the cash flows that matter. The only thing progressively higher valuations do is to progressively lower the long-term returns that investors will subsequently enjoy if they buy (or hold) at those valuations.
One of the things that you may have noticed is that our downside targets for the markets don’t simply slide up in parallel with the market. Most analysts have an ingrained ‘15% correction’ mentality, such that no matter how high prices advance, the probable maximum downside risk is just 15% or so (and that would be considered bad). Factually speaking, however, that’s not the way it works. The inconvenient fact is that valuation ultimately matters. That has led to the rather peculiar risk projections that have appeared in this letter in recent months. Trend uniformity helps to postpone that reality, but in the end, there it is. Given current conditions, it is increasingly likely that valuations will begin to matter with a vengeance.
– John P. Hussman, Ph.D., March 7, 2000
I’ve often observed that risk management is generous. Being on the sidelines during a late-stage bubble can feel horrible, but the “missed” gains are typically transient. Invariably, rich valuations are followed by very long periods where the market either collapses or goes nowhere in an interesting way. Consider the 14-year period from May 1995 to March 2009 – two financial bubbles in the interim, yet in the end, the S&P 500 lagged Treasury bills for the full period. The S&P 500 lagged T-bills for the 21-year period from February 1961 to August 1982, a span that included the “Go-Go” bubble of the late-1960’s and its collapse, along with the blue chip (Nifty Fifty) bubble that collapsed in 1973-74. The easy one, of course, was the 16-year period from November 1916 to May 1932, which included the bubble of the roaring 20’s and its subsequent collapse in 1929-1932.
The result is the same if you measure from the bubble peaks. The S&P 500 lagged Treasury bills from 1929-1947, 1966-1985, and 2000-2013. 50 years out of an 84-year period. That’s just what overvalued markets do.
“The next time we’re pessimistic, we have more potential to write down asset prices than we have ever had in history, anywhere.”
Speculative bubbles collapse. I don’t know how to make that point simpler, but somehow it needs to be said. Still, attention to investor psychology – speculation versus risk-aversion – can help enormously. A market crash is nothing more than low risk-premium meeting risk-aversion. Indeed, when investors become risk-averse, they treat safe liquidity as a desirable asset rather than an inferior one, so creating more of the stuff does nothing to support stocks. That’s how the market could collapse in 2000-2002 and 2007-2009 despite aggressive and persistent Fed easing.
Grantham’s phrase “the next time we’re pessimistic” is crucial, because pure speculative psychology is the only thing standing between an hypervalued market that continues to advance and a hypervalued market that drops like a rock. Our best gauge of that psychology – the uniformity of market internals – remains divergent enough to keep market conditions in a trap-door situation.
When investors are inclined to speculate, they tend to be indiscriminate about it, so we gauge that psychology based on the uniformity or divergence of market internals across thousands of stocks, industries, sectors, and security types, including debt securities of varying creditworthiness. I introduced our main gauge of market internals back in 1998 (what I called “trend uniformity”), and have made only modest adaptations since then. The main recent adaptation has been to adopt a slightly more “permissive” threshold in our gauge of market internals when interest rates are near zero and certain measures of risk-aversion are well-behaved, which captures the idea that tossing deranged Fed policy into the mix boosts the implications of a given improvement in market internals. The effect is to promote a more constructive shift following material market losses.
Both valuations and market internals continue to be essential elements of our investment discipline. In contrast, my error in this bubble was that I attended too strongly to historically reliable “limits” to speculation. Those limits became wholly ineffective amid the Fed-induced delusion that zero interest rates leave investors “no alternative” to speculate, regardless of the level of valuation. I’ve regularly detailed our key adaptation – becoming content to gauge the presence or absence of speculative pressures based on valuations and market internals, but without assuming that speculation has any well-defined limit.
Since late-2017, we’ve refrained from adopting or amplifying a bearish outlook when we observe that uniformity. We’ve also become open to moderately constructive stances – though still with safety nets and tail-risk hedges – regardless of the level valuations, provided that market internals indicate that investors have the speculative bit in their teeth. All of this is what Ben Graham might have described as “intelligent speculation, kept within minor limits.”
At present, our measures of market internals remain sufficiently divergent to hold us to a strongly defensive stance. Indeed, the main headwind for hedged equity strategies in recent weeks has been the divergence between the broad market and capitalization-weighted indices dominated by overvalued large-cap glamour stocks. Still, we’re close enough to the threshold to refrain from “fighting” a further advance or amplifying our bearish outlook if investors remain punch-drunk enough to chase greater extremes. What we will not do, except at markedly less extreme valuations, is to adopt an unhedged investment stance. I expect that this bubble will end terribly, and the damage will take more than a decade to undo.
I know that many of you believe that the current episode of speculative enthusiasm will persist forever –that the Fed will make it persist. We’ve already established that market returns are likely to be flat or poor even if the market achieves what Irving Fisher disastrously projected as a “permanently high plateau” in 1929, and valuations remain forever above extremes never seen before last year. Investors should also consider what might happen if valuations merely touch their historical norms – even 20 years from today – and growth in fundamentals matches that of the past 20 years. The simple arithmetic implies that the S&P 500 would actually lose value on a total return basis.
One of the striking features of the past five years has been the domination of the financial scene by purely psychological elements. In previous bull markets the rise in stock prices remained in fairly close relationship with the improvement in business during the greater part of the cycle; it was only in its invariably short-lived culminating phase that quotations were forced to disproportionate heights by the unbridled optimism of the speculative contingent. But in the 1921-1933 cycle this ‘culminating phase’ lasted for years instead of months, and it drew its support not from a group of speculators but from the entire financial community. The ‘new era’ doctrine – that ‘good’ stocks were sound investments regardless of how high the price paid for them – was at bottom only a means of rationalizing under the title of ‘investment’ the well-nigh universal capitulation to the gambling fever.
That enormous profits should have turned into still more colossal losses, that new theories should have been developed and later discredited, that unlimited optimism should have been succeeded by the deepest despair are all in strict accord with age-old tradition.
– Benjamin Graham & David Dodd, Security Analysis, 1934
It may be impossible to warn investors-turned-speculators at the peak of a bubble, without having been thoroughly discredited first. It’s only those who attend to, and care about valuations – and the well-being of others – that apply for that thankless job. After all, the only way to establish bubble valuations is for the market blow through every lesser extreme, and to dismantle the very belief that valuations matter at all. As Galbraith wrote of speculative bubbles decades ago, “Strongly reinforcing the vested interest in euphoria is the condemnation that the reputable public and financial opinion directs at those who express doubt or dissent. Past experience, to the extent that it is part of memory at all, is dismissed as the primitive refuge of those who do not have the insight to appreciate the incredible wonders of the present.”
I’ve been through this particular rodeo before. In decades of complete market cycles prior to the recent bubble, I’ve repeatedly been somewhat discredited at bubble peaks, yet also ended up having done admirably over the complete cycle, typically with smaller full cycle drawdowns than for the market itself. Despite the challenges we’ve addressed during the recent bubble, that certainly remains my objective going forward.
It’s slightly amusing that people think they know me for being a permabear. What they don’t realize is that they actually know me for having successfully navigated decades of market cycles – including periods of bullish and even leveraged investment stances – and then having erred by being overly bearish during this bubble. Nobody would even know my name had I not been successful before this extended carnival of Fed-induced speculation. I’ve openly addressed the error, and I remain convinced that attention to valuations and market internals is critical. An improvement in market internals here could defer our immediate concerns, but remember Grantham’s warning – “How high the peak is has no bearing at all on what the fair value is. What it does change is the amount of pain that you get to go back to fair value and below.”
On Wall Street, urgent stupidity has one terminal symptom, and it is the belief that money is free. Investors have turned the market into a carnival, where everybody ‘knows’ that the new rides are the good rides, and the old rides just don’t work. Where the carnival barkers seem to hand out free money just for showing up. Unfortunately, this business is not that kind – it has always been true that in every pyramid, in every easy-money sure-thing, the first ones to get out are the only ones to get out. We’ve seen two-tiered markets before: most prominently in 1929, 1968-69, and 1972. Even at those pre-crash extremes, the S&P never sold above 20 times record earnings. The market clearly faces problems at a multiple of 32. Technology stocks will ultimately fare worse. Over time, price/revenue ratios come back in line. Currently, that would require an 83% plunge in tech stocks (recall the 1969-70 tech massacre). If you understand values and market history, you know we’re not joking.
– John P. Hussman, Ph.D., March 7, 2000
The tech-heavy Nasdaq 100 went on to lose an almost implausibly precise 83% by October 2002
Given my general avoidance of forecasts, there are very few situations when I would state my views about the market as a ‘warning.’ Unfortunately, in contrast to more general Market Climates that we observe from week to week, the current set of conditions provides no historical examples when stocks have followed with decent returns. Every single instance has been a disaster. Whatever market exposure investors accept today ought to be the same market exposure that investors are committed to maintain for the duration of a bear market, without abandoning their investment plan. Investors with no plan to own stocks through a market decline, holding them only in the hope of selling at market highs, may discover in hindsight that these were them.
– John P. Hussman Ph.D., October 15, 2007
“Then there’s the most important thing of all, which is crazy behavior, the kind of meme stock, high participation by individuals, enormous trading volume in penny stocks, enormous trading volume in options, huge margin levels, peak borrowing of all kinds, and the news is on the front page. This is all characteristic of the handful of great bubbles that we’ve had.”
I don’t think it’s necessary to catalog the full inventory of speculative madness that has emerged during this bubble. Investors see it with their own eyes. The problem is that somehow they’ve been able to convince themselves that it’s not madness. As Galbraith wrote decades ago, “No one wishes to believe that this is fortuitous or undeserved; all wish to think it is the result of their own superior insight or intuition. The very increase in values thus captures the thoughts and minds of those being rewarded. Speculation buys up, in a very practical way, the intelligence of those involved.”
Let me be very clear here. The striking, often instantaneous “wealth” that seems to be popping up around you almost daily is not a reflection of a brave new world. It is a symptom of a speculative wave at its crest. I know that most investors don’t believe that. Of course you don’t believe that! It would mean that a large portion of what you consider to be “wealth” will simply evaporate as smaller prices are placed on the pieces of paper and digital “objects” you own.
This isn’t new, guys. It only reminds me of what we saw in 2000. For example, Xcelera – a company that owned nothing but a single hotel in the Cayman Islands – which swelled to a market capitalization of $11.7 billion in March 2000, then poof. Or Palm, which I also wrote about back then:
The peak of this idiocy will probably go into the history books as occurring on March 2nd. On that day, 3Com spun off Palm Inc., a majority owned subsidiary. On March 1st, just before the spinoff, 3Com was valued at roughly $42 billion in market capitalization. But somehow, in the next day’s exuberance, the market cap of PALM — the spinoff – soared to $93 billion. In other words, the market suddenly valued a sliver of the parent company at over twice what the whole company was worth the day before. This despite the fact that Palm represents only about 15% of 3Com’s revenues and less than 5% of its earnings. Perhaps not surprisingly, Palm has since collapsed from a high of 165 to a still unpalatable 31. That gives it a market cap of over $17 billion, compared to the $15 billion market cap of the parent 3Com, which still owns about 95% of Palm (about 1.5 PALM per share of COMS).
This is what you call a risk arbitrage. Selling Palm short and buying 3Com essentially gets the remaining lines of 3Com’s business for nothing. Unfortunately, the majority of the float in Palm has already been borrowed by short sellers, so the shares are nearly impossible to borrow and short. But let’s see. If you were 3Com, and you realized that the market was temporarily dominated by idiots who can’t even do arithmetic, what would you do? Oh, how about quickly spinning off the remaining 95% of Palm, and doing a huge share buyback of 3Com? CBS MarketWatch May 9, 2000: ‘After Monday’s closing bell, the company set July 27 as the day it will spin off the remaining 532 million shares of Palm it owns, which is earlier than originally expected. Separately, the company said it would expand its share repurchase program.’ Separately, my @$$. Well, at least somebody understands this idiocy.
– John P. Hussman, Ph.D., May 10, 2000
“The mechanics of a bubble is you have maximum borrowing, maximum enthusiasm. And then the following day, you’re still enthusiastic but not quite as enthusiastic as yesterday. A week later, you’re not quite as enthusiastic as last week and last month. And gradually, the enthusiasm level drops off a bit, you have no more money to borrow, you’re fully borrowed, and the buying pressure gradually slows down. And that’s it.”
Here, Grantham’s comments match the dynamic that Franco Modigliani described in March 2000.
I can show, really precisely, that there are two warranted prices for a share. The one I prefer is based on such fundamentals as earnings and growth rates, but the bubble is rational in a certain sense. The expectation of growth produces the growth, which confirms the expectation; people will buy it because it went up. But once you are convinced that it is not growing anymore, nobody wants to hold a stock because it is overvalued. Everybody wants to get out and it collapses, beyond the fundamentals.
– Nobel Laureate Franco Modigliani, New York Times, March 30, 2000
As I detailed in How to Spot a Bubble, There are essentially two “rational” prices for a stock – one is the price that is consistent with the long-term returns that investors actually expect and ultimately require, and one is the price that validates the short-term expectations of investors based solely on extrapolating the current trend. The defining feature of a bubble is inconsistency between expected returns based on price behavior and expected returns based on valuations. As a bubble progresses, the gap between those two prices becomes progressively larger, but holding on feels “rational” in a certain sense provided that prices are advancing relentlessly. Then, as Grantham observes, the enthusiasm level drops off a bit, and you typically see a “waterfall” as speculators rush to sell. The question then becomes “to whom?”
“The biggest cage rattler of all is everything else you haven’t thought about that could go wrong.”
Presently, market valuations are now so extreme that investors are likely to be deeply disappointed even if their expectations about earnings are correct. Unfortunately, my impression is that Wall Street’s projections of corporate earnings are profoundly at odds with the macroeconomic equilibrium that drives those earnings. The financial damage will be even more breathtaking if those projections prove to be wrong, as I suspect they will. We’ll talk about that next.
Corporate earnings versus arithmetic
A frequent – if not universal – feature of the final stage of a speculative bubble is the tendency of investors to move their attention away from the level of valuations, and to transfer it, as Graham & Dodd lamented in 1932, “almost exclusively to the earnings trend, i.e. to the changes in earnings expected in the future.” Unfortunately, this shift of attention has the subtle effect of making price irrelevant as an investment consideration.
The other problem is that because bubble prices generally reflect a combination of extreme price/earnings multiples times record earnings that have been temporarily elevated by record profit margins, the subsequent downturn in earnings can vastly amplify market losses as both earnings and price/earnings multiples retreat simultaneously.
Well, we’ve set that house of cards up again. What’s worse is that investors don’t seem to recognize it – partly because there’s nowhere they would have learned what follows, and partly because there’s nowhere that Wall Street analysts would have learned it either. So while none of this is common knowledge, all of it is likely to result in a “surprising” shortfall in corporate earnings over the coming quarters.
Let’s start with a proposition that one can prove with simple (if tedious) arithmetic: every deficit of government (spending in excess of revenue) is matched by a surplus across other sectors – households, corporations, and foreign countries – where their income will exceed their consumption and net investment. The chart below shows what this looks like. I’ve excluded some very small payment items for simplicity, but the basic upshot is simple: every time the government runs a deficit, you’ll see it directly reflected in the sum of three surpluses: personal savings, retained corporate profits, and trade deficits (a surplus from the perspective of foreigners).
Think of it this way. What a government deficit does is to direct goods and services produced by other sectors of the economy toward consumption and investment (including transfer payments to individuals, subsidies to companies, and public infrastructure) that has been approved by Congress. In return, the sectors that produced those goods and services receive income for output that they did not consume. This private surplus takes the form of securities, and in equilibrium, those securities are exactly the same ones (Treasury debt and base money) that the government issued in order to finance the deficit.
The red line in the chart below is essentially the federal deficit as a share of GDP (including amounts spent on transfers to other sectors). The blue line is the sum of personal, corporate, and foreign surpluses. The two lines are mirror images of each other because this sort of equilibrium is just arithmetic.
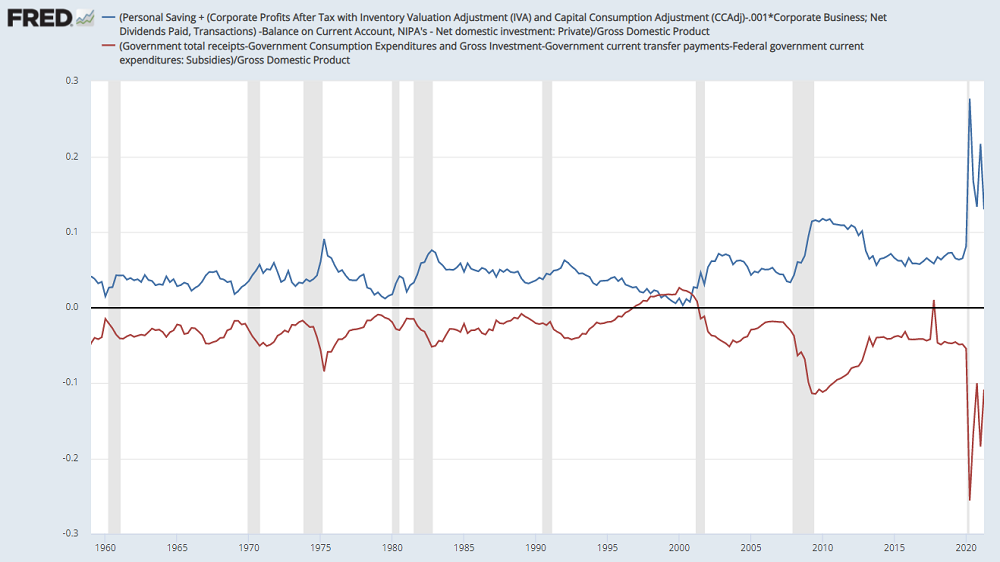
Data: Federal Reserve Economic Database
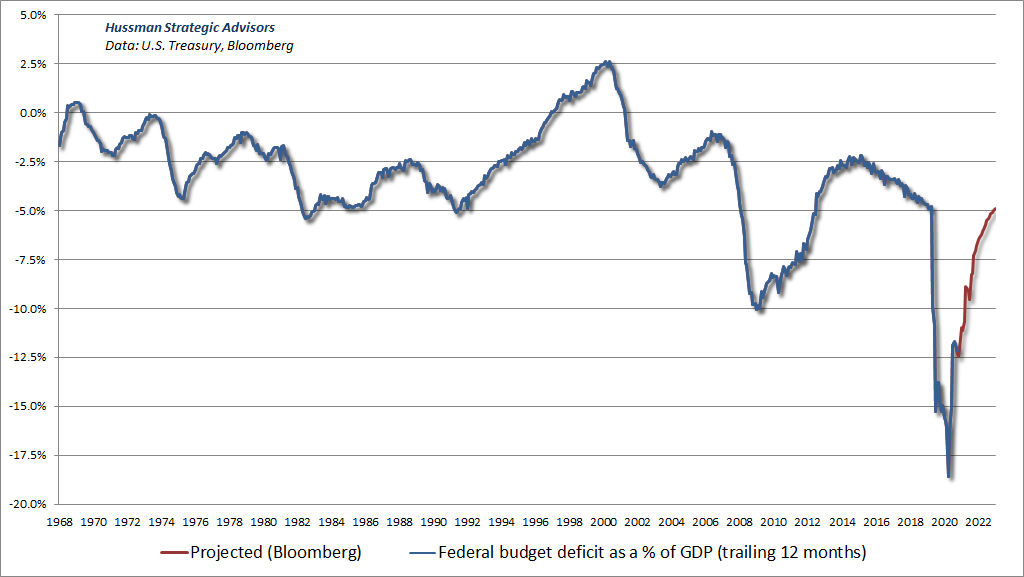
Already, investors may feel a bit sick here. See, the deficit that the U.S. government ran during the pandemic amounted to nearly 19% of GDP, and that – in equilibrium – is exactly why corporate earnings, personal savings, and trade deficits enjoyed a record surge in recent quarters. Meanwhile, the spending bills currently on the table ($1 trillion for infrastructure and $1.8 trillion for social and climate spending) are 8-10 year spending proposals, partially offset by revenue measures. There’s nothing in current legislation that’s going to replicate the breathtaking federal deficits we’ve seen in the past 18 months. That means – purely by the force of arithmetic – that the sum of those other three surpluses must shrink. The only question is which of the three will take that hit.
Notice that even if the government doesn’t run a deficit, any individual sector can still run a surplus to the extent that some other sector runs a deficit. So for example, corporations can accumulate earnings even without government deficits, provided that households or foreigners are going into debt.
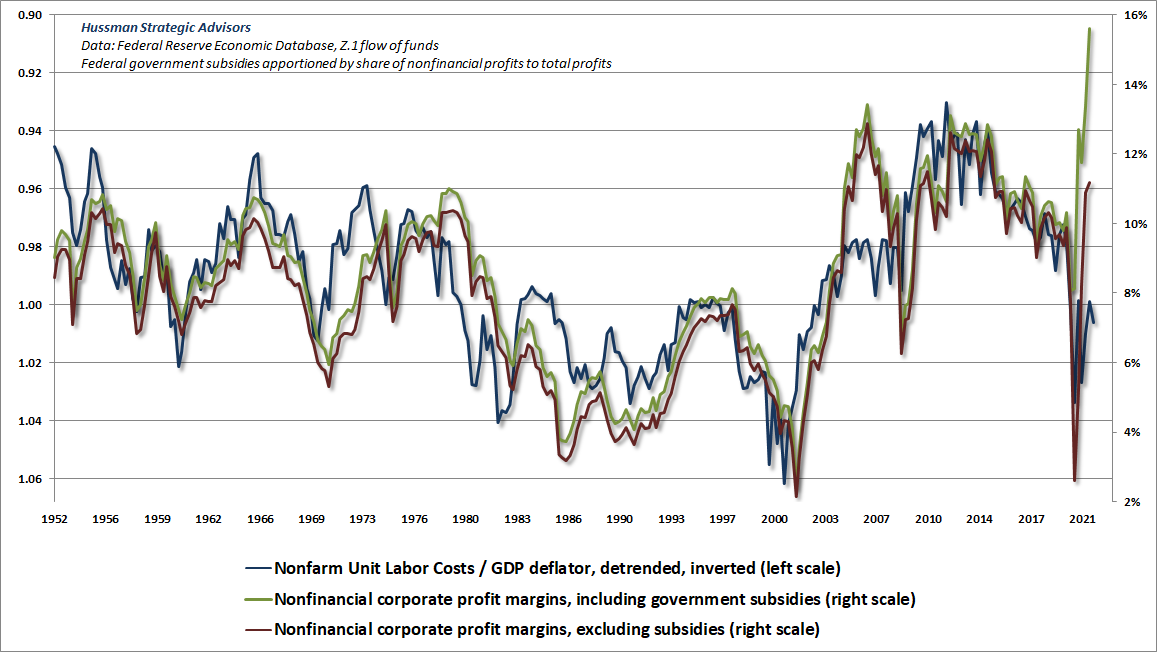
Unfortunately for workers, that’s exactly how corporations were able to enjoy high profit margins following the global financial crisis: the growth of unit labor costs (the compensation paid to labor per unit of output produced) was extraordinarily weak, so income that would have otherwise become personal savings instead became corporate profits.
Imagine you’re a company that produces one unit of output. If you can increase the price of that unit of output more than your costs go up, your profit margin will widen. Put another way, as your real unit labor cost declines, your profit margin increases. On the other hand, if unit labor costs accelerate faster than the rate of inflation – as they are now doing – profit margins are driven lower.
The record, historically oversized corporate profits that investors observe here are largely an artifact of record pandemic deficits, coupled with a long period of suppressed unit labor costs. In the coming quarters, those deficits won’t go to zero, but they’ll shrink substantially. At the same time, upward pressure on unit labor costs, if it continues, will limit the ability of corporations to shift surpluses away from workers and toward corporate profits.
In short, as the federal deficit narrows and unit labor costs increase, the two deficits that have contributed most to the corporate sector surplus in recent years will shrink. In equilibrium, the combined effect of smaller government deficits and rising unit labor costs is likely to hit corporate profit margins like a hammer.
The green line in the chart below is where we are. The blue line is where we’re probably headed. It’s certainly possible for margins to enjoy a period of strength when demand is at its peak (as we observed for several quarters in 2006 and 2007), but in general, profit margins largely follow real unit labor costs, and that’s clearly been true even in recent decades.
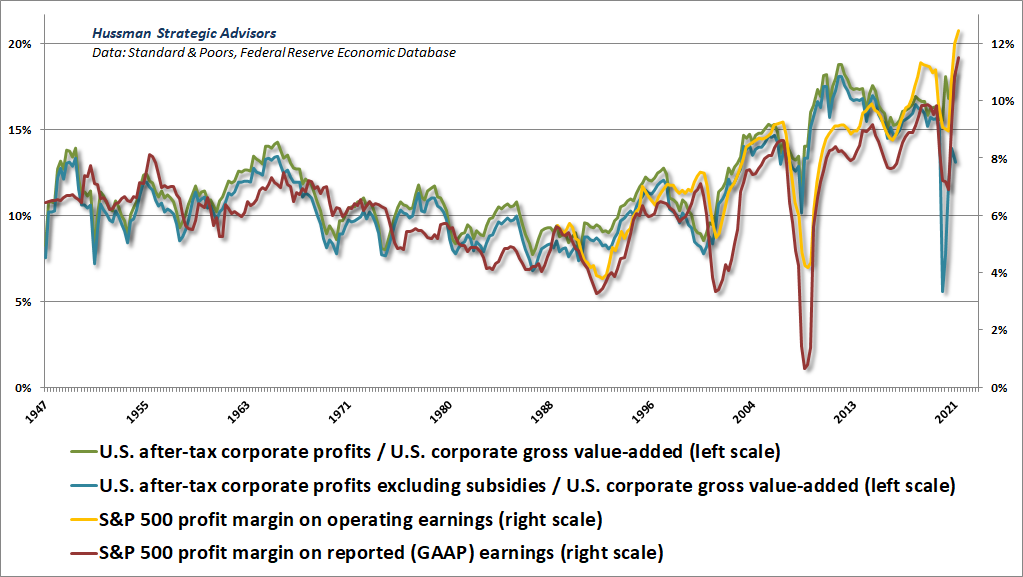
Oh, and it’s probably worth noting that while reported S&P 500 earnings (GAAP – generally accepted accounting principles) can be somewhat volatile, profit margins for the index are well-correlated with those of U.S. corporate profit margins as a whole. Figure that if operating margins retreat to about 9%, you’re looking at operating earnings of about $135 for the index, which would put the operating P/E at about 35 using current revenues and index levels. Do what you wish with that.
The Fed has learned nothing
John Bull can stand many things, but he cannot stand interest rates of two percent.
– Walter Bagehot, British Chancellor of the Exchequer, 1852
It’s remarkable over 150 years have passed since Walter Bagehot wrote Lombard Street, yet nothing has changed. When activist central bankers drive interest rates too low, yield-seeking speculation reliably follows. The only activities that can be done at 0% that can’t be done at 2% are: a) projects that are so unproductive that they can’t survive a higher hurdle rate, and b) speculative “carry trades” where interest is the primary cost of doing business.
When central bankers drive interest rates too low, yield-starved investors respond by searching for any risky security that will offer a “pickup” in yield. Wall Street responds by issuing more “product,” regardless of how sketchy those securities may be. Speculators have their day, and a collapse invariably follows. The Fed should have learned that during the mortgage bubble. The Fed has learned nothing. At every point that the Federal Reserve could have acted to limit the formation of a speculative bubble, it has doubled down instead.
This general lowering of standards by investment banking firms was due to two causes, the first being the ease with which all issues could be sold, and the second being the scarcity of sound investments to sell. Now they had to choose between selling poor investments or none at all – between making large profits or shutting up shop – and it was too much to expect from human nature that under such circumstances they would adequately protect their clients’ interests”
– Benjamin Graham & David Dodd, Security Analysis, 1932
Walter Bagehot is one of the great historical thinkers in monetary policy, famously setting out the fundamental principles of what a central bank should do:
- Ordinarily, as little as possible – “I shall have failed in my purpose if I have not proved that the system of entrusting all our reserve to a single board is very anomalous; that it is very dangerous; that its bad consequences, though much felt, have not been fully seen. We should try to reduce the demands on the Bank as much as we can. The central machinery being inevitably frail, we should carefully and as much as possible diminish the strain on it.”
- In a crisis – To lend freely, to solvent enterprises, on the basis of sound collateral, at sufficiently high interest rates to discourage unnecessary or precautionary borrowing.
Decades later, some of Bagehot’s prescriptions were written into the Federal Reserve Act, which is why much of Section 13 emphasizes that liquidity should be provided almost exclusively by purchasing government securities, and that even emergency lending to corporations should be for a short term, based on commercial or agricultural collateral “sufficient to protect taxpayers from losses” – never by taking corporate securities. The reason is simple – if the Fed was to purchase corporate securities and lose money, it would have effectively printed money to bail out private investors, without the constitutional spending authority of Congress.
Investors forget that the only reason the Fed was able to buy corporate debt during the pandemic (which it did to the tune of just $14 billion, in an economy with over $11 trillion in corporate debt), was because Congress explicitly allocated funds to the Treasury for emergency support of corporations, municipalities, and payroll protection loans. Maybe in the next collapse the Fed will find a way to circumvent the Federal Reserve Act, and the fiscal authority of Congress, and buy stocks as if they represent sound collateral. Don’t count on it. If they do, we’ll attend to valuations and market internals, without assuming any well-defined limit to speculation.
Even without evidence that activist departures from systematic policy rules (like the Taylor Rule) have a reliable and economically meaningful impact on real GDP growth or employment, it seems that Fed officials simply can’t resist the temptation of playing masters of the universe. As a result, they repeatedly create yield-seeking bubbles, and then pretend that they are helpless to stop them. I expect that this one, too, will collapse. We’ve learned not to fight yield-seeking speculation too much when our measures of market internals are favorable, for whatever reason, but from a public policy standpoint, it’s still distressing.
In fact, the Federal Reserve was helpless only because it wanted to be. Clearly the Federal Reserve was less interested in checking speculation than in detaching itself from responsibility from the speculation that was going on. And it will be observed that some anonymous draftsman achieved a wording that indicated that not the present level but only a further growth in speculation would be viewed with alarm. Never before or since have so many become so wondrously, so effortlessly, and so quickly rich. Perhaps Messrs. Hoover and Mellon, and the Federal Reserve were right in keeping their hands off. Perhaps it was worth being poor for a long time to be so rich for just a little while.
– John Kenneth Galbraith, The Great Crash – 1929
So here we are, at the highest point to-date of the most extreme speculative bubble in the history of the nation. In aggregate, there’s no “getting out” of stock, or cash, or bonds, or any other security – every share of stock that’s been issued has to be held by someone. Every dollar of base money created by the Fed has to be held by someone. Every bond certificate issued by a borrower has to be held by someone.
Securities aren’t aggregate wealth – they’re an asset to the holder and a liability of the issuer. They’re evidence of a past exchange, and a promise of future payments. Someone always has to hold the thing until it’s retired. The only thing the holder – or the series of holders – will get between now and then is the stream of cash flows that the security pays out over time. The wealth isn’t in the price. It’s in the cash flows.
One a security is issued, the price people attach to it has no effect on those cash flows. As Grantham observes, “How high the peak is has no bearing at all on what the fair value is.” When the prices collapse, what someone imagined to be “wealth” simply evaporates. Encouraging you to sell only means that someone else will end up holding the thing. So the only advice I can offer is that you think carefully about both return and risk; about what your spending needs are; about how much you can tolerate losing without distress. The losses themselves – to someone – are baked in the cake.
If you ask “what alternative do I have to zero-interest cash?” my answer is this: I expect that bonds and lowly, dismal T-bills will likely outperform stocks over the coming 10-20 years, and that’s a shame all around. I expect that the best refuge as the bubble collapses will be non-passive investment strategies: value-conscious hedged equity; full-cycle disciplines that have the ability to respond to changing market conditions; possibly managed futures on the commodity side. None of these are on anyone’s minds here. My impression is that flexible, hedged strategies will be important, because the prospective returns for passive approaches are likely to be worse than zero.
The Federal Reserve simply does not understand the risks of asset price bubbles and asset price collapses. It is clear from the data that they don’t get it. Greenspan could never make up his mind whether the market was overpriced – irrational expectations – or whether it was fine. Yellen couldn’t. Bernanke couldn’t see a housing bubble that was a 3-sigma 100-year event. Where were the statisticians? The answer is that the Federal Reserve statisticians do not do asset bubbles. They are, in that respect, utterly clueless – and we apparently never see that. We are willing to look through the crash of 2000, the housing crash – really dangerous affair – they didn’t do their duty, they didn’t head it off, they didn’t raise the limits for mortgages, they didn’t warn anybody, they allowed it to happen. Yes, they did pretty good in the decline. They were pretty good at applying bandages, and stimulus, and support for the wounded. But they sure as hell should not have allowed that housing bubble to occur.
They don’t get it. They don’t see the risks, and they don’t see them now. And so this time, we don’t just have a housing bubble. We have a housing bubble, a stock market bubble, a commodity bubble, and an interest rate bubble. This is going to be the biggest writedown.
– Jeremy Grantham, GMO, August 2021
An opportune moment
As I’ve regularly observed, the main difference between the current bubble and past market cycles is that once interest rates hit zero, historically reliable “overvalued, overbought, overbullish” syndromes became ineffective in signaling a limit to speculation – at least while our measures of market internals were favorable. Grantham is right – “We’ve checked off all the boxes. Now the question is how high is high?” Given the limited usefulness of overextended syndromes in recent years, we can’t answer that with any confidence. That said, Grantham’s comment about prices accelerating at the finale reminded me of Didier Sornette’s description of bubbles in their terminal phase: “the market return from today to tomorrow is proportional to the crash hazard rate. In essence, investors must be compensated by a higher return in order to be induced to hold an asset that might crash.”
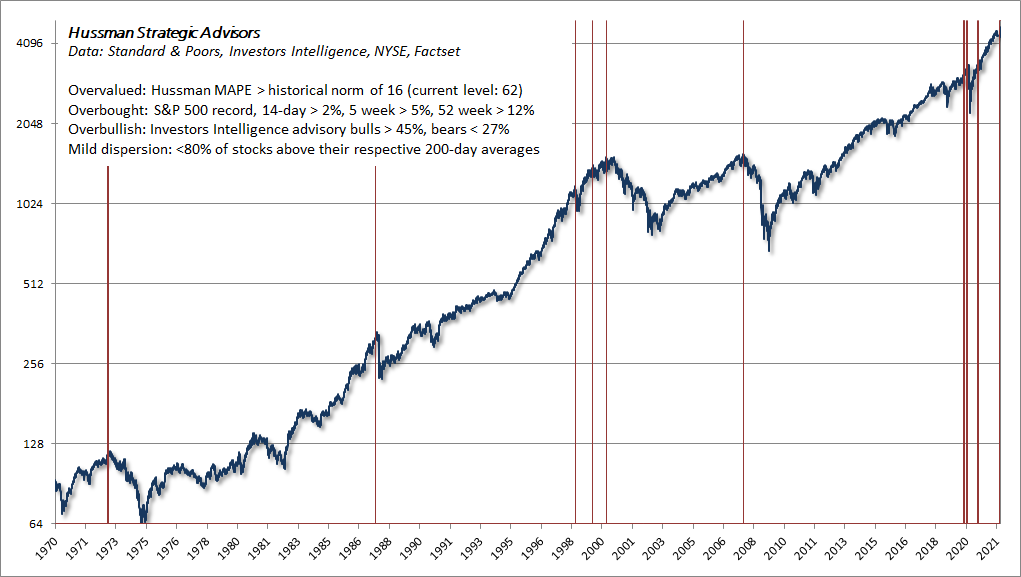
Given that we’ve seen a hockey-stick advance in recent weeks that has pushed the market toward or through its upper Bollinger bands at every resolution, even as our gauges of market internals remain divergent, I asked when in the past we’ve also observed record highs, valuations above their historical norms, overextended conditions featuring an accelerating rate of change (ROC) at multiple short-term resolutions, broadly bullish advisory sentiment, and at least mild dispersion in participation. The chart below is just a version of what I’ve often described as “overvalued, overbought, overbullish” conditions, but adding acceleration in the “overbought” component, and also requiring some degree of dispersion among individual stocks. I expected to see more instances, but here they are (for what it’s worth, even the instance in late-2020 was followed by a 10% market retreat).
Emphatically, nothing in our discipline presumes that this bubble cannot continue. We’ll respond to observable valuations, market internals, and other factors as they change, and an improvement in market internals here could defer our immediate (though not longer term) concerns. Still, in a bubble that’s already “checked all the boxes,” this may a particularly opportune moment to remember that, for disciplined investors, risk management is generous.
Keep Me Informed
Please enter your email address to be notified of new content, including market commentary and special updates.
Thank you for your interest in the Hussman Funds.
100% Spam-free. No list sharing. No solicitations. Opt-out anytime with one click.
By submitting this form, you consent to receive news and commentary, at no cost, from Hussman Strategic Advisors, News & Commentary, Cincinnati OH, 45246. https://www.hussmanfunds.com. You can revoke your consent to receive emails at any time by clicking the unsubscribe link at the bottom of every email. Emails are serviced by Constant Contact.
The foregoing comments represent the general investment analysis and economic views of the Advisor, and are provided solely for the purpose of information, instruction and discourse.
Prospectuses for the Hussman Strategic Growth Fund, the Hussman Strategic Total Return Fund, the Hussman Strategic International Fund, and the Hussman Strategic Allocation Fund, as well as Fund reports and other information, are available by clicking “The Funds” menu button from any page of this website.
Estimates of prospective return and risk for equities, bonds, and other financial markets are forward-looking statements based the analysis and reasonable beliefs of Hussman Strategic Advisors. They are not a guarantee of future performance, and are not indicative of the prospective returns of any of the Hussman Funds. Actual returns may differ substantially from the estimates provided. Estimates of prospective long-term returns for the S&P 500 reflect our standard valuation methodology, focusing on the relationship between current market prices and earnings, dividends and other fundamentals, adjusted for variability over the economic cycle.