

This Time Is Different, But Not How Investors Imagine It Is Different


John P. Hussman, Ph.D.
President, Hussman Investment Trust
November 2017
Note: We hope you like the new look of the Hussman Funds website. We’ve never been much for a corporate look, preferring a feel that’s both friendly and informative. After 25 years of using HTML, learning a new content-management system was like a massive game of “Where’s Waldo?” We’ve added a few new features, including a mailing list (100% spam-free) to notify readers of new content. Given the ability to notify readers in the event of new content and special updates, I’ve decided, after more than 30 years of weekly writing, to move my analysis and commentary to a monthly schedule. On a weekly schedule, very extensive research and discussion is too often immediately obscured by new content, while periods of unchanged market conditions can result in more repetition than may be useful. Since I regularly try to address themes and topics that are widely discussed in the financial markets, a monthly schedule will help to give those discussions greater exposure. There are also a couple of book projects that have been calling my name for well over a decade, so my hope is that the writing I don’t publish weekly will be the basis for more durable publications. In the event of significant market events, I expect to issue interim reports even mid-week if there’s something important to share. Thanks – JPH
Over time, price/revenue ratios come back in line. Currently, that would require an 83% plunge in tech stocks (recall the 1969-70 tech massacre). If you understand values and market history, you know we’re not joking.
– John P. Hussman, Ph.D., March 7, 2000
Based on the valuation measures we’ve found to be most reliably correlated with actual subsequent market returns in market cycles across history, including those of recent decades, we presently expect the average annual total return of the S&P 500 over the coming 10-12 year horizon to be negative. Market valuations, on these measures, presently approach or exceed the 1929 and 2000 extremes, placing U.S. equity market valuations at the most offensive levels in history. Indeed, with median valuations on these measures now more than 2.7 times their historical norms, there is strong reason to expect a market loss on the order of -63% over the completion of the current market cycle; a decline that would not even bring valuations below their historical norms (which we’ve typically seen by the completion of nearly every market cycle outside of the 2002 low).
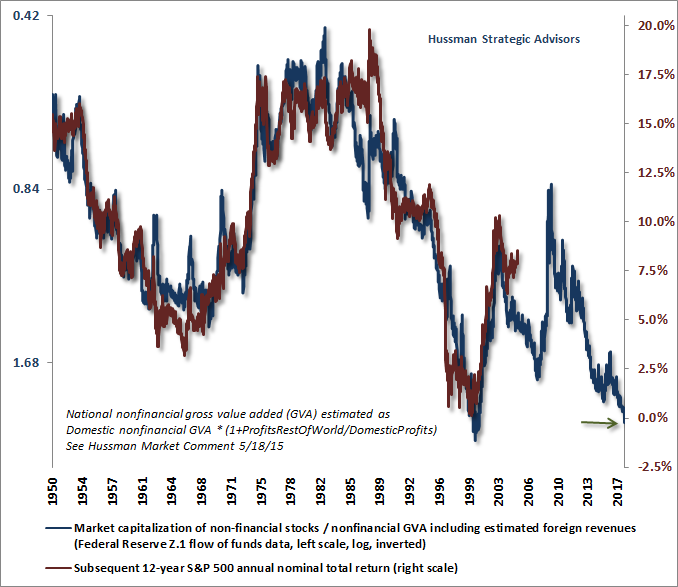
Let’s begin with our preferred valuation measure; the ratio of nonfinancial market capitalization to corporate gross value-added, which I introduced in 2015. The chart below shows MarketCap/GVA on an inverted log scale (blue line, left scale), along with the actual subsequent S&P 500 nominal average annual total return over the following 12-year period (red line, right scale). Note that the current level of valuations is now associated with an expected loss in the S&P 500 over this horizon, even including dividend income.
There are numerous alternative metrics peddled by Wall Street’s buy-side designed to assure investors that valuations are just fine. These need not cause confusion, provided that investors insist on asking two basic questions:
1) how closely are those alternative measures correlated with actual subsequent market returns in market cycles across history? In particular, examine the 10-12 year horizon (which is the point where the “autocorrelation profile” of valuations reaches zero, meaning that large deviations from normal valuations are typically resolved within that time frame);
2) is the fundamental being used a plausible “sufficient statistic” for the very, very long-term cash flows that stocks will deliver to investors over time? Analysts often use sketchy denominators like M2, marketable debt, or other figures that had a reasonably proportional relationship to GDP across most of history, but have exploded higher in recent years. Using these exploding denominators makes it appear that stocks are still “cheap” relative to those benchmarks, even if they have nothing to do with corporate cash flows.
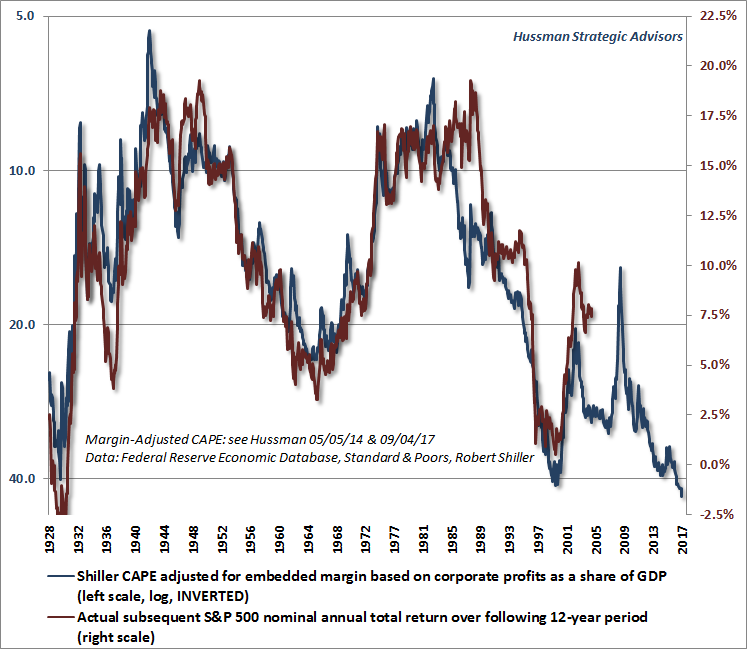
The next chart presents our Margin-Adjusted CAPE, again on an inverted log scale, along with the actual subsequent 12-year total return of the S&P 500. Here, we sacrifice just a bit of correlation in order to obtain a much longer perspective. Still, this measure is substantially better correlated with actual subsequent returns than the raw Shiller cyclically-adjusted P/E (CAPE). Again, nearly a century of evidence presently implies negative expected total returns for the S&P 500 over the coming 12-year period.
It’s certainly true that at the most extreme points of overvaluation (e.g. 2000, 2007, and today), market returns have typically overshot what one would have expected on the basis of valuations 12 years previously. It’s also true that at the most extreme points of undervaluation (e.g. 1949, 1974, and 1982), market returns have typically fallen short of what one would have expected on the basis of valuations 12 years previously. If one doesn’t think carefully about what’s going on, these apparent “errors” can encourage investors to dismiss the information from valuations at exactly the point that this information is needed most. So before assuming that valuations no longer “work” because recent 12-year returns have been higher than 2005 valuations would have indicated, notice that the same thing was true at those other extremes. Study the data carefully, and you’ll notice that market returns fell short of expectations for the 1937-1949, 1962-1974, and 1970-1982 period precisely because the endpoints were secular valuation lows. Market returns exceeded expectations for the 1988-2000, 1995-2007, and 2005-2017 periods precisely because the endpoints were speculative valuation extremes.
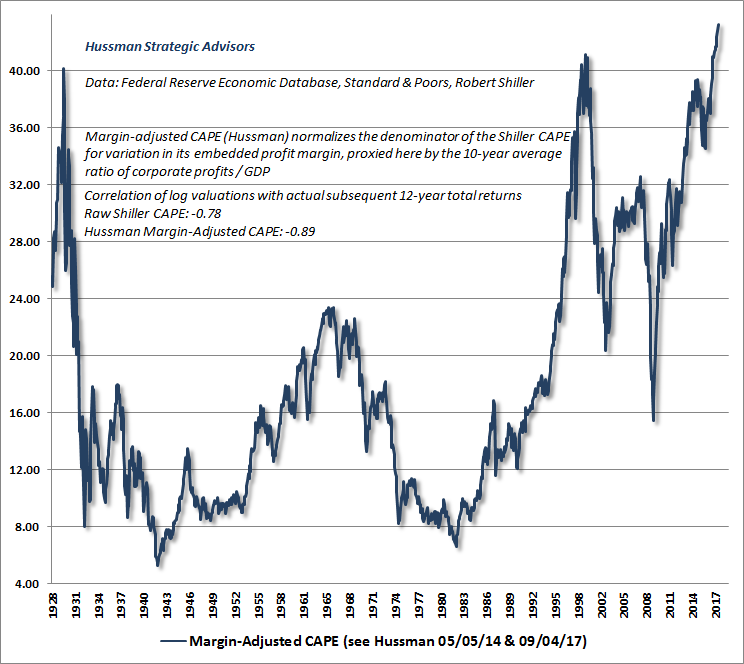
The chart below shows our Margin-Adjusted CAPE as of November 3, 2017. On this measure, market valuations are now more extreme than at any point in history, including the 1929 and 2000 market highs.
As I detailed last month, the extreme level of valuations cannot, in fact, be “justified” on the basis of depressed interest rates. One can understand this best by thinking carefully about discounted cash flows. Lower interest rates only justify higher valuations if the stream of future cash flows is held constant. But if interest rates are low because growth rates are also low, no valuation premium is “justified” at all. Indeed, one of the reasons why reliable valuation measures have retained such a high correlation with subsequent market returns across history, regardless of the level of interest rates, is that the impact of interest rates and growth rates on “terminal” valuations (that is, valuations at the end of the 10-12 year horizon) systematically offset each other. For example, when interest rates are low at the end of a given period, it’s also because nominal growth has also been low, so there’s no reason for valuations to deviate from historical norms.
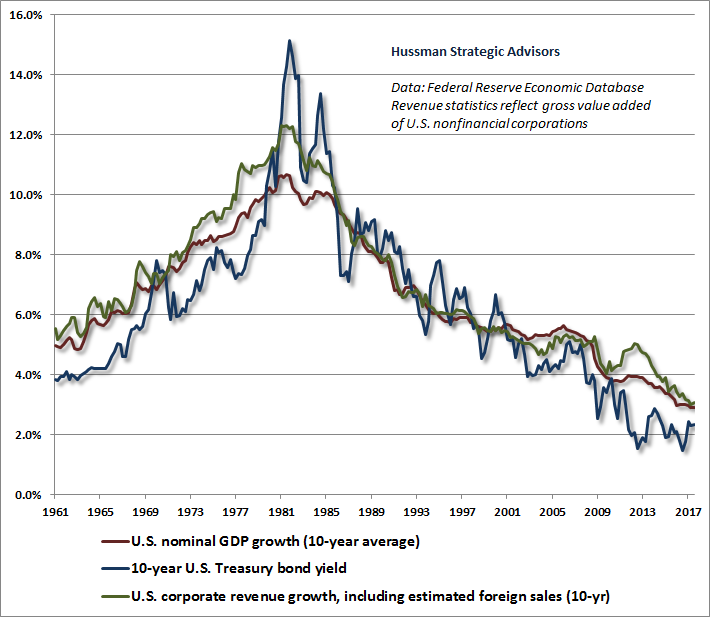
The chart below illustrates the interplay between economic growth rates, interest rates, and corporate revenue growth. Notice that interest rates and economic growth rates go hand in hand over extended periods of time. It would be one thing if interest rates were low and the growth rates of nominal GDP and corporate revenues were running at their post-war average of more than 6% annually. But that’s not the world we live in. Nominal growth is running at about half that rate, and investors are ignoring the basic principles of asset pricing by responding to low interest rates as if we lived in some alternate high-growth universe.
A quick note on economic growth prospects may be useful. On a forward-looking basis, remember that periods of rapid GDP growth have invariably emerged from two conditions: high unemployment, and reasonably balanced trade (a balanced or surplus position in the U.S. current account). High unemployment creates slack conditions that allow for rapid expansion in the labor component of GDP growth. A nearly balanced current account has also been important, because historically, substantial expansions in U.S. gross domestic investment have always been financed by the “import” of foreign saving and an “export” of U.S. securities. The arithmetic of international accounting is simple: for every dollar of goods and services we import from other countries, we have to export one dollar of “stuff” in return. If we export more securities for every dollar of imports, it follows that we export fewer goods and services for that dollar of imports. The bottom line is that booms in U.S. gross domestic investment are typically financed with foreign savings, obtained through the export of U.S. securities, resulting in “deterioration” in the U.S. trade balance. Last month’s comment shows a chart to illustrate this fact.
Presently, we observe an unemployment rate of just 4.1%, coupled with demographic factors that will sharply constrain labor force growth in the coming decade even if unemployment remains at current levels. Even the U6 unemployment rate (which includes “discouraged” workers) now matches the lowest level observed in the 2002-2007 economic expansion. Combined with a huge current account deficit and a persistent slowing of productivity growth, average real GDP growth is likely to average less than 2% annually over the coming decade (despite the current euphoria over 2.3% growth during the past year). When one actually examines the drivers of economic growth, most of which are baked in the cake (like low unemployment, low population growth and an aging workforce that contributes to reduced labor force participation), it becomes clear that altering that arithmetic is highly unlikely.
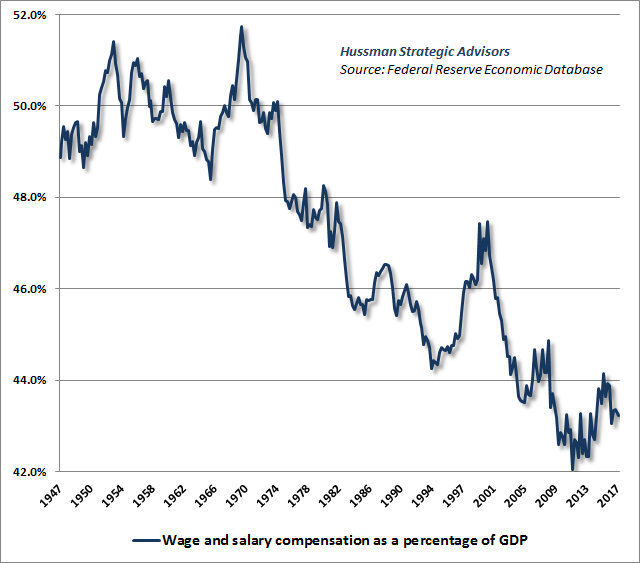
On the subject of profit margins, it’s important to recognize just how dependent elevated profit margins are on maintaining permanently depressed wages and salaries, as a share of GDP. The global financial crisis produced high unemployment, massive job losses, and a reluctance of workers to negotiate for higher wages, which combined to produce a steep retreat in the labor share of the economy. The chart below illustrates that retreat, which has been gradually reversing in recent years, though in fits and starts.
The tight relationship between corporate profit margins and the labor share is not nearly as well-recognized (or alternatively, is dismissed by imagining that the FAANG companies – Facebook, Apple, Amazon, Netflix, and Google – represent 100% of the economy, when in fact their combined revenues represent less than 3% of GDP). The chart below shows employee compensation as a share of GDP (left scale), along with corporate profit margins on an inverted right scale. The margin calculation reflects the profits of U.S. corporations, divided by their gross value-added, including estimated foreign revenues.
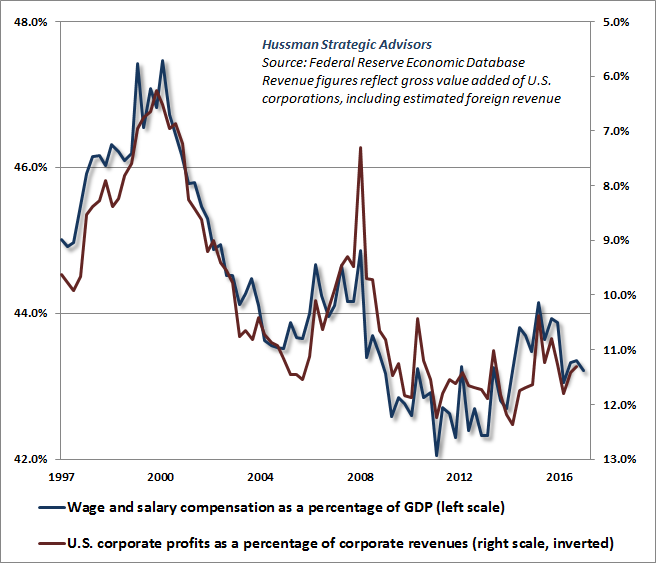
Simply put, elevated corporate profit margins are the precise mirror-image of depressed labor compensation. The U.S. corporate sector isn’t profitable because it has become vastly more productive, but rather because the aftermath of employment losses during the global financial crisis allowed the distribution of income to become markedly inequitable. That situation is unlikely to be permanent in an environment of constrained labor force growth and 4.1% unemployment. Moreover, remember that it takes rising margins for earnings to grow faster than revenues, and room for margin expansion that existed at the 2009 lows has already been eliminated. Even if profit margins remain constant at permanently elevated levels, future earnings growth will not materially exceed nominal growth in GDP and corporate revenues, both which are running at rates of scarcely 3% annually.
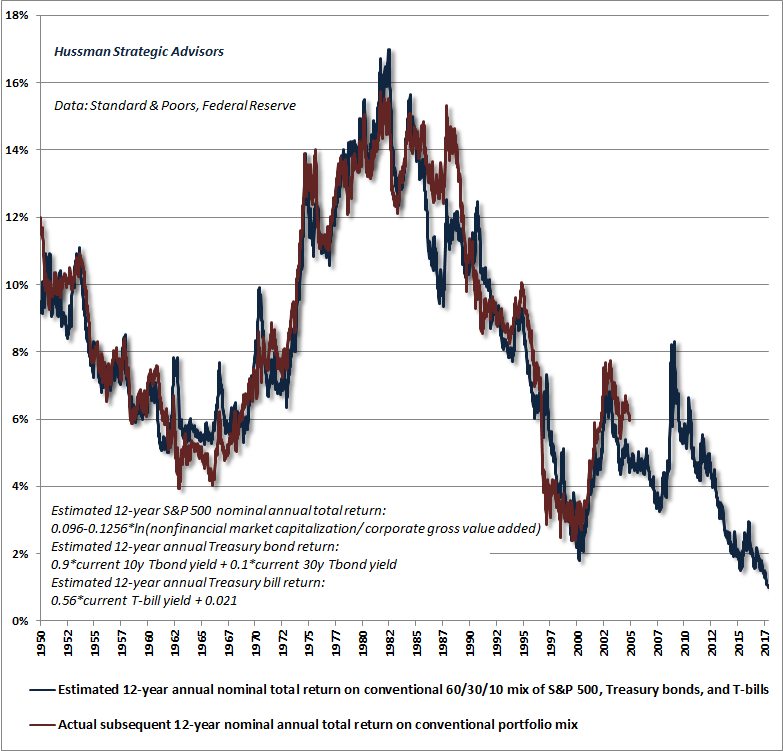
Coming back to the level of interest rates, a careful examination of asset pricing and historical evidence should convince investors that low interest rates aren’t a promising feature of the investment landscape at all, but instead add a rather devastating feature. That’s because, with the S&P 500 at valuations that imply negative total returns over the coming 10-12 years, any residual expectation for investment returns from passive portfolios must rely largely on interest income. The chart below shows our estimate of 12-year total returns for a conventional portfolio mix invested 60% in the S&P 500, 30% in Treasury bonds, and 10% in Treasury bills. The red line shows actual subsequent 12-year total returns on this portfolio mix. Our estimate of prospective long-term returns for a conventional, passive portfolio mix has declined to the lowest level in history. In my view, the rush from active to passive portfolio strategies is a striking form of performance chasing and rear-view mirror investing.
Neutral, with a wicked left tail
Despite these brutal long-term and full-cycle expectations for the S&P 500, our immediate outlook is actually quite neutral. Even for investors who are willing to accept some risk of near-term loss in order to pursue gains over the downside completion of this cycle, we would be inclined to set strike prices, tail-risk hedges, and safety nets at least several percent below current levels. The reason is that speculators again have the bit in their teeth, which we infer from the behavior of market internals. As I noted last month:
“Based on the consensus of the most historically-reliable market valuation measures we identify, the U.S. equity market is now at the most offensive level of overvaluation in history, exceeding even the levels observed in 1929 and 2000. Because investors appear to have a speculative bit in their teeth, our very near-term outlook is rather neutral, allowing for both further speculation and abrupt market losses. As I noted a few weeks ago, I view hedges and safety nets as essential here, but there’s no need to ‘fight’ a continued advance, if it emerges, with even larger hedges or higher safety nets. With the S&P 500 likely to lose more than -60% by the completion of the current market cycle, it will be fine if the initial few percent lower do nothing for us.
“Don’t confuse the extreme nature of our market loss projections with a requirement that they must be immediate. My expectation is that the initial market losses will be strikingly abrupt, in the sense that the first whack will emerge seemingly out of the blue. I also expect that the initial decline will immediately wipe out any residual gains the market may enjoy from current levels. Still, given the speculative bit that investors seem to have in their teeth here, an element of our patience involves the willingness to tolerate any residual advance without raising safety nets further.”
So while we expect this speculative episode to give way to a rather severe initial leg down, we can’t gauge the timing, and unfortunately, even the most extreme “overvalued, overbought, overbullish” syndromes have been of little use in the recent advancing half-cycle. The good news is that put option time-premium is historically cheap, particularly in light of the current valuation extremes. Yet remarkably, speculators have chosen to collect themselves into a massive version of what AIG became just before the global financial crisis, aggressively selling downside insurance in the attempt to pocket the option premiums, because they can’t imagine that anything could go wrong with that plan.
Despite these brutal long-term and full-cycle expectations for the S&P 500, our immediate outlook is actually quite neutral.
The most historically reliable valuation measures are obscene here. We expect the market to lose nearly two-thirds of its value by the completion of this cycle, while still posting negative total returns over the next 10-12 years. In my view, Wall Street is completely out of its gourd. Research, evidence, and historically-informed analysis can fight ignorance only when people value knowledge. The problem is that human beings are wired to chase what they associate with pleasure, and to shun what they associate with discomfort. Recall the dot-com bubble. Recall the housing bubble. Investors, given enough pleasure in the moment, will find rationalizations that allow them to maintain ignorant bliss, even if the long-term consequences are repeatedly devastating.
The more investors speculate, the more they tend to become impressed by the outcomes of their own speculation, which temporarily results in self-reinforcing bubbles. Prior market cycles offered extremely useful signals before that self-reinforcing process collapsed. This cycle was different, and our reliance on those same signals resulted in quite a bit of pain. Let’s briefly examine what happened, how we adapted, and how we expect to navigate the inevitable collapse of the current episode.
Valuations, market internals, and overextended syndromes
At every market extreme, investors are tempted to abandon historically reliable measures of valuation. The points where valuations are most extreme are also the points where investors are most convinced that valuations are irrelevant. The reason is that even though certain valuation measures are tightly correlated with actual subsequent market returns over a 10-12 year horizon, and even with prospective market losses over the completion of any given market cycle, valuations have very little to do with market outcomes over shorter segments of the market cycle.
If overvaluation was immediately resolved by market losses, and undervaluation was immediately resolved by market gains, investors would never have observed the extraordinary undervaluation of 1949 and 1982, for example, nor the breathtaking overvaluation of 1929, 2000, and unfortunately from a long-term perspective, today. For valuations to “work” over the long-run, and yet allow for periods of extreme over- and under-valuation, there must be segments of the market cycle where valuations are utterly uninformative about market returns.
What matters over those shorter segments of the market cycle is much more psychological in nature, and involves whether investors are inclined toward speculation or toward risk-aversion. When investors are inclined to speculate, they tend to be indiscriminate about it. So historically, we find that the most reliable measure of investor preferences is the uniformity or divergence of market action across a wide range of individual stocks, industries, sectors, and security-types, including debt securities of varying creditworthiness. Over the past three decades, I’ve described these conditions with phrases like “trend uniformity” or “market internals.” To capture these conditions, our own methods reflect the joint signal extracted from the behavior of thousands of individual securities.
Importantly, uniformity or divergence of market internals is best viewed as a feature of present, observable market conditions, not a forecast of future ones. That is, given uniformity or divergence today, there’s no assurance that those conditions will persist into the future. Rather, uniformity is a signal that is extracted at each point in time, and indicates that for the moment, investors are inclined toward speculation or risk-aversion. The approach to market internals is much like pitching one’s sails based on the direction of the wind. As long as the wind doesn’t shift persistently and randomly, being aligned with prevailing conditions is enough.
A third consideration is that once prevailing trends become strenuously overextended, a rather severe initial move is sometimes required in order to identify a clear shift in market internals. So historically, measures of “overextension” have also been useful. In prior market cycles across history, one of the most useful measures we identified was based on the simultaneous emergence of extreme overvaluation, extremely overextended price behavior, and extremely lopsided bullish sentiment. These “overvalued, overbought, overbullish” syndromes regularly acted as an early-warning signal that market internals were likely to collapse abruptly. Those three primary considerations: 1) valuation, 2) the uniformity or divergence of market internals, and 3) the presence or absence of “overvalued, overbought, overbullish” extremes, served us remarkably well in complete market cycles
In 2009, after a market collapse that we had anticipated, I insisted on stress-testing our methods against Depression-era data because the economic fallout was unlike anything observed in the post-war period. The resulting methods performed even better than our pre-2009 methods in market cycles across history, but in the advancing half-cycle since the 2009 low, one single feature of the post-2009 methods turned out to be our Achilles Heel. Our methods gave those “overvalued, overbought, overbullish” syndromes priority, ahead of the uniformity or divergence of market internals, because of their reliability in other cycles across history. If those syndromes were extreme enough, they could encourage a hard-negative market outlook even if market internals had not yet deteriorated.
Unfortunately, this cycle was different than others across history. In the face of Fed-driven yield-seeking speculation and the novelty of zero interest rate policies, investors continued to speculate long after even extreme “overvalued, overbought, overbullish” syndromes emerged. In 2014, we introduced an adaptation: if zero interest rates are present, market internals have to be prioritized ahead of overextended syndromes, which means refraining from a hard-negative outlook in zero-interest rate environments as long as market internals remain uniformly favorable. That single adaptation would have been sufficient to dramatically change our experience in the advancing half-cycle since 2009.
Earlier this year, we raised the priority of market internals even further, so that they take precedence over “overvalued, overbought, overbullish” features of market action even when interest rates are above zero. This brought our treatment of “overvalued, overbought, overbullish” syndromes back to our pre-2009 practice: 1) if internals are still favorably uniform, these syndromes act as a signal to back off from a constructive outlook to a neutral outlook, but 2) the syndromes act as a warning signal justifying a hard-negative market outlook only if market internals are also unfavorable.
Put simply, we relied too heavily on “overvalued, overbought, overbullish” syndromes that had been reliable in prior market cycles, but were nearly useless in an environment where relentless speculation was encouraged by zero interest rates. I don’t hesitate to admit that stumble, but it’s equally important to emphasize what we’ve done to address it.
The chart below shows the relative impact of the adaptations we’ve made, and illustrates the main source of our difficulty in the half-cycle since 2009. Each line shows the cumulative total return of the S&P 500 under various unfavorable market conditions we define, in data since 1940. They reflect purely historical data, are not the results of an actual portfolio, and there’s no assurance that future market outcomes will match historical ones.
The blue line shows the total return of the S&P 500 in periods where the “ensemble” methods that came out of our 2009-2010 stress-testing effort defined a negative market return/risk classification. Notice that once the Fed expanded its program of quantitative easing in 2010, the behavior of the market under these classifications changed dramatically. Unlike prior cycles, investors continued to speculate even after extreme “overvalued, overbought, overbullish” conditions emerged.
In mid-2014, we made an important adaptation, which is reflected in the difference between the blue line and the red line. The key adaptation was that if “overvalued, overbought, overbullish” syndromes emerge in the presence of zero interest rates, hard-negative return/risk classifications are ruled out until market internals deteriorate explicitly. The red line shows the impact of that adaptation.
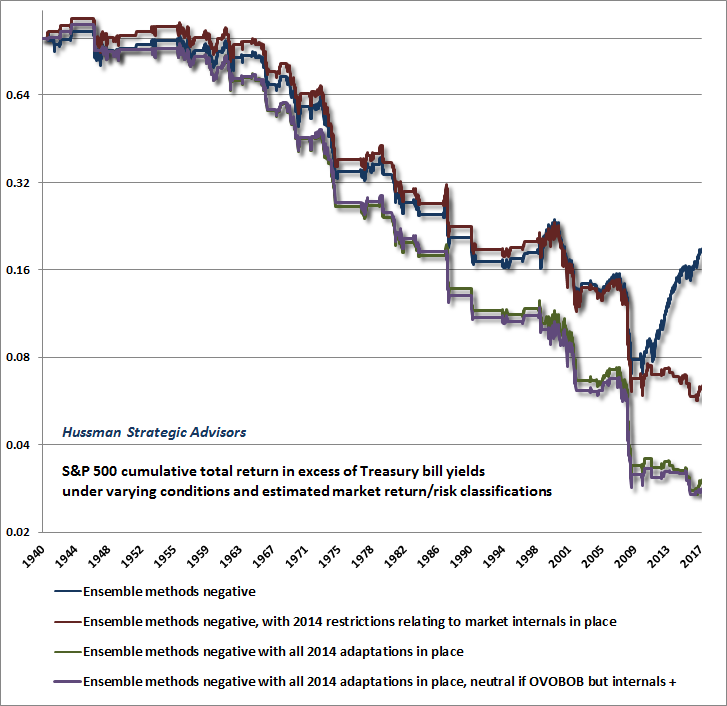
The lower, green line shows the impact of the full set of adaptations we introduced in mid-2014. Still, notice that there’s a little upward tail at the end of those red and green lines since 2014. On a log-scale, those advances don’t look like much, particularly in the context of history, but they actually represent a nearly 20% market advance that occurred in periods where interest rates were no longer at zero, yet those extreme syndromes were also in place. The purple line adds the extension we imposed earlier this year, which rules out hard-negative return/risk classifications whenever market internals are uniformly favorable, even if interest rates are above zero. Historically, that extra restriction on “hard-negative” outlooks wouldn’t have had much effect. Presently, however, it does keep us from “fighting” the market while market internals are favorable, limiting our outlook to neutral until market internals deteriorate, regardless of how extremely overextended the market becomes.
That’s exactly why our immediate outlook is neutral here, and why we would place safety nets and tail-risk hedges several percent below current levels, despite what regard as obscenely overvalued, overbought, and overbullish conditions (notably, advisory bullishness climbed last week to an extreme not seen since just before the 1987 crash).
The upshot is that zero interest rates or not, and no matter how extreme “overvalued, overbought, overbullish” conditions become, we expect to confine future “hard-negative” market outlooks to periods where market internals have also deteriorated explicitly. That doesn’t actually make us constructive here, but it’s why our immediate outlook remains rather neutral despite wicked overvaluation.
This time is different, but not how investors imagine it is different
As noted above, we embrace the idea that “this time is different,” but we dramatically differ with Wall Street on which aspect of the financial markets is actually different. In our view, there’s no evidence of deterioration in the reliability of the most historically useful valuation measures. True, market returns over the past 12 years are higher than one would have projected 12 years ago, but that’s precisely because current valuation extremes are so offensive. We observed exactly the same “overshoot” in the 12 year period from 1988 to 2000, for precisely the same reason, followed by a decade of negative total returns for the S&P 500.
Likewise, this time isn’t “different” because low interest rates somehow justify current valuation extremes. As I detailed last month, depressed interest rates are associated with similarly depressed prospects for U.S. economic growth; a combination that “justifies” no valuation premium at all. Neither low interest rates, nor cyclically-elevated profit margins, nor central bank policies will sustain current extremes permanently.
Instead, what’s “different” about “this time” is purely psychological, driven by:
1) the novelty of central bank interventions and the recent experience of zero-interest rates, which encouraged the belief that there was no alternative to buying riskier assets, no matter the price;
2) the fallacy that low interest rates “justify” arbitrarily high valuations even if economic growth rates are commensurately low, and;
3) the belief that elevated profit margins (largely a creature of depressed wage growth following extreme job losses in the global financial crisis) will be a permanent feature of the economic landscape, despite an unemployment rate that now stands at just 4.1%.
Given this belief system, encouraged by the novelty of zero-interest rates, not even the most extreme “overvalued, overbought, overbullish” conditions have been enough to derail the speculative inclinations of investors. Yet in most other ways, this speculative episode is simply a more extreme variant of others that have come before it, particularly the advances that ran to the 1929 and 2000 valuation extremes. In those episodes, as in this one, favorable market internals are serving, as they should, as the observable signature of a temporary speculative mood and a temporary willingness to ignore valuations.
We expect the stock market to lose nearly two-thirds of its value over the completion of this market cycle. We also expect the S&P 500 to lose value, even after dividends, over the coming 10-12 year period.
Unfortunately, valuation extremes and speculative moods are always impermanent, and there’s every reason to expect current extremes to be followed by more than a decade of negative S&P 500 total returns. It’s that failure to distinguish temporary returns from durable ones that will likely end with most investors surrendering every bit of return they’ve enjoyed since 2000. Indeed, by the completion of the current cycle, I expect the S&P 500 to surrender its entire total return, in excess of Treasury bills, all the way back to roughly October 1997; an expectation that would not even require the most reliable valuation measures we identify to breach their historical norms.
Make no mistake – valuations are already offensive, and we expect that more extreme valuations will only be met by more severe losses. We expect the stock market to lose nearly two-thirds of its value over the completion of this market cycle. We also expect the S&P 500 to lose value, even after dividends, over the coming 10-12 year period. If the market advances further, it will not be evidence that valuations don’t matter, but only that they temporarily don’t matter while investors are enthralled with the positive outcomes of their own speculation. That will change when market internals deteriorate again (which unfortunately may not be obvious until after a steep initial leg down). Still, we’ve given up the expectation that extreme “overvalued, overbought, overbullish” syndromes will offer useful warning of that shift. It’s enough to be neutral here. With that, further speculation in a wickedly overextended market may not help us much, but it shouldn’t hurt us much either. In the meantime, my honest opinion is that Wall Street has gone completely mad.
Valuations and prospective full-cycle losses
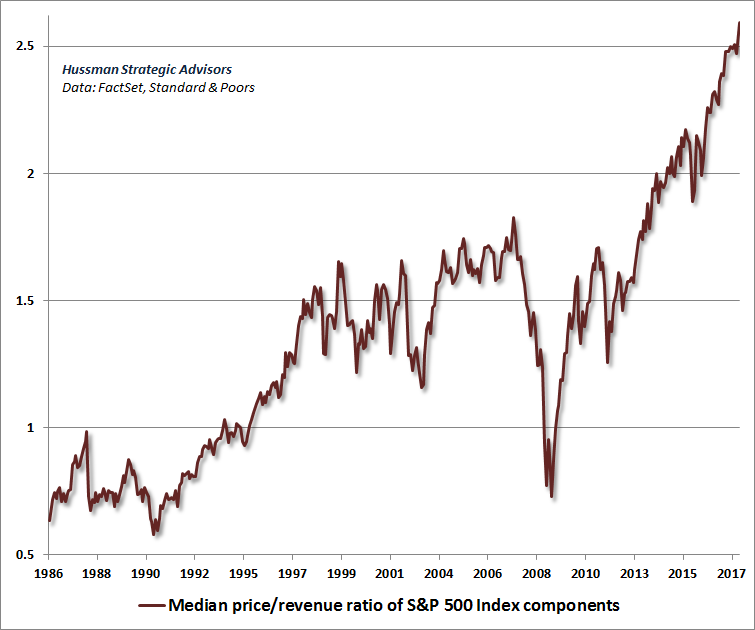
Finally, it’s important to reiterate that unlike the 2000 valuation extreme, which was largely focused on a subset of extremely overvalued technology stocks, the current market extreme is the broadest episode of extreme equity market overvaluation in history. The chart below shows the median price/revenue ratio of S&P 500 component stocks, which set yet another record high in the week ended November 3, 2017, and now stands more than 50% above the 2000 extreme.
The chart below shows the price/revenue ratios of S&P 500 component stocks by decile. Notice that in 2000, the top decile easily represented the most extreme segment of the market, while nearly 50% of S&P 500 component stocks were actually at levels that we viewed as reasonably valued. The scope of overvaluation is far broader today.
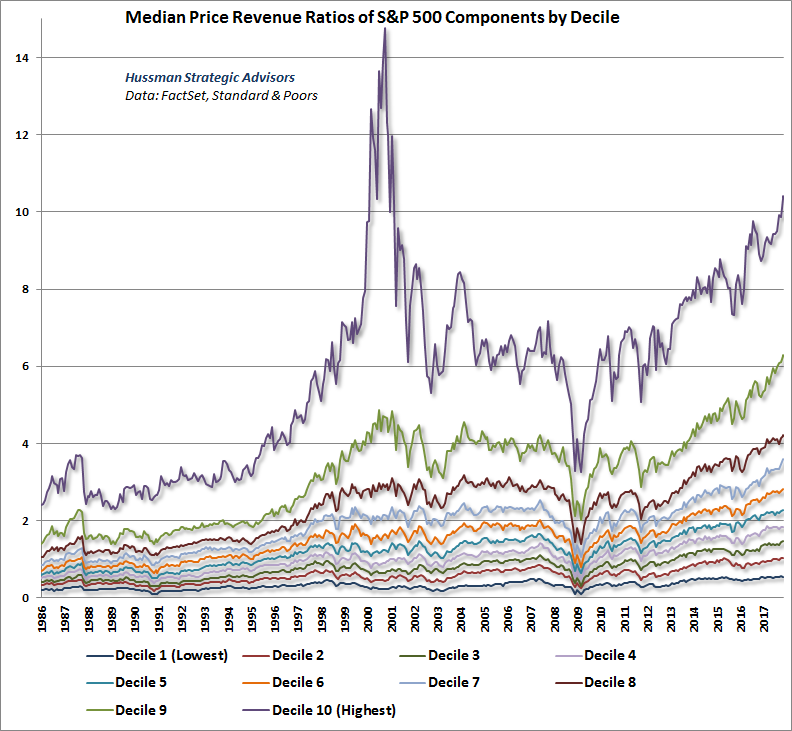
As I’ve previously observed, being in a high price/revenue decile doesn’t necessarily imply that a given stock is overvalued, and being in a low decile doesn’t necessarily imply that a given stock is undervalued. For example, technology and medical companies will often dominate high price/revenue deciles, while retail and industrial stocks will often dominate the lower deciles, and it’s not necessarily true that lower deciles perform better than higher deciles, taken as a group. Rather, what matters most for the likely subsequent returns and downside risks of each decile is its level of valuation relative to its own respective history.
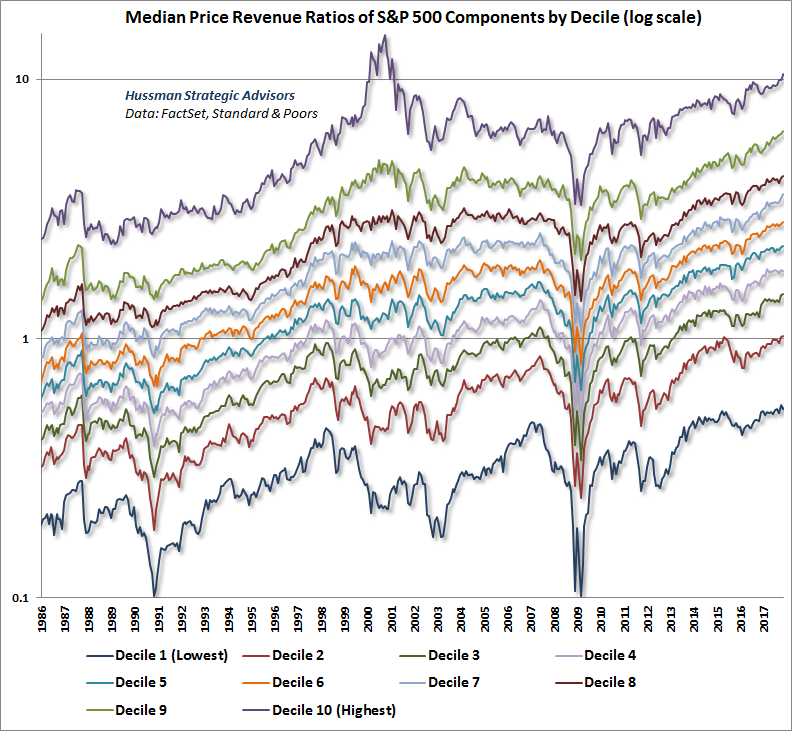
To show this history more clearly, the chart below shows median price/revenue ratios by decile, on a log scale. Notice that current valuations exceed the 2000 extreme for all but the highest decile, which in 2000 was largely comprised of glamour technology stocks.
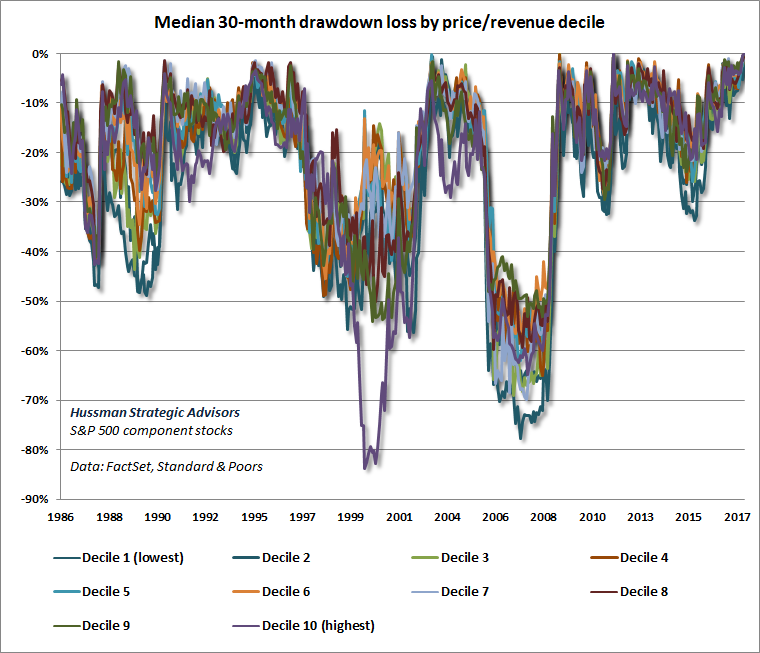
The final chart is a reminder of how these speculative episodes end. In 2000, most deciles experienced losses on the order of 30-50%, with the exception of the hypervalued top decile represented, at the time, by technology stocks. In March 2000, I wrote “Over time, price/revenue ratios come back in line. Currently, that would require an 83% plunge in tech stocks (recall the 1969-70 tech massacre). If you understand values and market history, you know we’re not joking.”
As it happened, the tech-heavy Nasdaq 100 lost an oddly precise -83% from its March 2000 high to its October 2002 low. You can see a similar loss in the purple line, which represents that hypervalued top decile of stocks. By comparison, the overvaluation of the market was more “democratic” at the 2007 peak, so all deciles experienced severe losses, typically on the order of -50% to -60%. At present, my concern is that given current valuation extremes, the range of probable losses over the completion of the market cycle is on the order of -55% to -70% for every one of these deciles.
It’s clear from market internals that investors again have the speculative bit in their teeth. What’s important, however, is to distinguish near-term speculative outcomes from longer-term investment outcomes. If history is any guide, the first leg down from the current speculative blowoff is likely to be abrupt and rather vertical. Investors will be tempted to buy into that decline, and may very well be rewarded for it over the shorter-run. The problem is that while investors are reluctant to sell into strength here, they may also have no tolerance for selling into a market loss once internals break down. Instead, they will likely pass up their opportunity to reduce exposure to market losses even after market internals deteriorate clearly. After that, the intermittent hope from fast, furious (but ultimately failing) rallies will likely encourage them to hold on all the way into a deep market collapse. That’s how severe market declines unfold.
For our part, we don’t require a retreat to historical valuation norms in order to embrace a constructive market outlook. The most favorable market return/risk profiles we identify are associated with material retreats in valuation that are then joined by early improvement in our measures of market action. Those valuation retreats don’t have to establish historical undervaluation, but we do require some amount of retreat. Most likely, the full completion of this cycle will include periods where we can adopt a constructive outlook to one degree or another along the way, possibly maintaining a safety net using index put options to cover the potential for abrupt reversals.
As always, we’ll take our evidence as it arrives. Meanwhile, recognize that for over three decades, constructive and even leveraged investment outlooks have been important elements of our value-conscious, historically-informed investment discipline. If my work in complete market cycles until 2009 looks glorious, but the recent half-cycle looks disappointing, know that we’ve made key adaptations that address main feature that was legitimately “different this time.” My incorrectly tagged reputation as a “permabear” is undoubtedly my own doing, given my admitted stumble in the recent half-cycle. But market conditions will change, and the reality of things will become clear. For now, it’s enough to refrain from capitulating at record valuations. There’s no need to take a hard-negative outlook here, but don’t allow impatience, fear of missing out, or the illusion of permanently rising stock prices to entice you into entrusting your financial future to the single most overvalued market extreme in history.
Note: For more on price/revenue ratios, we’ve reprinted Bill Hester’s article on the subject from 2007, just before the global financial crisis. I’ve added a brief epilogue at the end. Our hope is that this work encourages investors to review their risk exposures and tolerances in a historically-informed way.
Keep Me Informed
Please enter your email address to be notified of new content, including market commentary and special updates.
Thank you for your interest in the Hussman Funds.
100% Spam-free. No list sharing. No solicitations. Opt-out anytime with one click.
By submitting this form, you consent to receive news and commentary, at no cost, from Hussman Strategic Advisors, News & Commentary, Cincinnati OH, 45246. https://www.hussmanfunds.com. You can revoke your consent to receive emails at any time by clicking the unsubscribe link at the bottom of every email. Emails are serviced by Constant Contact.
The foregoing comments represent the general investment analysis and economic views of the Advisor, and are provided solely for the purpose of information, instruction and discourse.
Prospectuses for the Hussman Strategic Growth Fund, the Hussman Strategic Total Return Fund, the Hussman Strategic International Fund, and the Hussman Strategic Dividend Value Fund, as well as Fund reports and other information, are available by clicking “The Funds” menu button from any page of this website.
Estimates of prospective return and risk for equities, bonds, and other financial markets are forward-looking statements based the analysis and reasonable beliefs of Hussman Strategic Advisors. They are not a guarantee of future performance, and are not indicative of the prospective returns of any of the Hussman Funds. Actual returns may differ substantially from the estimates provided. Estimates of prospective long-term returns for the S&P 500 reflect our standard valuation methodology, focusing on the relationship between current market prices and earnings, dividends and other fundamentals, adjusted for variability over the economic cycle.