
Navigating the Speculative Id of Wall Street


John P. Hussman, Ph.D.
President, Hussman Investment Trust
December 2017
Illusions commend themselves to us because they save us pain and allow us to enjoy pleasure instead. We must therefore accept it without complaint when they sometimes collide with a bit of reality against which they are dashed to pieces.
– Sigmund Freud
At present, the valuation measures that we find best correlated with actual subsequent S&P 500 total returns are at the most offensive levels in history, matching or eclipsing the 1929 and 2000 extremes. Even considering the level of interest rates, economic growth, and other factors, the S&P 500 currently stands about 2.8 times the level that we believe the index will revisit over the completion of the current market cycle, implying an interim market loss something on the order of -64%. Moreover, the most reliable valuation measures uniformly imply the likelihood of negative total returns in the S&P 500 over the coming 10-12 year period.
I’m not saying that Wall Street is misguided to believe that stocks are appropriately priced here. I’m saying that Wall Street is spectacularly misguided in that belief. The main factor with the capacity to support stock prices here is the psychological inclination of investors to speculate. When investors are inclined to speculate, they tend to be indiscriminate about it. So the best evidence of those speculative inclinations is the uniformity or divergence of market action across a broad range of individual stocks, industries, sectors, and security-types, including debt securities of varying creditworthiness. With our measures of market internals deteriorating in recent weeks, even that factor is sputtering (see the November 13 interim update, Distinctions Matter – join our News List to have these special updates delivered to your inbox).
Despite the late-November advance in the major indices, the condition of market internals remains unfavorable on our measures. Still, we’re holding to a fairly neutral near-term outlook, rather than a hard-negative one. Given the extent of current overvaluation, it’s enough to keep more aggressive safety nets and tail-risk hedges several percent below current levels, and it’s essential to be flexible in the intensity of our concerns. The primary consideration for investors is to adapt in a way that neither fights against the speculation, nor leaves investors relying on a “permanently high plateau.”
At present, low interest rates neither justify nor mitigate the extreme valuations of the U.S. equity market. To the contrary, low interest rates simply add insult to injury, joining poor total return prospects for stocks with similarly poor total return prospects for fixed income. The chart below presents our estimate of prospective 12-year annual total returns for a conventional portfolio mix invested 60% in the S&P 500, 30% in Treasury bonds, and 10% in Treasury bills (blue line). The red line shows the actual total returns for this portfolio mix over the subsequent 12-year period. Presently, passive investors face the most dismal total return prospects in U.S. history.
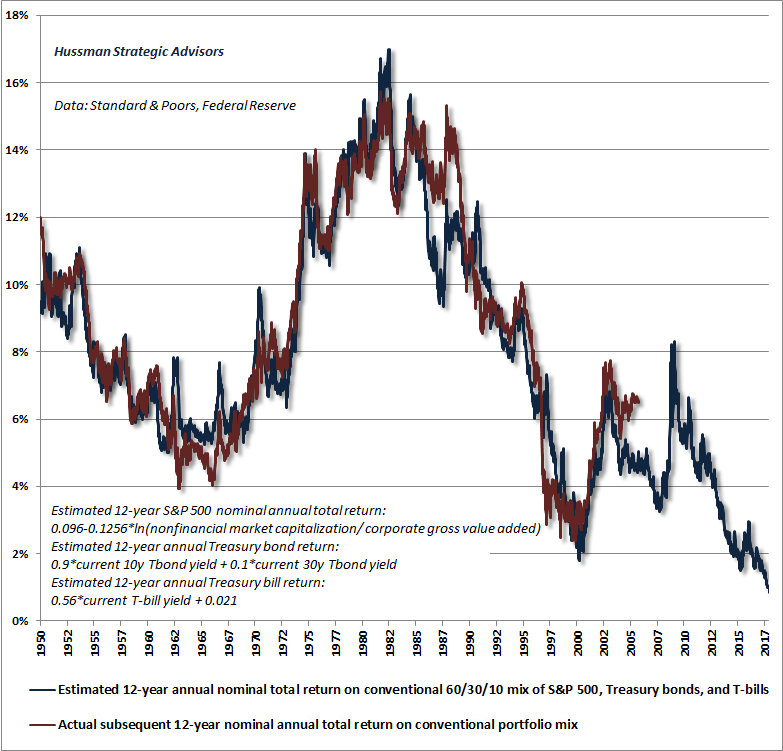
This doesn’t mean that the coming years will be without opportunity. Investors with more flexible disciplines should observe that across history, market collapses have produced upward spikes in expected returns, so we certainly expect investors to encounter strong investment opportunities even in the next few years. As usual, we expect the strongest opportunities to emerge when a material retreat in valuations is joined by an early improvement in market action.
Navigating the speculative Id of Wall Street
Unlike prior market cycles across history, even the most extreme “overvalued, overbought, overbullish” syndromes – on their own – have provided unreliable warnings of market losses during the advancing half-cycle since 2009. Still, the S&P 500 has produced net losses, even since 2009, in periods when those “overvalued, overbought, overbullish” syndromes have been joined by deteriorating market internals.
The defining feature of the recent half-cycle is that monetary policy, regulatory policy and proposed tax policy have all very intentionally nourished the primitive, untethered, speculative Id of Wall Street. Freud called the Id “a cauldron full of seething excitations, striving to bring about the satisfaction of instinctual needs subject to the observance of the pleasure principle.” That’s a reasonable description of monetary policy under Ben Bernanke, and much of what has unfolded under the current Administration.
As one of the few observers to both anticipate and accurately estimate the depth of both the 2000-2002 and 2007-2009 market collapses (including my March 2000 estimate of an -83% collapse in technology stocks, which proved to be rather brutally accurate), I fully expect that the coming years will feature a roughly -64% collapse in the S&P 500 Index. The problem, as the economist Rudiger Dornbusch once observed, is that “the crisis takes a much longer time coming than you think, and then it happens much faster than you would have thought.”
Valuations are enormously useful in projecting long-term and full-cycle market outcomes, but even a century of evidence about properly discounted cash flows and their relationship with subsequent market returns is not enough. In the short run, all a rising market requires is the inclination to speculate; the general sense that it feels good to own stocks, and it feels bad not to own stocks. The speculative Id is concerned only with that immediate gratification. The problem is that in a hypervalued market, all a market plunge requires is a shift in that psychology away from speculation and toward risk-aversion. This requires constant vigilance, because a modest shift in the uniformity of market internals – what we call “early” deterioration – is often enough to produce abrupt losses, so the “catalyst” is often fully recognized only after the collapse.
It’s both dangerous and needless to dismiss current valuation extremes. Instead, the central adaptation required to navigate this environment is straightforward, which is to avoid taking a hard-negative market outlook whenever there’s evidence that speculators have the bit in their teeth. It’s necessary to prioritize the condition of market internals ahead of even the most extreme “overvalued, overbought, overbullish” syndromes. This focus on valuations and market internals allows for Wall Street’s speculative Id, yet doesn’t require investors to abandon historically critical evidence. To do so would be to enter a cave with a -64% hole in the earth, without a flashlight, a map, or a safety net.
The speculative Id of Wall Street requires no justification, and honors no amount of reason. Rather, one needs to monitor the signature it leaves on valuations and market action.
Valuations and market action are the essential drivers of total returns
We can think about investment returns from two perspectives: 1) long-term returns over complete market cycles, or 2) shorter-term returns over limited portions of the market cycle. The distinction matters, because the total return over any limited holding period may have nothing to do with the long-term return that’s priced into a given security.
From a long-term standpoint, a security is nothing more than a claim on the long-term stream of cash flows it will deliver into the hands of investors over time. The higher the price an investor pays for a given stream of future cash flows, the lower the long-term return an investor can expect. So, not surprisingly, we find that valuations are the primary driver of long-term investment returns.
Over shorter horizons, however, the total return of an investment has two components: income plus capital gain (or capital loss). One captures the stream of cash flows that the security delivers into the hands of the investor during the holding period, and the other captures the change in the price of the security between the starting and ending points of the horizon.
While long-term market returns are driven almost exclusively by valuations, investment returns over shorter segments of the market cycle are highly dependent on investor psychology, particularly the inclination of investors toward speculation or risk-aversion. Speculative inclinations can drive overvalued markets to even greater overvaluation, while risk-averse inclinations can drive undervalued markets to become even greater undervaluation. When the inclinations of investors shift from speculation to risk-aversion in an overvalued market, steep collapses and crashes often follow. Conversely, when the inclinations of investors shift from risk-aversion to speculation in an undervalued market, extraordinary returns can unfold over a very short period of time.
How do we measure whether investors are inclined toward speculation or risk-aversion? The best guide we’ve found to measure that psychological preference is the uniformity or divergence of market action across a broad range of individual stocks, industries, sectors, and security-types, including debt securities of varying creditworthiness. When investors are inclined to speculate, they tend to be indiscriminate about it. In decades of market analysis, I’ve typically referred to this feature of market action as “trend uniformity” or the behavior of “market internals.”
It’s easy to ignore the condition of market internals, and to become distracted by hundreds of other side stories. But while investors might like to believe otherwise, stock market returns over short horizons are actually very weakly related to earnings growth, interest rates, and even economic conditions. Whatever useful information there may be in these side stories, their importance to investors is expressed through market action, so it’s important to attend to market action directly.
Disabling the alarms
Aside from the behavior of market internals, an additional feature of market action has historically been important. In prior market cycles across history, the inclination of investors to speculate has often ended abruptly once the exuberance has produced a combined syndrome of what we call “overvalued, overbought, overbullish” conditions. Even when market internals have been favorable, those syndromes have typically acted as a strong warning of oncoming air-pockets, panics, and crashes, so deteriorating market internals have quickly followed. In decades of prior market cycles, our effective use of valuations, market internals, and overextended syndromes repeatedly allowed us to navigate complete market cycles admirably.
The advancing half-cycle since 2009 was strikingly different. Amid the novelty of quantitative easing and zero interest rates, investors continued to speculate long after the most extreme overvalued, overbought, overbullish syndromes emerged. Our reliance on those syndromes, in hindsight, was an excruciating Achilles Heel, and our expectations about market weakness were persistently detrimental.
As the advance continued, we incrementally made adaptations in response. The main difference between this half-cycle and prior cycles was zero-interest rate policy, so in 2014, we imposed the requirement that, in an environment of zero interest rates, market internals have to deteriorate explicitly before adopting a negative market outlook.
That single adaptation would have avoided most of our difficulty in the recent half cycle, but not all of it. Early this year, it became clear that investors were still speculating in the face of overvalued, overbought, overbullish conditions, even though interest rates had moved above zero. So we made the only concession that remained: we elevated the priority of market internals above “overvalued, overbought, overbullish” syndromes in all circumstances, basically saying “It’s fine to become cautious or neutral in the face of extreme conditions, but never adopt a hard-negative market outlook unless market internals have deteriorated explicitly.”
Why was that process so painfully incremental? Simple. Adaptive learning looks a whole lot like stubborn inflexibility when new information conflicts with very strong “priors” – in this case, a century of evidence that those syndromes were effective on their own. In prior market cycles, a breakdown in market internals typically accompanied or closely followed those syndromes. In this market cycle, zero interest rates and post-election enthusiasm disrupted that overlap. Requiring explicit deterioration in market internals addresses that issue.
If you take away nothing else, take away this. Our response to “overvalued, overbought, overbullish” syndromes was the source our difficulty in the half-cycle since 2009, because these syndromes encouraged us to maintain an overly negative market outlook in the face of unrelenting speculation. We’ve adapted so that market internals always take priority. Regardless of other market conditions, our adapted discipline requires explicit deterioration in market internals before adopting a negative market outlook.
So we can all agree: this time was different. But that difference takes a particular form: “overvalued, overbought, overbullish” syndromes have been less reliable than in other market cycles across history. But even since 2009, the market has lost net value when these syndromes have been joined by unfavorable market internals. So don’t imagine that valuations or market internals can be dismissed as well. There’s simply no evidence to that effect.
We’re happy to entertain the possibility that aggressive central banks and companies like Amazon have permanently changed the world as we know it. Again, the reason we can be fine with those possibilities is because the measures we’ve prioritized remain central to the very definition of total return. The two drivers of total return are income and capital gains; cash flows and price action. The prospects for the two are largely synonymous with the condition of valuations and market internals.
Giving overvaluation and undervaluation room to run
The way to resolve a century of historical evidence is to simultaneously accept two opposing facts. One is that valuations drive market returns in the long-term. The other is that valuations often exert no effect at all on shorter-term outcomes. Valuations are one component of the investment process, and investor psychology is the other. The inclinations of investors toward speculation or risk-aversion can drive prices a breathtaking distance from where they will eventually settle. The danger is in being seduced to believe that just because prices have reached a certain level, they must somehow actually belong there.
One has to tolerate a certain amount of cognitive dissonance to recognize that the S&P 500 is now 2.8 times the level at which it is likely to complete this market cycle, and yet allow for the possibility that investors could again take up the speculative bit (which we would infer from market internals), and drive valuations to even further extremes. It’s easier to make up reasons why the market should be at current levels, which is what investors did during the tech bubble and the mortgage bubble. The most devastating losses emerge when investors try to justify what historical evidence does not.
The test of a first-rate intelligence is the ability to hold two opposed ideas in mind at the same time and still retain the ability to function.
– F. Scott Fitzgerald
The recent half-cycle has been unusual, precisely because zero interest rates and post-election euphoria have sustained speculation even in the face of syndromes that have historically warned of steep losses. The result is the most extreme level of equity market valuation on record. Our measures of market internals have also deteriorated. That’s a source of concern at present, and but it’s enough to maintain a rather neutral immediate outlook provided that safety nets and tail-risk hedges are kept within several percent of current extremes.
Given the combination of offensive valuations and divergent market internals, coming off an extended period of persistently “overvalued, overbought, overbullish” conditions, a period of very steep market losses is likely. Even here, however, it’s important to recognize that a fresh improvement in market internals would lessen our immediate concerns. We’ll respond to the evidence as it arrives.
Valuation update
At its core, every investment security is simply a claim on a very long-term stream of cash flows that will be delivered to investors over time. Every valuation multiple (Price/X) is just shorthand for a proper discounted cash flow analysis. Whatever “X” investors use can’t just be representative of next year’s cash flow, or the cash flows expected over the current economic cycle. Rather, X has to be a “sufficient statistic” that’s essentially proportional to the very, very long-term stream of cash flows that the security will deliver over its entire existence.
While earnings are required in order to produce future cash flows, the fact is that S&P 500 earnings have historically been more volatile than stock prices themselves, and even smoothed or “forward” earnings measures produce valuation multiples that are rather weakly correlated with actual subsequent market returns.
Over the course of more than three decades, I’ve demonstrated that the valuation measures best correlated with actual subsequent S&P 500 total returns are those that account for variation in profit margins over time. Indeed, even Robert Shiller’s cyclically-adjusted P/E (CAPE) is much better correlated with actual subsequent market returns, across a century of market cycles, when we account for the profit margin embedded in the 10-year average of earnings. In 2014, I introduced an alternative measure, the Margin-Adjusted CAPE, which substantially improves the reliability of the raw CAPE. This measure now stands at the most offensive level in history, surpassing even the 1929 and 2000 extremes.
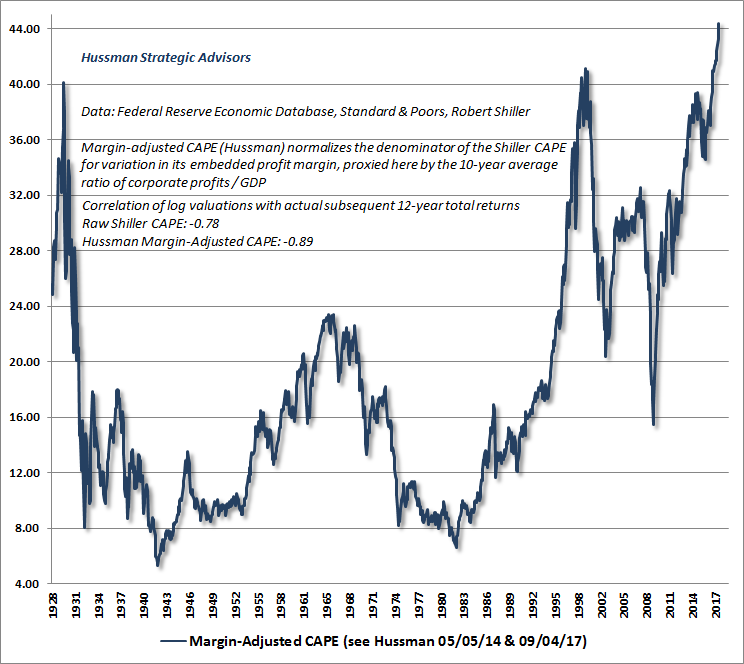
Extremely elevated or depressed valuations are typically resolved within a 10-12 year period. Since the “autocorrelation” of good valuation measures tends to hit zero at a horizon of about 12 years, we tend to prefer that horizon in various charts discussing the long-term implication of market valuations.
From the standpoint of long-term asset pricing, the reliability of these measures in estimating subsequent market returns has not deteriorated a bit in recent cycles. Yes, at bubble extremes like 2000 and today, we’ll typically find that stocks have done better than investors would have expected 10-12 years earlier on the basis of valuations alone. Likewise, at secular valuation lows like 1949 and 1982, we’ll typically find that stocks have done worse than investors might have expected 10-12 years earlier. But those instances emerge precisely because the terminal valuations are so extreme. Within a short number of years, the prior excess returns are generally wiped out, and the shortfalls in returns are generally made whole.
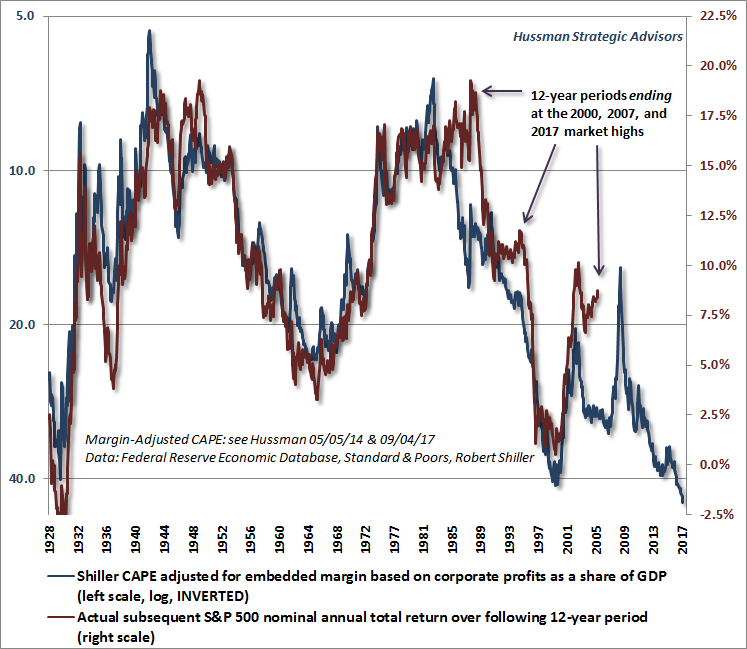
While our Margin-Adjusted CAPE has a very slightly lower correlation with actual subsequent market returns than our preferred measure (MarketCap/GVA), the available data history is longer. The chart below shows the relationship between the Margin-Adjusted CAPE, on an inverted log scale, and actual subsequent S&P 500 total returns, in data since the 1920’s.
Notice that there are a few 12-year periods where actual S&P 500 total returns exceeded the returns that one might have anticipated 12 years earlier (1988-2000, 1995-2007, and 2005-2017). The reason was that the ending valuations of those 12-year periods represented pre-collapse extremes. So again, we’re fairly neutral near-term, given the wild abandon. But understand that even when valuations don’t “work” over shorter segments of the market cycle, the longer-term and full-cycle outcomes of hypervaluation are predictably brutal.
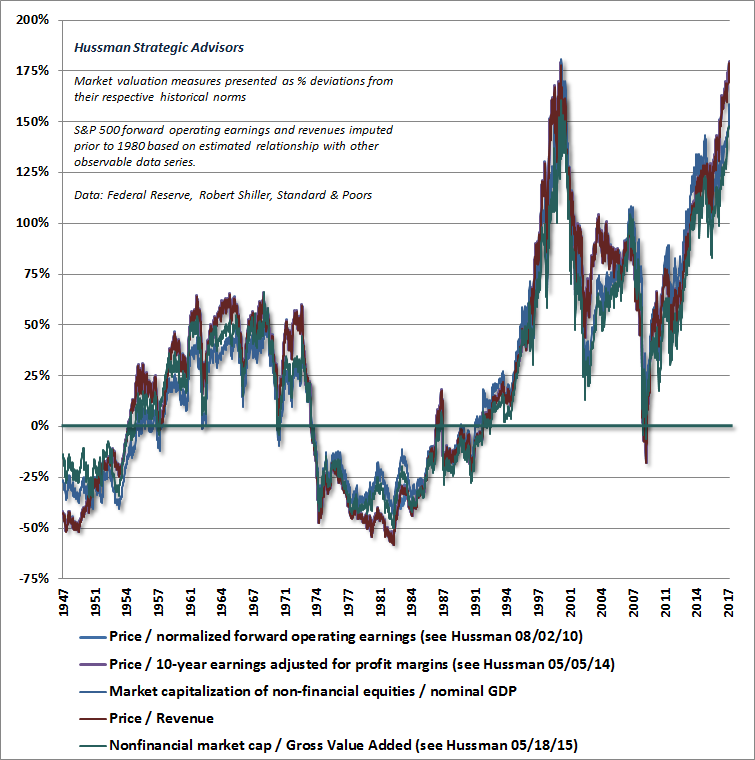
The chart below presents an additional set of valuation measures that we find best correlated with actual subsequent 10-12 year S&P 500 total returns in market cycles across history, with significantly greater reliability than alternatives such as forward operating P/E ratios or the Fed Model. These measures are presented as percentage deviations from their respective norms. Presently, these measures are a median of 180% above (2.8 times) those norms. Put another way, simply touching those norms, without any move to historical undervaluation, would presently require a -64% market loss over the completion of the current cycle.
Beware of attempts to “justify” current valuations
Don’t confuse the prospects for 10-12 year market returns with the prospects for market returns over shorter horizons. The reason why valuations are so tightly correlated with 10-12 year returns is that extreme deviations from historical norms tend to wash out over that horizon, and because interest rate fluctuations have a much less durable impact on market valuations than investors imagine. Interest rates and nominal economic growth rates tend to move in tandem, so their competing effects on “justified” valuations generally cancel out. Likewise, the frightening or exuberant features of any given business cycle typically have little effect on the very, very long-term stream of cash flows that stocks actually deliver over time.
So investors might have believed that the extraordinarily depressed market valuations of 1974 and 1982 were “justified” by recession and high interest rates, but that did nothing to prevent the S&P 500 from enjoying remarkably high returns in subsequent years. Likewise, investors might have believed that the extraordinarily elevated market valuations of 1929 and 2000 were “justified” by the recent economic prosperity, but that did nothing to prevent the market collapses that completed those cycles, with over a decade of negative total returns for the S&P 500 in both cases.
When an investment horizon begins at depressed market valuations and ends at elevated market valuations, the total returns of investors over that horizon are always glorious (for example, the total return of the S&P 500 averaged nearly 20% annually during the 18-year period between the 1982 low and the 2000 peak). Conversely, when an investment horizon begins at elevated market valuations and ends at depressed valuations, the total returns of investors over that horizon are unfailingly wretched, regardless of intervening economic growth.
With the most historically reliable valuation measures about 2.8 times their historical norms, these extreme starting valuations are worth considering here. Even if the growth rates of nominal GDP and U.S. corporate revenues (including foreign revenues) over the coming 20 years match their 4% growth rate of the past 20 years, and even if the most reliable valuation measures merely touch their historical norms 20 years from today, the S&P 500 Index two decades from now will trade more than 20% lower than where it trades today. That’s just arithmetic [(1.04)^20 x (1.0/2.8) – 1 = -21.7%].
Put simply, valuations have enormous implications for long-term investment returns, and for prospective market losses (or gains) over the completion of any market cycle, especially those that feature historically extreme valuation peaks (or troughs). When valuations move from depressed levels to historical extremes over the span of several market cycles, the result is a “secular bull market” and headlines about permanently high plateaus. When valuations move from elevated levels to historical lows over the span of several market cycles, the result is a “secular bear market” and headlines about the permanent death of equities.
Although Wall Street continues to assert that valuations are “reasonable given the level of interest rates,” keep in mind that the most reliable measures of valuation imply negative 10-12 year total returns for the S&P 500. These measures have maintained correlations near 90% and higher with subsequent market returns, across history, and across interest rate regimes. The notion that these calculations must be “adjusted” for interest rates is a misconception that presumes that the current price is unobservable.
Yes, if you have a stream of future expected cash flows and need to estimate a fair price, interest rates should inform your choice of an appropriate discount rate. But the moment the price is established, the expected return is baked in the cake (just as the yield-to-maturity on a 5-year bond is baked in the cake the moment the price is established). Expected returns can be compared with 10-year yields if one wishes to do so, but that comparison doesn’t change the expected return you just calculated, based on the observed price. Now, if negative 10-12 year total returns on stocks are acceptable to Wall Street, given the level of interest rates, that’s fine, but investors should understand that this is what’s being argued, and that the level of interest rates doesn’t change that expectation.
Second, if one wishes to argue that today’s low interest rates will “justify” permanently extreme valuations even 10-12 years from today, it’s useful to remember that if interest rates are low because the growth rate of cash flows is also low, then no valuation premium is “justified” at all. For extensive detail on this subject, including discounted cash flow considerations, see Why Market Valuations are Not Justified by Low Interest Rates. This point remains enormously important for investors today.
On the tax front, despite the recent exuberance over corporate tax policy, it’s important to recognize that the average effective corporate tax rate is already just 20% in the United States. The chart below shows actual corporate taxes paid, as a percentage of corporate pre-tax income. Even if corporate taxes were cut in half, the bump to after-tax cash flows would be just 0.90/0.80-1 = 12.5%. So even if that tax cut was permanent, the present value of the expected addition to future cash flows would only “justify” a 12.5% increase in stock prices. Far more has been priced into stocks in recent months alone.
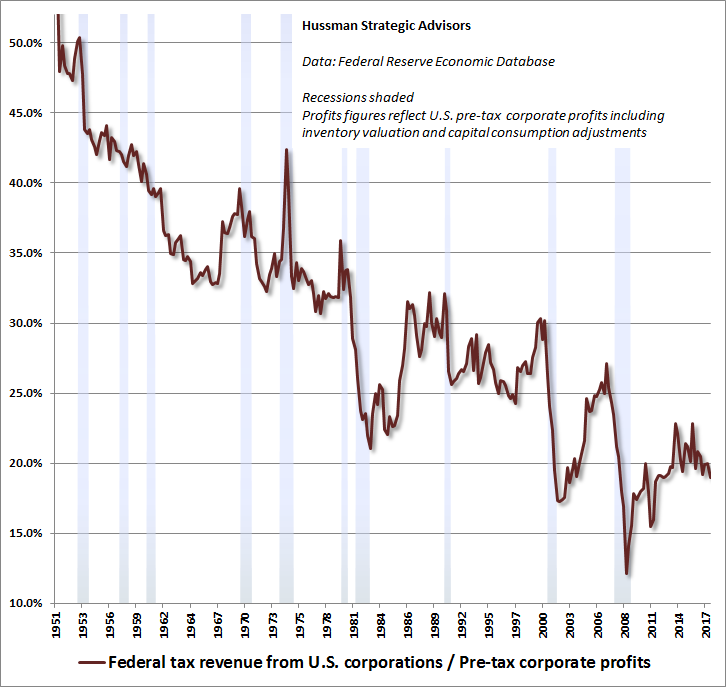
As for the tax cut somehow paying for itself in greater economic growth, the simple fact is that corporate profits are already at record levels, yet most of those profits are being used for dividends, mergers & acquisitions, and stock buybacks; not for net capital formation or job creation.
Good economic policy works by relieving existing constraints that hold back desirable activities, or by imposing new constraints that prevent undesirable activities. But corporate profits aren’t a binding constraint on anything here. A larger surplus won’t be used for economic activity, but for financial transactions. In full equilibrium, I expect that the additional cash flows from corporate tax cuts will, directly or indirectly, be used to buy fresh Treasury debt. The effect of corporate tax cuts will end up being a bookkeeping entry: the public will give tax breaks to the super-wealthy, so the super-wealthy can lend it back to the public.
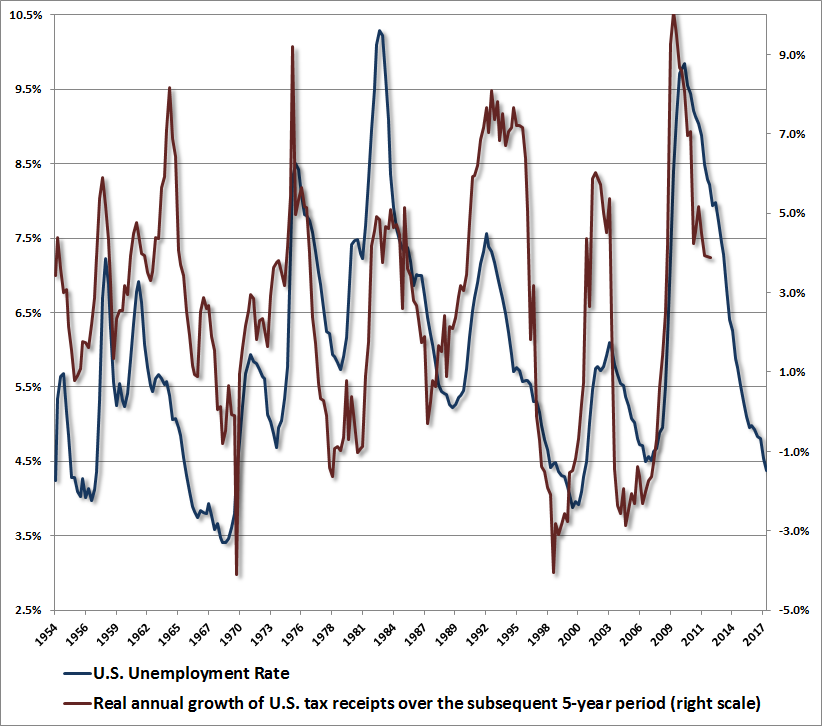
Equally important, remember that government revenue growth is cyclical. Economic growth is equal to employment growth plus productivity growth. The periods where tax cuts were credited for producing strong economic growth were periods where the unemployment rate was high and population growth was relatively strong, providing a great deal of slack for subsequent employment growth. Economic growth followed the Reagan tax cuts mainly because they were enacted in the face of the highest U.S. unemployment rate in the post-war period, and a U.S. current account surplus provided enormous room to borrow from foreigners to finance new capital investment and fresh government deficits.
Presently, however, population and labor force growth are running at just 0.5%, as is labor productivity. All of these are down from more than 2% annually in most of the post-war period. Moreover, with the unemployment rate at just 4.1%, and a deep current account deficit with other countries already, there is very little chance that rapid growth in the economy and government revenues will allow tax cuts to “pay for themselves.”
Put simply, even taking account of current interest rate levels, and even assuming that stocks should be priced to deliver commensurately lower long-term returns, we currently estimate that the S&P 500 is about 2.8 times the level at which equities would provide an appropriate risk premium relative to bonds. Even substantial reductions in corporate tax rates would hardly put a dent in the appropriate level of stock market valuations.
On the uniformity of nature
Valuations are understood best not by trying to “justify” or dismiss current extremes, but by recognizing that across history, the speculative inclinations of investors have periodically allowed valuations to depart dramatically from appropriate norms, at least for limited segments of the complete market cycle. The speculative Id of Wall Street requires no justification, and honors no amount of reason. Rather, one needs to monitor the signature it leaves on valuations and market action.
Investors have become quite confident in the idea that stock prices can only advance, not because historical evidence informs that belief, but because investors have elevated recent experience above all else. This faith of investors reflects a belief in what Bertrand Russell called the “uniformity of nature” – the assumption that a repeated pattern must reflect some underlying law, to which there can be no exceptions.
A more refined view would recognize the potential for the yawning gap between price and value to snap shut, particularly in periods where deteriorating market internals suggest a shift of investor preferences from speculation to risk-aversion. We actually don’t need to know when this gap will snap shut. It’s enough to monitor and respond to conditions under which a collapse is most likely to occur, and align ourselves with the evidence as it changes. Again, the main danger is in being seduced to believe that just because prices have reached a certain level, they must somehow actually belong there. This is evidently a lesson that investors will have to learn the hard way, yet again.
The man who has fed the chicken every day throughout its life at last wrings its neck instead, showing that more refined views as to the uniformity of nature would have been useful to the chicken.
– Bertrand Russell
Keep Me Informed
Please enter your email address to be notified of new content, including market commentary and special updates.
Thank you for your interest in the Hussman Funds.
100% Spam-free. No list sharing. No solicitations. Opt-out anytime with one click.
By submitting this form, you consent to receive news and commentary, at no cost, from Hussman Strategic Advisors, News & Commentary, Cincinnati OH, 45246. https://www.hussmanfunds.com. You can revoke your consent to receive emails at any time by clicking the unsubscribe link at the bottom of every email. Emails are serviced by Constant Contact.
The foregoing comments represent the general investment analysis and economic views of the Advisor, and are provided solely for the purpose of information, instruction and discourse.
Prospectuses for the Hussman Strategic Growth Fund, the Hussman Strategic Total Return Fund, the Hussman Strategic International Fund, and the Hussman Strategic Dividend Value Fund, as well as Fund reports and other information, are available by clicking “The Funds” menu button from any page of this website.
Estimates of prospective return and risk for equities, bonds, and other financial markets are forward-looking statements based the analysis and reasonable beliefs of Hussman Strategic Advisors. They are not a guarantee of future performance, and are not indicative of the prospective returns of any of the Hussman Funds. Actual returns may differ substantially from the estimates provided. Estimates of prospective long-term returns for the S&P 500 reflect our standard valuation methodology, focusing on the relationship between current market prices and earnings, dividends and other fundamentals, adjusted for variability over the economic cycle.