

Singularity and the Buzzard


John P. Hussman, Ph.D.
President, Hussman Investment Trust
September 2025
Nearly 50 years ago, I was an admittedly geeky 14-year old high-school junior. Cool songs like Brick House by the Commodores were in the top 40, but I was undoubtedly listening to She Did It by Eric Carmen and On and On by Stephen Bishop (not that there’s anything wrong with that). I discovered Earth, Wind & Fire a year later, and my whole world opened up.
My favorite teacher was Father Arnold Perham. We all called him Arnie. He had a stuffed plush-toy buzzard that looked remarkably like his doppelganger. He would drop it on your desk when you made a mistake – “You get the buzzard!” adding with a smile, “and he will stay there, until you’ve redeemed yourself.”
One morning, I wrote this diagonally in all-caps in my math notebook:
AT 10:25 AM ON OCTOBER 26, 1977, MY FUTURE IN
CALCULUS BECAME MATHEMATICALLY INDETERMINATE
Arnie had just covered something called L’Hôpital’s Rule, which allows one to deal with problems that, in the limit, result in division by zero – illegal in math. Arnie was showing that as you approach the singularity, you can compute the limit of a ratio of functions by taking the limit of the ratio of their first derivatives.
Yeah, my reaction too. System overloads. Hamster falls off wheel. Singularity.
Singularity
Division by zero is known as a “singularity.” It’s the point where equations break down, values become “indeterminate,” things stop working normally, and variables shoot toward infinity and suddenly collapse on the other side.
Black holes are called singularities, because the normal equations of physics become meaningless – things like density and curvature go to infinity.
I’ve never liked division by zero. In college, it was a bane of my existence, particularly in computer programming class. Aspiring geeks like me would be huddled in Northwestern’s Vogelback Computing Center, which could easily be mistaken for a bomb shelter, and you’d wait half an hour for some bored work-study student to push your stack of punch cards, wrapped in a printout, into your slot amid a beehive of mail cubbies, only to find a crash log of cascading “Fatal error!!” messages because you forgot to assign a variable and the computer tried to divide by zero.
I started my own investment company in 1985, and over the next 25 years, the relentless pursuit of geekiness was wonderfully rewarding across market cycles that included both bubbles and crashes. Those admirable outcomes hit an excruciating roadblock (which we’ve since resolved) when another singularity emerged in 2010.
That’s when Ben Bernanke introduced a full-throttle, hair-on-fire, “divide-by-zero” singularity into the U.S. financial markets.
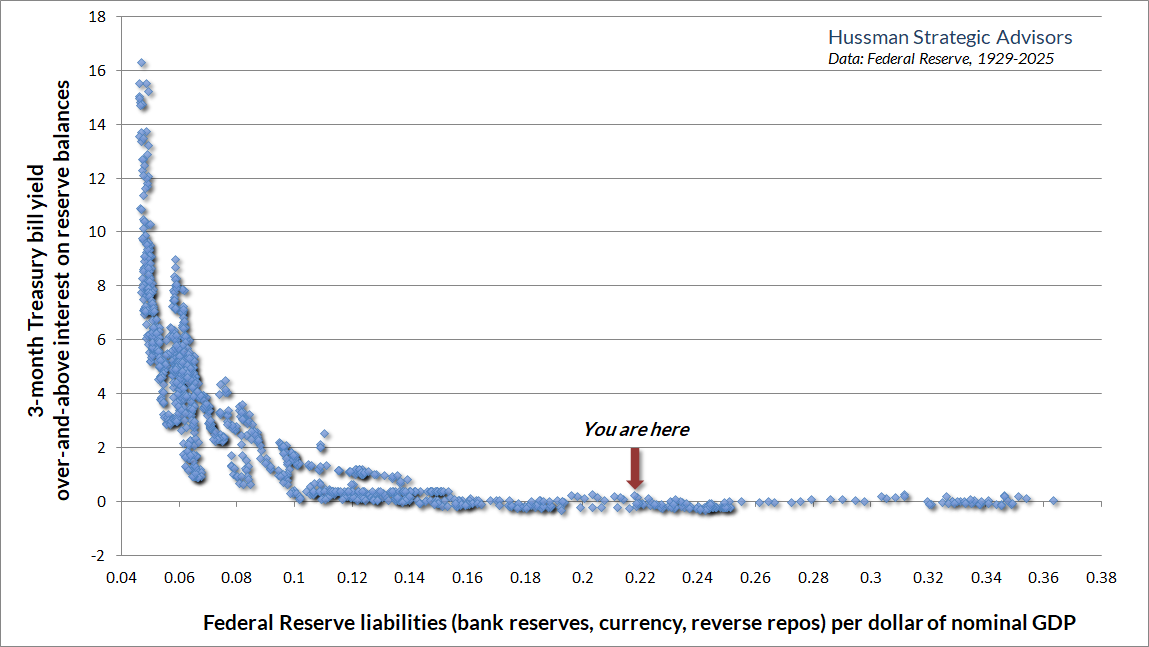
Under Bernanke, the Fed recklessly drove the quantity of zero-interest Federal Reserve liabilities from just 6% of GDP in 2008 (a level historically associated with T-bill rates of roughly 4-6%), past 10% of GDP (a level associated with T-bill rates between 0-2%), past 14% of GDP (at which point T-bill yields hit zero), all the way to 25% of GDP by the time his term as Fed Chair ended. The expansion continued – abetted by Janet Yellen and initially by Jerome Powell – until the quantity of zero-interest base money created by the Fed peaked at a deranged and unprecedented 36% of GDP in early 2022.
The Fed created these zero-interest liabilities through “open market purchases” that took interest-bearing Treasury securities out of the hands of investors – and replaced them with zero-interest cash (mostly held by investors in the form of bank deposits).
Somebody had to hold these zero-interest Fed liabilities, in the form of cash, at every moment in time. Cash doesn’t “turn into” something else when you use it. It just goes into someone else’s hands, someone else’s bank account.
Nobody wanted it. As the Wiggles song goes, “Hot potato, hot potato.”
Several years of “quantitative tightening” have gradually brought Fed liabilities down to about 22% of GDP. These Fed liabilities primarily take the form of bank-reserves, currency in circulation, and “reverse-repurchase” agreements with money-market funds. The Fed would have to cut its balance sheet by another two-thirds, to roughly 7% of GDP, in order to achieve T-bill rates of 2-4% by market forces alone.
Given that Fed liabilities remain vastly above that level, the only way the Fed can hold short-term interest rates above zero at present is by explicitly paying interest to banks on the trillions of dollars of reserves it has created. Currently, the Fed pays banks interest on reserve balances (IORB) at a rate of 4.15% annually.
The chart below shows how all this works. It’s our version of what economists know as the “liquidity preference curve.”
Why zero-interest rate policy was a “singularity”
Since we’ve already broached the topic of 70’s music (I may be a geek, but I’m also a 70’s pop-head), recall a line in Someone Saved My Life Tonight by Elton John: “I would have walked head-on into the deep end of a river. Clinging to your stocks and bonds, paying your H-P demands forever.”
An H-P demand is a “hire-purchase” obligation – an agreement that involves ongoing installment payments. Let’s define an “H-P demand – forever” – as an IOU that pays $1 a year from now until eternity (I know, Elton is British. It would pay in pounds. Get over yourself).
If the interest rate on the IOU is say, 10%, we have $1 payment = 10% of the obligation, so the present value of that perpetual $1 payment is $10. Now drop the interest rate to 5%. In order for $1 to be 5% of the present value, the present value must be $20. Now drop the interest rate to 1%, and that same $1 as a 1% annual payment means that the present value of the obligation is $100.
0.5%: $200. 0.25%: $400 (assuming the buyer is willing to accept that given long-term rate of return forever). That’s how bonds are priced. Holding cash flows constant, the lower the interest rate (yield-to-maturity), the higher the price of the bond.
Extremely high prices may seem like a beautiful thing, but they’re a corrupt bargain. Unless you actually sell, the cost of “enjoying” record high valuations is that you are locking-in record low future rates of return.
Now drop the interest rate to zero. Infinite price. Singularity.
Division by zero is known as a ‘singularity.’ It’s the point where equations break down, values become ‘indeterminate,’ things stop working normally, and variables shoot toward infinity and suddenly collapse on the other side. The current speculative bubble was driven by a singularity. Avoiding the crash on the other side relies on the willingness of investors to accept the lowest long-term return prospects in U.S. history, forever. Extremely high prices may seem like a beautiful thing, but they’re a corrupt bargain. Unless you actually sell, the cost of “enjoying” record high valuations is that you are locking-in record low future rates of return.
Of course, in practice, stocks don’t work quite as simply as an IOU with an infinite interest rate and a fixed, infinite payment obligation. In practice, real growth rates, profit margins, inflation, dividend payouts, free cash-flow, return on invested capital and other factors matter. And there’s a difference between transitory movements in interest rates over the course of a few years, and changes in the rate of return that investors agree to accept over an infinite horizon.
Still, the core idea is simple: zero interest rates made investors lose their minds, and encouraged them to chase stocks regardless of the level of valuation. It was reckless and misguided, and the bubble hasn’t deflated yet.
When does the bubble burst?
Bubbles are generated when investors drive valuations higher without simultaneously adjusting expectations for future returns lower. In other words, the defining feature of a bubble is inconsistency between expected returns based on price behavior and expected returns based on valuations. The “Bubble Term” measures the gap between the two.
Unless the Bubble Term is able to become exponentially larger forever – it shows up as a growing gap between the long-term return that investors expect in their heads, and the long-term return that investors can actually expect based on the future cash flows that will ultimately be delivered into their hands.
Now suppose there’s a sort of compromise, where investors eventually become willing to lower their return expectations – so that valuations don’t need to keep setting fresh highs forever, but without the need for valuations to collapse. Here’s the problem: in order to permanently maintain the valuation extremes that are already in place, investors would have to reduce the long-term return expectations in their heads all the way down to the long-term expectations that would equate price with discounted cash flows.
Currently, that means that investors would need to be comfortable holding stocks indefinitely, at the highest valuation levels in U.S. history, while fully understanding that they imply long-term returns in the ballpark of only 5.7%. That’s a bitter pill to swallow, and that’s why bubbles crash.
– John P. Hussman, Ph.D., The Bubble Term, August 14, 2025
I added a “Geeks Note” to the end of last month’s comment (The Bubble Term) that walks through this argument for readers and former students who want to trace the math explicitly.
What will burst this bubble? (and based on the gap between surveys of investor expectations and cash flow growth rates and yields, I emphatically believe we’re in one). My view is simple, and it’s reflected in last month’s comment:
The bubble hasn’t burst yet because investors haven’t quite yet recognized that the highest valuations in history imply the lowest expected future returns in history. A market crash is nothing but risk-aversion meeting a market that’s not priced to tolerate risk. Every fresh record high in valuations amplifies the likely downside when that occurs, but examining the collapse of past bubbles, the “catalyst” typically becomes evident only after the market is in free fall.
In typical timely fashion, my friend Danielle DiMartino Booth published a piece this morning called “Surviving a Free Fall.” If you’re in an elevator that’s dropping like a rock, you want to lay flat on the floor, spread out, so you distribute the impact. Physics shows that jumping up a second before impact won’t work. The analogy, I think, to a market collapse is to diversify your assets, though it’s probably preferable not to get into a hinky elevator in the first place when it’s on the highest floor of the highest building, with cables (internals) already ragged.
In any event, nothing in our investment discipline relies on the bubble bursting or the market crashing. Indeed, we’ve done just fine with market fluctuation alone given the hedging implementation I introduced nearly a year ago.
We do prefer market fluctuation to a diagonal, hypervalued advance, and I’ll have more comments below about the diagonal, non-fluctuating advance in the market over the past few months. For now, suffice it to say while I very much expect this bubble to collapse, our discipline doesn’t need it to do so, so no forecasts or scenarios are required.
Valuations and “passive flows”
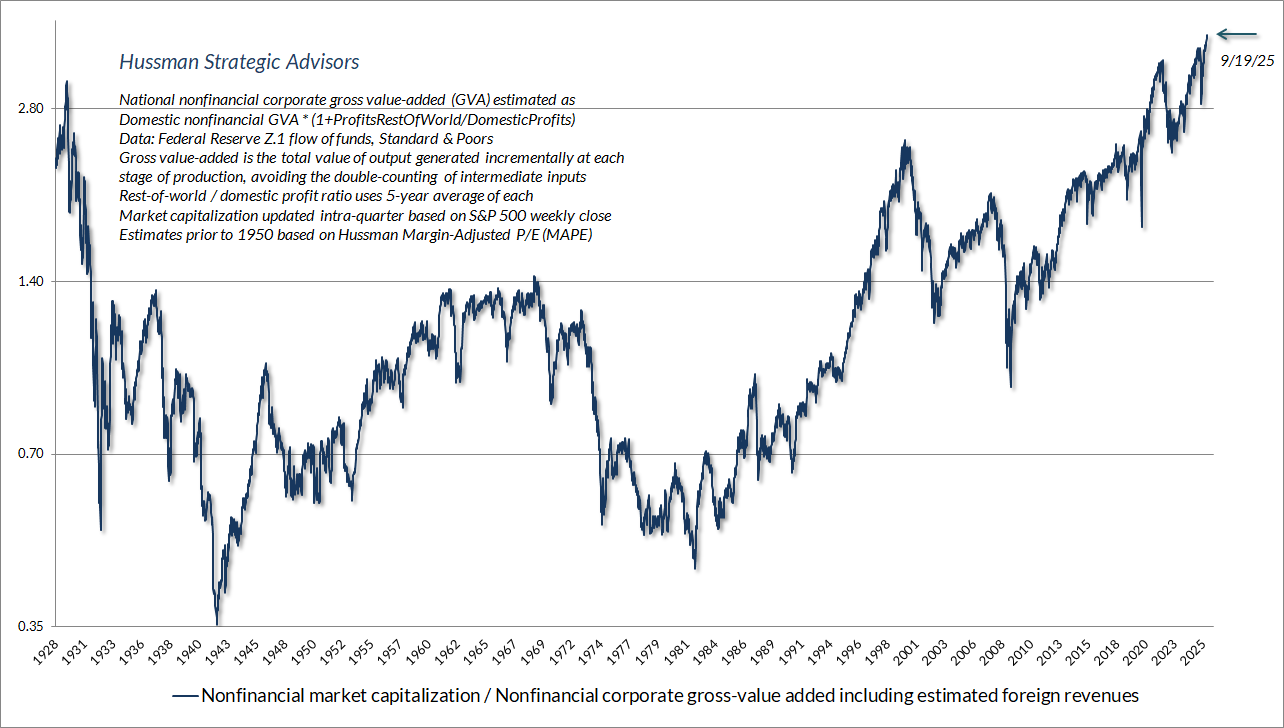
The chart below shows our most reliable gauge of market valuations in data since 1928: the ratio of nonfinancial market capitalization to gross value-added (MarketCap/GVA). Gross value-added is the sum of corporate revenues generated incrementally at each stage of production, so MarketCap/GVA might be reasonably be viewed as an economy-wide, apples-to-apples price/revenue multiple for U.S. nonfinancial corporations.
The current level of valuations is the highest in U.S. history, easily exceeding both the 1929 and 2000 extremes. While the S&P 500 has advanced just over 9% since February 19, when the previous record was set, we’ve been pleased with our own knitting.
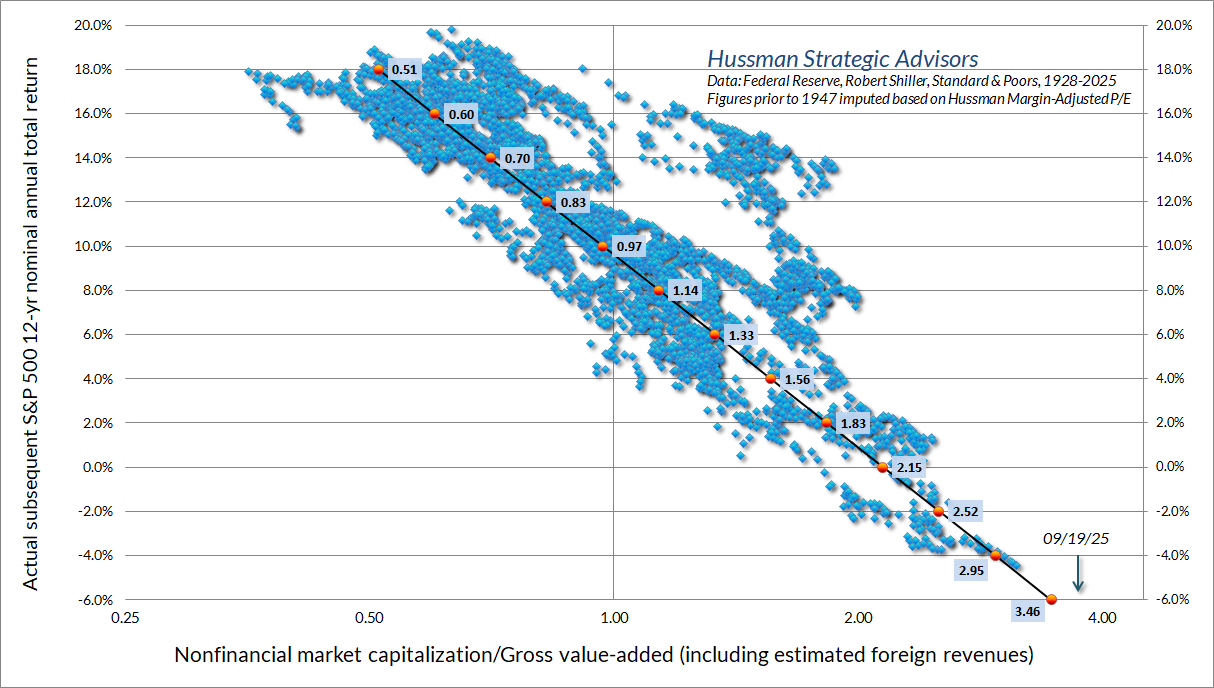
The chart below shows the same valuation measure on log scale, versus actual subsequent S&P 500 nominal total returns over the following 12-year period, in data since 1928.
It’s tempting to believe that because the bubble has not burst, it must not be a bubble, and if it is, it must be immune to bursting.
Nowhere is this notion more prevalent than the current meme circulating under the moniker of “The Inelastic Market Hypothesis.” In a nutshell, this is the idea that as investors passively pour money “into” the stock market (sigh), if existing holders are reluctant to sell, prices can advance and retain that advance permanently. The argument seems to trace to an NBER working paper a few years ago, containing assertions like “the price impact is perfectly long-lasting. This is not necessarily because flows release information, but instead simply because the permanent shift in the demand for stocks must create a permanent shift in their equilibrium price.”
The problem is that such an assertion implies that “flows” effectively divorce price movements from their underlying cash flows, and investors permanently accumulate stocks regardless of the long-term returns implied by their cash flows. This is our very definition of a bubble.
One would expect economists to recognize that every “flow in” is a “flow out.” As it happens the authors do, but in my view, in the sketchiest way possible. Essentially, because of the way they define “flows”, the increase in price is itself the source of the “flow.” As the paper puts it, “the net total flow is 0, as one bond removed from one fund goes to another fund, and the net amount of equities purchased is 0, as the net amount of shares is constant. Hence, there is a well-defined notion of “the aggregate flow into equities,” which is generically non-zero, even though “for every buyer there is a seller.”
Sketch.
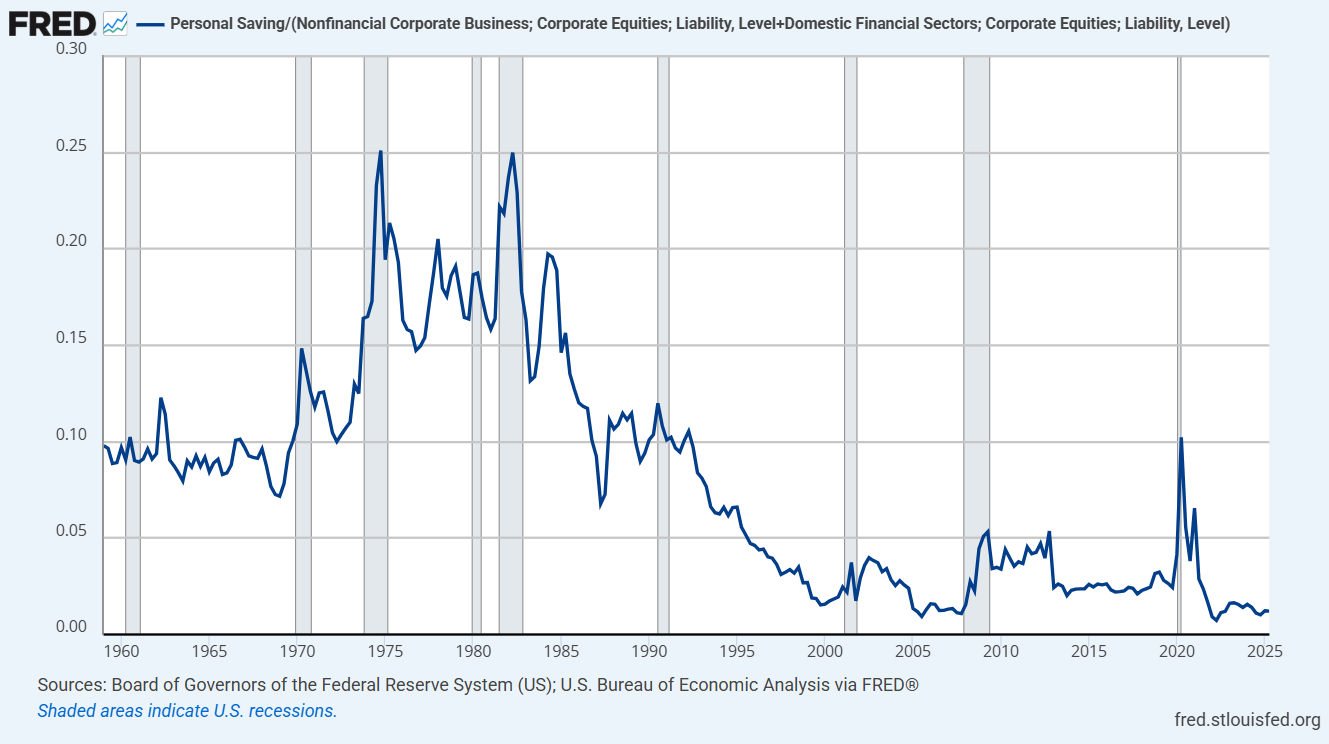
For what it’s worth, it’s also useful to point out that even if every dollar of personal saving could somehow violate the laws of equilibrium by going “into” stocks without coming “out,” and without requiring new issuance (which would satisfy the new demand with new supply without impacting prices), the fact is that total U.S. personal savings amount to scarcely 1% of outstanding U.S. equity market capitalization.
So if you could somehow simply add that “flow” onto existing market cap, it would amount to a bump of about 1%, which is among the smallest ratios of personal saving/U.S. equity market cap in history – though matching levels of 2000, 2007 and 2022.
Hey, why do those dates ring a bell?
Look. I don’t want to criticize the well-intentioned work of others, so I’ll leave it there, but it’s important to remember that there’s a mathematical relationship between prices, cash flows and subsequent returns. It’s not surprising that theories promising “the price impact is perfectly long lasting” will become popular at exactly the same moment valuations have pushed to record highs. As Galbraith wrote about crowd psychology preceding the 1929-1932 collapse, “It was still necessary to reassure those who required some tie, however tenuous, to reality.”
So here we are, at the most extreme point to-date in what I continue to view as the third great speculative bubble in U.S. history. In my view, the appeal to an “inelastic market hypothesis” is an attempt to inject some sort of theoretical formalism around the idea that no price, no valuation, is too high.
As long as they are in, they have a strong pecuniary commitment to the belief in the unique personal intelligence that tells them there will be yet more.
John Kenneth Galbraith, A Short History of Financial Euphoria
The “cash on the sidelines” is there because the Fed put it there
I probably don’t need to repeat this, but I will because every hour watching CNBC is an hour being reminded that many Wall Street professionals (and virtually no financial TV anchors) have been taught how equilibrium works. The multi-trillion dollar pile of paper, bank, and money market deposits that people call “cash on the sidelines” is there because the Fed put it there. Someone has to hold every dollar of those Fed liabilities, at every moment in time, until the Fed retires them by shrinking its balance sheet.
It’s fascinating to hear people on CNBC repeating, “at some point this cash is going to come into the market.” No. No, it’s not. If interest rates come down, people may become more uncomfortable holding cash, and they even trade their cash for stocks if they’re willing to pay the most extreme valuations in history. But the cash doesn’t morph into stocks.
If you use your “cash” to buy stocks, the seller of the stocks gets that cash. It can’t turn “into” something else. It will remain “cash on the sidelines” because there are no sidelines. It is what it is. It will go away when the Fed shrinks its balance sheet, or not. Go ahead and add all the T-bills the U.S. Treasury has issued with less than about 14 days to maturity, because someone has to hold those too, they’re probably held by money-market funds, and they’ll only go away if the Treasury pays them off without re-issuing new ones.
In any event, make no mistake. Given the current size of the Fed’s balance sheet, short-term interest rates will go up or down not because the Fed has made “money” scarcer or more plentiful. Short-term interest rates will go up or down because the Fed changes the rate of interest it pays banks to hold those reserves. As you can see from the “liquidity preference” curve we discussed earlier, the Fed’s balance sheet would have to shrink well below 10% of GDP before market forces alone could keep interest rates above zero. Prior to QE, the historical norm was about 6-8% of GDP.
Meanwhile, the very notion that the “cash” itself matters – rather than market valuations, or the long-term returns implied by those valuations – is precisely why we’re in a bubble. That’s fine. We’ve adapted, particularly given last September’s hedging implementation (see Asking a Better Question, Subsets and Sensibility, and the section titled “The Martian” in The Turtle and the Pendulum).
We don’t need the bubble to end. Ever. We do prefer some amount of market fluctuation to diagonal ramps (more below), but that’s it. If our discipline can be defensive yet still do well year-over-year at unprecedented valuation extremes, the “permabear” label has no thorns.
Still, for the record, yes, I expect this bubble to collapse.
On bonds and interest rates
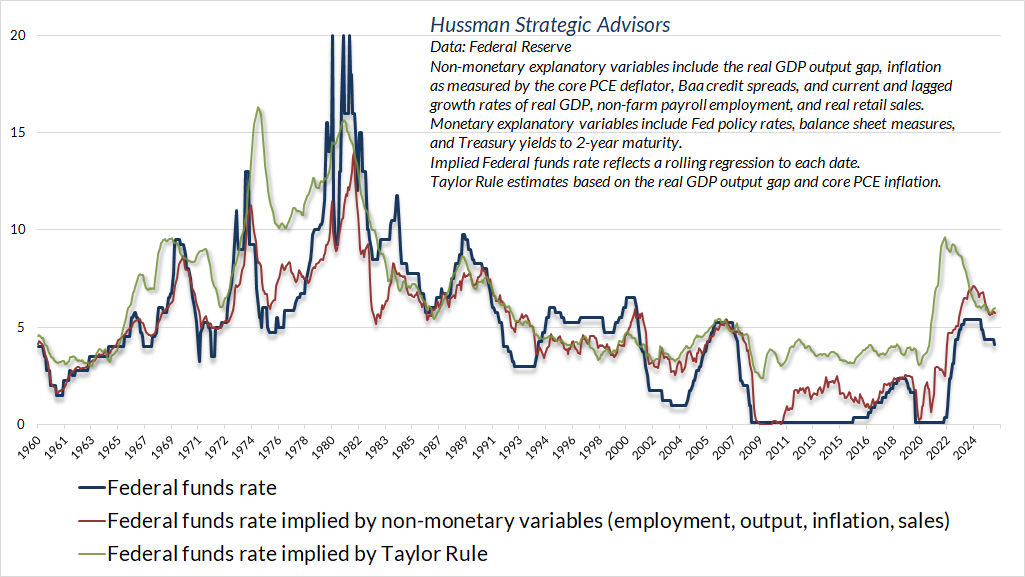
The U.S. economy continues to hover near the threshold that has normally distinguished expansions from recessions. Given the weak relationship between changes in short-term interest rates and changes in economic variables like inflation and unemployment, I wince every time people on TV talk about Fed policy as if a 100 basis point change in Fed Funds would have anything but a minor impact on those variables. Still, given that these voices are nearly impossible to escape, it’s worth noting the Fed funds rate remains below, not above, the level that would historically be associated with “systematic” policy benchmarks, based on prevailing levels of inflation, GDP growth, unemployment, the real GDP output gap, real retail sales growth, and other variables.
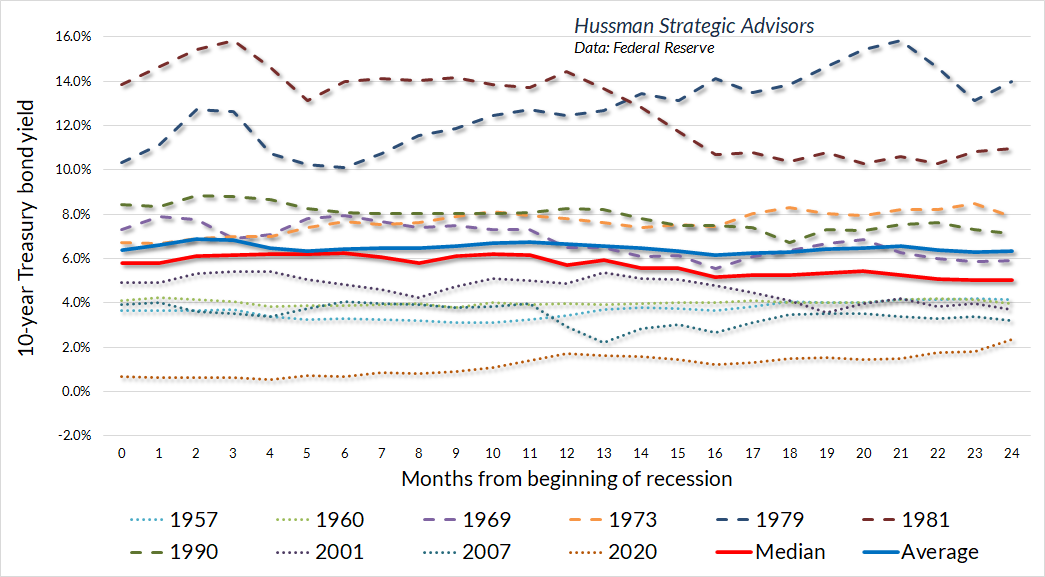
It’s worth noting that even if we’re on the verge of a recession, it doesn’t follow that investors should be chasing bonds here. While investors seem to imagine that recessions are associated with hard declines in 10-year Treasury yields, most of that belief is an artifact of the 1979-1982 period of recession and disinflation. Apart from that episode, bond yields rarely change by much during the first year of a recession.
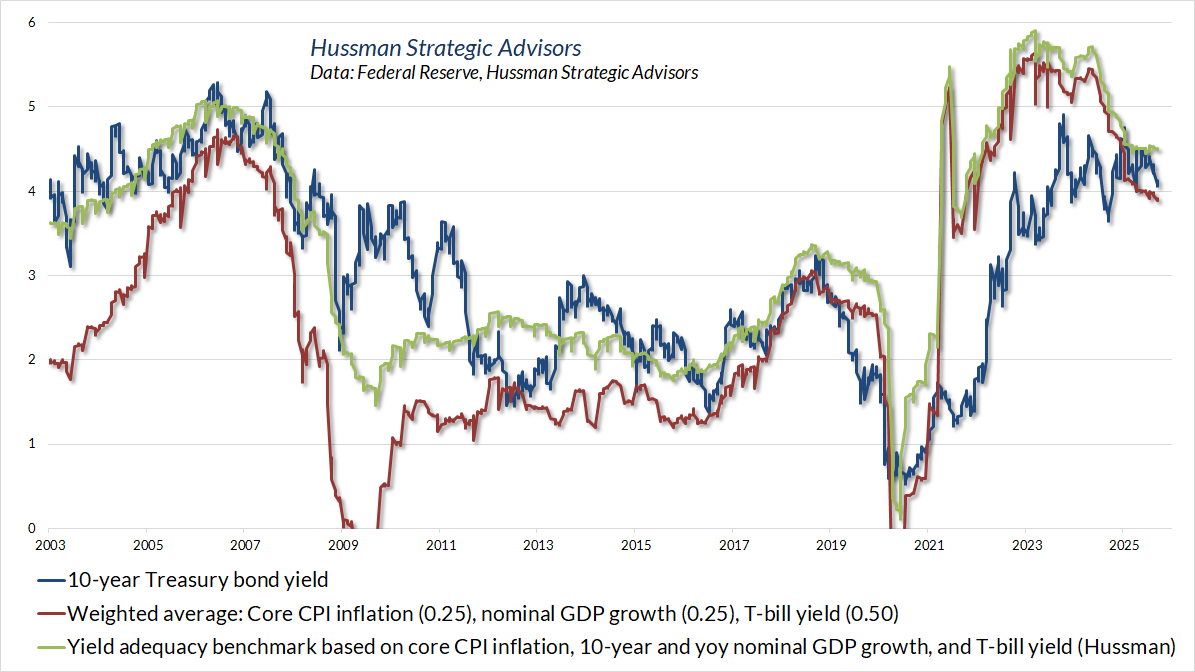
That point is important, given that 10-year Treasury yields have retreated to levels that we presently view as slightly inadequate. They’re fine, and probably about right given the prospect of further economic weakness and gradual cuts in short-term interest rates, but they’re just borderline fine.
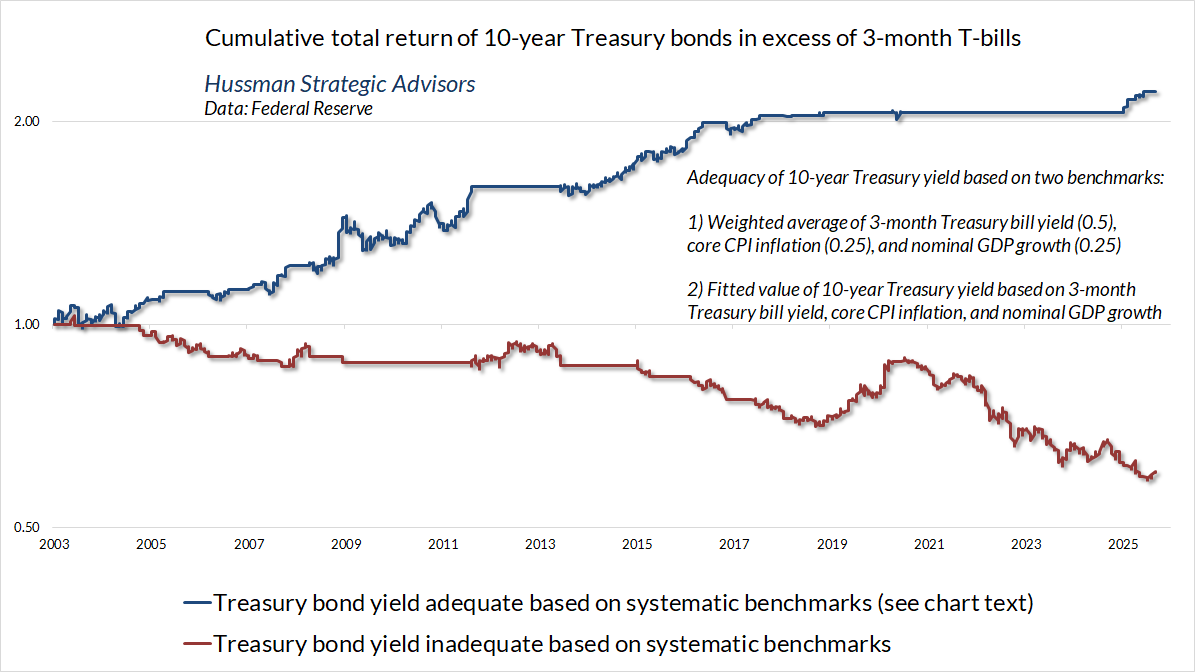
The chart below shows the cumulative total return of 10-year Treasury bonds, over-and-above the returns on T-bills, based on whether bond yields were “adequate” or “inadequate” relative to the benchmarks shown above. The same profile holds in data going back to the 1950’s. Given that 10-year Treasury yields have now dropped to slightly inadequate levels, we don’t really expect much difference between bond returns and T-bills at present. That will change.
Finite-Time Singularity
There are certain instances across history when the central feature of investor behavior is an “increasingly urgent impulse to buy the dip.” This semi-frantic investor behavior is typically associated with fluctuations that have progressively smaller ranges and progressively steeper slope.
In the book, “Why Markets Crash,” Didier Sornette described these dynamics in terms of what he called a “log-periodic bubble.” I’ve referenced Sornette’s work a few times in recent years: within days of the February 2018 peak (which was followed by a quick market loss of 10% and a secondary decline later in the year that brought the overall loss to nearly 20%), late-2021 a few weeks before the January 2022 market peak, and again in February of this year, within a few days prior to the interim peak that preceded current extremes.
Sornette offered this description of the market dynamics of bubbles in their final phase. What I’ve described as an “increasingly urgent impulse to buy the dip” is what Sornette describes as a “finite time singularity.”
Since the crash is not a certain deterministic outcome of the bubble, it remains rational for investors to remain in the market provided they are compensated by a higher rate of growth of the bubble for taking the risk of a crash, because there is a finite probability of ‘landing smoothly,’ that is, of attaining the end of the bubble without crash.
The market return from today to tomorrow is proportional to the crash hazard rate. In essence, investors must be compensated by a higher return in order to be induced to hold an asset that might crash. As the price variation speeds up, the no-arbitrage conditions, together with rational expectations, then imply that there must be an underlying risk, not yet revealed in the price dynamics, which justifies this apparent free ride and free lunch. The fundamental logic here is that the no-arbitrage condition, together with rational expectations, automatically implies a dramatic increase of a risk looming ahead each time the price appreciates significantly, such as in a speculative frenzy or in a bubble. This is the conclusion that rational traders will reach.”
– Didier Sornette, Why Markets Crash
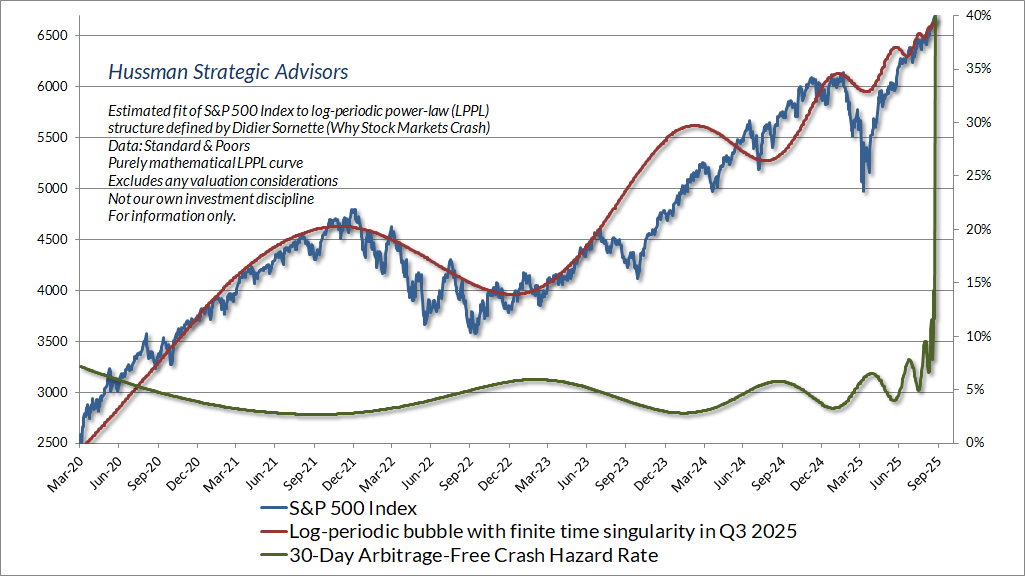
The chart below shows our current parameterization of Sornette’s log-periodic structure, applied to the S&P 500 Index. Needless to say, the April tariff panic wasn’t something that this kind of smooth structure can capture well. Still, unless we allow for the slope of the current market advance to become quite literally infinite, it’s difficult to closely fit the broad overall advance since 2020, coupled with the recent diagonal ramp, without setting the “finite-time singularity” – the point at which instability typically emerges – within a few days of the present date.
Notably, the singularity is not the date of a “crash.” Rather, it’s the point where the pitch of the advance reaches its extreme. This can simply be an inflection point (as was the case for a few singularities between 2013 and 2017), it can precede a material correction, or it can mark a pre-crash peak.
In either case, we’ve essentially reached the singularity, which you can see in that 30-day crash-hazard rate.
I’ll say this again (and again): nothing in our investment discipline relies on a market collapse, and no forecasts or scenarios are required. But my preference is to share my work, and interesting things I’m looking at, for free, despite having bottles thrown at me by drunk speculators like it’s a scene out of the Blues Brothers.
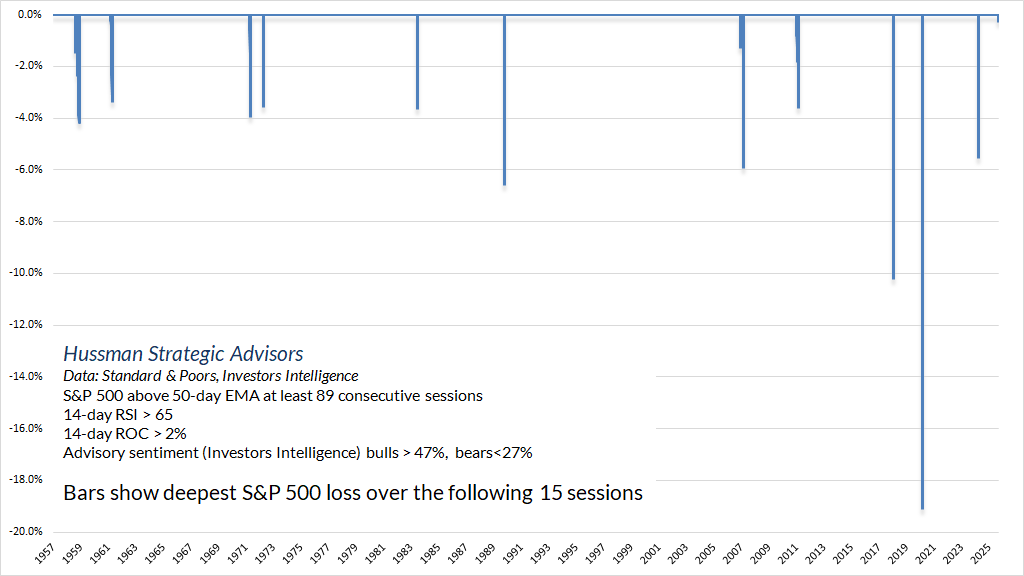
On a related observation, we’ve now gone 100 days with the S&P 500 above its 50-day moving average. That’s not our ideal situation, since even the hedging implementation we introduced a year ago prefers some amount of fluctuation to a diagonal, hypervalued advance with an increasingly narrow daily range.
For better or worse, these instances tend to be impermanent, and once you get beyond about 90 days without breaching that 50-day average (assuming investors are at least somewhat bullish), the market typically hits an air pocket of at least 4-6% within the next few weeks. It can be deeper of course, and it’s also possible we get nothing. My guess is 4-6% straight down, which is the standard outcome. That might be a starter, or it might be all we get for a while. Fortunately, no forecasts or scenarios are required.
Technological singularity
Finally, on the subject “singularity,” it’s worth briefly discussing the use of that term as it applies to technology and artificial intelligence. In the 1950’s, John von Neumann wrote: “The ever-accelerating progress of technology and changes in the mode of human life gives the appearance of approaching some essential singularity in the history of the race, beyond which human affairs, as we know them, could not continue.”
There are numerous versions of that sentiment, ranging from human extinction, to the moment that AI becomes self-aware, or both. These scenarios typically evoke the Terminator movies, but my own favorite is the Matthew Broderick movie War Games. If you’ve never seen it, you’re missing out.
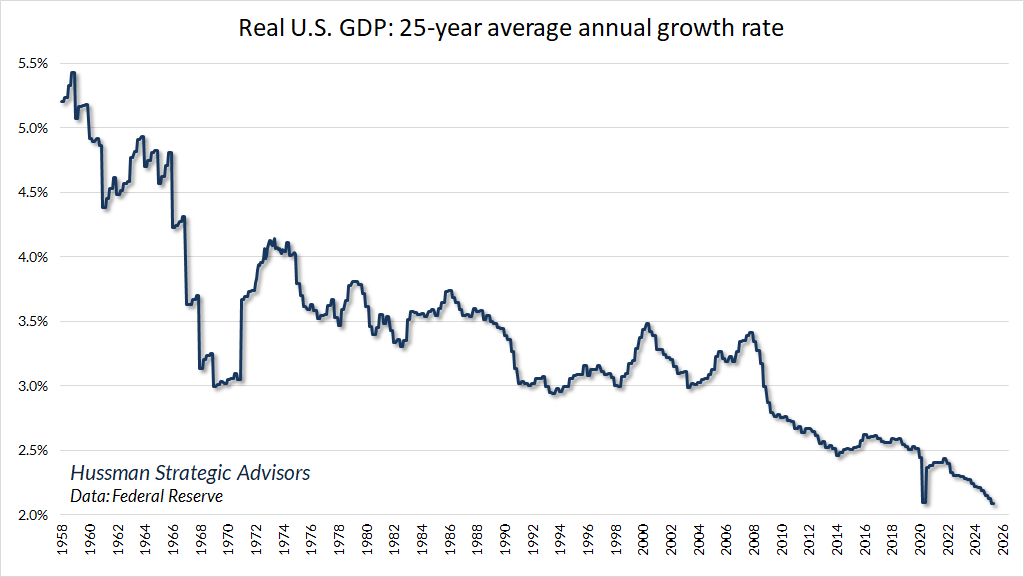
Whenever one mentions AI, the central focus of investors seems to be on visions of enormous future corporate profits and ever-accelerating economic growth. I think that exuberance will prove to be off the mark. Consider the profound impact of the internet, smart phones, social media, the sequencing of the human genome, and all of the life-changing technologies of the past 25 years. One might imagine that economic growth over the past 25 years must have been higher than over any 25-year span in history. In fact, it is the lowest.
I’ve said this before, and I realize you’re not going to believe me: Most of the impact of new technologies is dispersed over time – a great deal of the “surplus” initially observed as profit becomes non-monetary “consumer surplus.” New technologies produce benefits that take the form of convenience, utility, improved customer experience, new forms of activity, and other intangibles. These changes may be reflected to some extent in productivity figures, but they don’t cause a wholesale change in the way that economics work. As I wrote last year in the Financial Times, “the entire history of entrepreneurial capitalism is made of no substance other than the repeated succession of new eras, one upon the next, like layers of sedimentary rock, or rings in the trunk of an ancient tree.”
Yes, the complete abdication of anti-trust considerations in recent decades has produced a sort of winner-take-all economic dynamic among individual companies. But the advancement of technology itself makes even these monopolies vulnerable, which is why some of the largest cap stocks in 2000 have languished with total returns well below the overall return of the S&P 500 in the decades since.
Moreover, it’s taken a multi-year bubble, and an advance to the highest valuations in U.S. history, simply to bring the average annual nominal total return of the S&P 500 since the 2000 market peak to 7.9%.
Don’t get me wrong. I think artificial intelligence is mind-boggling in its capacity to generate content and accelerate almost any kind of research and development. I’m also convinced of two things – the less you’re willing to think, the more vulnerable you are to having AI think for you, and the more you’re willing to think, the greater the opportunity you have for AI to leverage your insight. As individuals, and as a society, we can go either way with that choice. Our most urgent focus should be on that choice.
As we’ve seen with social media, the potential for compartmentalized information feeds and information tuned to maximize engagement for the sake of profit – with zero “model weight” placed on enrichment or even basic elements like civility, compassion, or kindness, is a real danger as we get attached to these machines. Unfortunately, Wall Street will be complicit, at every step, in nudging toward the profit focus. As Art Cashin once observed over dinner – “If there was a report tomorrow that heroin addiction was skyrocketing among teens, the first question you’d hear on Wall Street is ‘Who makes the needles?’”
These devices in front of us, and in our hands, have so much capacity to bring us together, and so much capacity to tear us apart. The problem is that they’re absolutely indifferent, and we owe it to ourselves to look carefully at how we use them. They can be incredibly useful, or incredibly destructive, and they don’t care. Nobody is going to be responsible for us, nobody is going to be kind for us, nobody is going to be compassionate for us, nobody is going to take care of others for us. The devices aren’t going to do it for us, particularly when they amplify voices that thrive on division. It’s up to us to model and nurture what we want to see in the world, and maybe even encourage others to come along.
There’s so much being modeled right now that encourages us to isolate and divide ourselves. But amidst it all, every one of us is made of one shared substance, our common humanity. If we’re deeply, and not just superficially aware of the suffering or relief that we can create for others, aware that we might be them but for circumstances of birth and opportunity, we may get an insight – what to do, what not to do.
Silicon Valley seems to think that we’re somehow going to compensate for humanity’s faults with digital technologies. I don’t think humans are obsolete. I don’t think humans are the problem, I think humans are the solution. I believe that there are essential values and qualities of people that are not making the translation into the digital realm. Maybe they can’t quite be quantified, and maybe that’s the part of humanity that we should be exploring. Instead, we seem to be forgetting about them and that concerns me. So, Team Human is an argument that being human is a team sport and anything that connects us to one another is good and pro-human. Anything that isolates us from each other is anti-human.
– Douglas Rushkoff, Team Human, 2019
Geek’s Note
Here’s a fun way to see how singularity messes things up.
Start with x = 1
Multiply both sides by x. Then x^2 = x
Subtract 1 from both sides. Then x^2 – 1 = x – 1
Factor the left-hand side: Then (x – 1)(x + 1) = x – 1
Cancel (x – 1) from both sides: Then x + 1 = 1
Substitute x = 1, which was the first statement: Then 2 = 1
The singularity here is the cancel step. It’s a subtle divide-by-zero.
Keep Me Informed
Please enter your email address to be notified of new content, including market commentary and special updates.
Thank you for your interest in the Hussman Funds.
100% Spam-free. No list sharing. No solicitations. Opt-out anytime with one click.
By submitting this form, you consent to receive news and commentary, at no cost, from Hussman Strategic Advisors, News & Commentary, Cincinnati OH, 45246. https://www.hussmanfunds.com. You can revoke your consent to receive emails at any time by clicking the unsubscribe link at the bottom of every email. Emails are serviced by Constant Contact.
The foregoing comments represent the general investment analysis and economic views of the Advisor, and are provided solely for the purpose of information, instruction and discourse.
Prospectuses for the Hussman Strategic Market Cycle Fund, the Hussman Strategic Total Return Fund, and the Hussman Strategic Allocation Fund, as well as Fund reports and other information, are available by clicking Prospectus & Reports under “The Funds” menu button on any page of this website.
The S&P 500 Index is a commonly recognized, capitalization-weighted index of 500 widely-held equity securities, designed to measure broad U.S. equity performance. The Bloomberg U.S. Aggregate Bond Index is made up of the Bloomberg U.S. Government/Corporate Bond Index, Mortgage-Backed Securities Index, and Asset-Backed Securities Index, including securities that are of investment grade quality or better, have at least one year to maturity, and have an outstanding par value of at least $100 million. The Bloomberg US EQ:FI 60:40 Index is designed to measure cross-asset market performance in the U.S. The index rebalances monthly to 60% equities and 40% fixed income. The equity and fixed income allocation is represented by Bloomberg U.S. Large Cap Index and Bloomberg U.S. Aggregate Index. You cannot invest directly in an index.
Estimates of prospective return and risk for equities, bonds, and other financial markets are forward-looking statements based the analysis and reasonable beliefs of Hussman Strategic Advisors. They are not a guarantee of future performance, and are not indicative of the prospective returns of any of the Hussman Funds. Actual returns may differ substantially from the estimates provided. Estimates of prospective long-term returns for the S&P 500 reflect our standard valuation methodology, focusing on the relationship between current market prices and earnings, dividends and other fundamentals, adjusted for variability over the economic cycle. Further details relating to MarketCap/GVA (the ratio of nonfinancial market capitalization to gross-value added, including estimated foreign revenues) and our Margin-Adjusted P/E (MAPE) can be found in the Market Comment Archive under the Knowledge Center tab of this website. MarketCap/GVA: Hussman 05/18/15. MAPE: Hussman 05/05/14, Hussman 09/04/17.