
Containing the Crisis

John P. Hussman, Ph.D.
President, Hussman Investment Trust
Late-April 2020
Every new case in every new location acts as local ‘patient zero.’
– John P. Hussman, Ph.D., February 3, 2020
There are several important topics in this comment.
One addresses public health, extends the discussion of SARS-CoV2 (COVID-19) that I began on February 2, when the U.S. had only 5 cases, and the continuing need for crisis response.
One addresses financial market conditions, and the appropriate decision tree in the face of changing conditions.
One addresses the implications of the Federal Reserve’s announced plan to make leveraged purchases of uncollateralized corporate bonds, at public risk, which would serve not to provide new loans to corporations, states, or municipalities, but instead to bail out investors and speculators at near-record valuations (a plan that is unlikely to survive challenge from Congress because it explicitly violates Section 13(3) of the Federal Reserve Act and Section 4003(c)(3)(B) of the CARES act).
One addresses the U.S. economic situation, prospects for recovery, and the structure of economic policies that would be most supportive of families, businesses, and near-term resilience.
Let’s dive in.
Public health note – SARSCoV2/COVID-19
I worry that the virus is more patient than people are.
– Ron Klain, U.S. Ebola Response Coordinator 2014-2015, March 20, 2020
In recent days, just as COVID-19 daily new cases reached their peak, giving the U.S. its strongest chance to shift from exponential growth to logistic flattening, the impatience of many communities to abandon containment efforts has abruptly pushed the U.S. trajectory off of the “optimistic” scenario. Unfortunately, relaxing containment at the point of “peak” daily new cases also means relaxing containment at the point of peak infectivity. As a result, the best case outcome now includes tens of thousands more U.S. fatalities than were already likely.
One of the benefits of having initiated discussion and analytics about this epidemic back on February 2, when the U.S. had only 5 reported cases, is that it helps to disabuse the idea that case growth and fatalities are independent of containment efforts, or that this epidemic was impossible to foresee. The following is a quick walk through a few of the posts I’ve maintained in a threaded Twitter discussion since then. Note that some of the charts below are for the U.S., and some are for all global cases ex-China. The case and fatality counts are end-of-day figures, and may substantially exceed those from even a day earlier.
Feb 3 (U.S. cases: 11, U.S fatalities 0): Early international seeding – reported U.S. cases rose from 5 to 11 over the weekend w/new locations. Each acts as local “patient zero,” so containment and China flight restrictions look essential. The hopeful news is new case reports down from ~50% to ~27%/day.
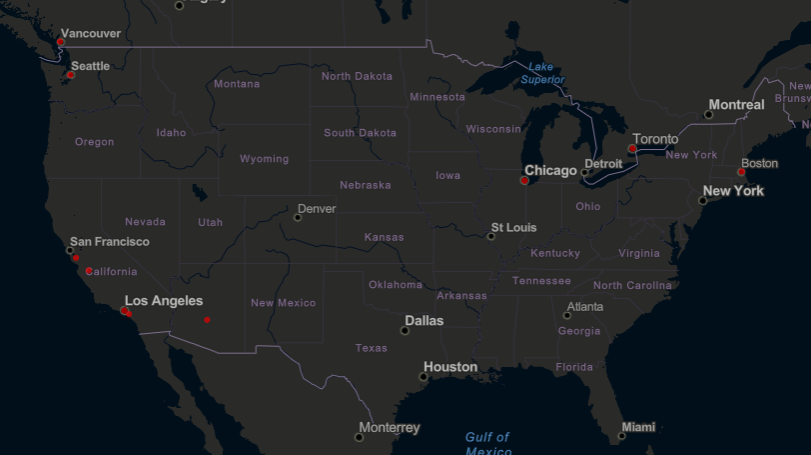
Feb 5 (11, 0): It’s important to remain vigilant about the possibility that unreported cases remain, and we shouldn’t be terribly surprised if they show up near New York, D.C., or Houston. Containment remains critical.
Feb 11 (12, 0): Growth of reported cases outside of China still moving the wrong way. Each case in a new location is local patient zero, so containment remains critical. Potential transmission hubs in New York, D.C. and Houston remain on watch.
Feb 26 (57, 0): While ascertainment of cases remains an issue, containment efforts remain the best way to shift growth from exponential to logistic.
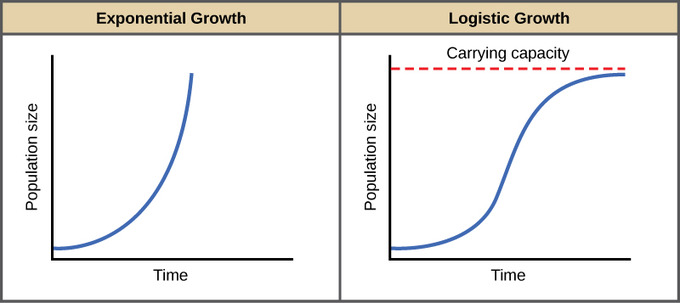
Mar 5 (217, 12): The genie is out of the bottle. The combination of limited testing capacity and high mobility means “community spread” will be a dominant phrase in the days ahead.
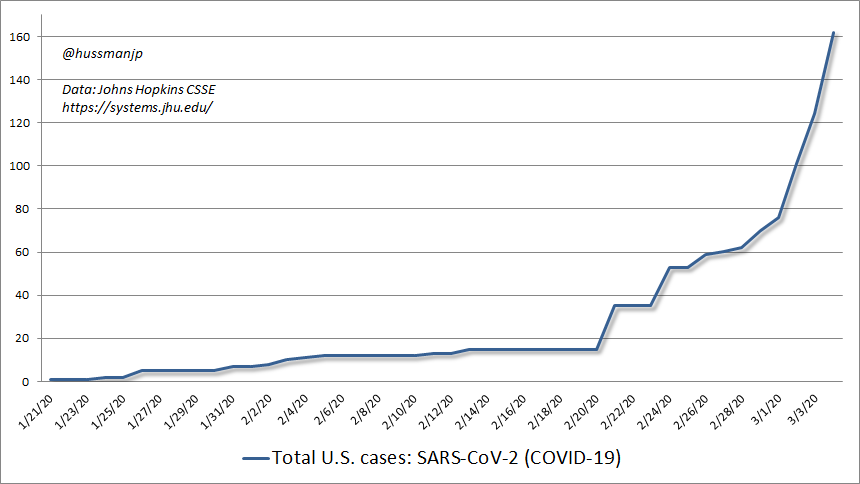
Mar 7 (402, 17): Spent the day in discussions about medical preparedness. Though a vaccine is ~ a year away, and there’s a vacuum of leadership at the top, lots of ongoing work to identify existing options to repurpose for SARSCoV2
Mar 11 (1281, 36): The mortality rate of a SARSCoV2 case, the moment it’s reported, regardless of severity, is already nearly half the mortality rate of a seasonal flu case that’s already been admitted to the hospital (CDC). This is not the flu. Stop it.
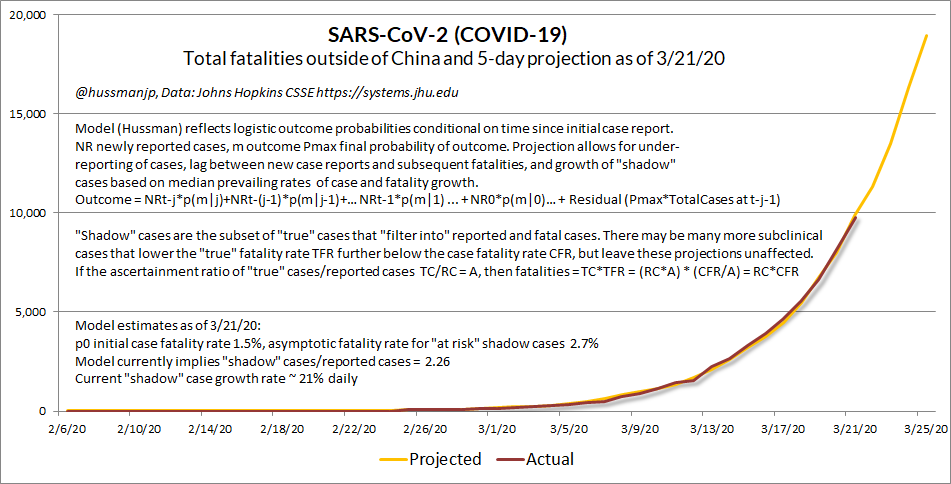
Mar 21 (25,600, 307): I’ve never been so distressed about a model working, but this will help gauge if the curve is flattening. I think a reasonable way to model the trajectory is to observe that even though we can’t know ‘true’ cases, we can monitor the curve (and shifts) by allowing for unobserved ‘shadow’ cases that feed into reports and fatalities, because the ascertainment rate then cancels out.
Mar 30 (161,831, 2,978): SARSCoV2 isn’t a ‘storm’ passing overhead in a few weeks. Every new case in every new location is local “patient zero.” The point of containment is to allow all existing cases to resolve w/minimal new transmission, while building capacity to identify, track & contain new cases.
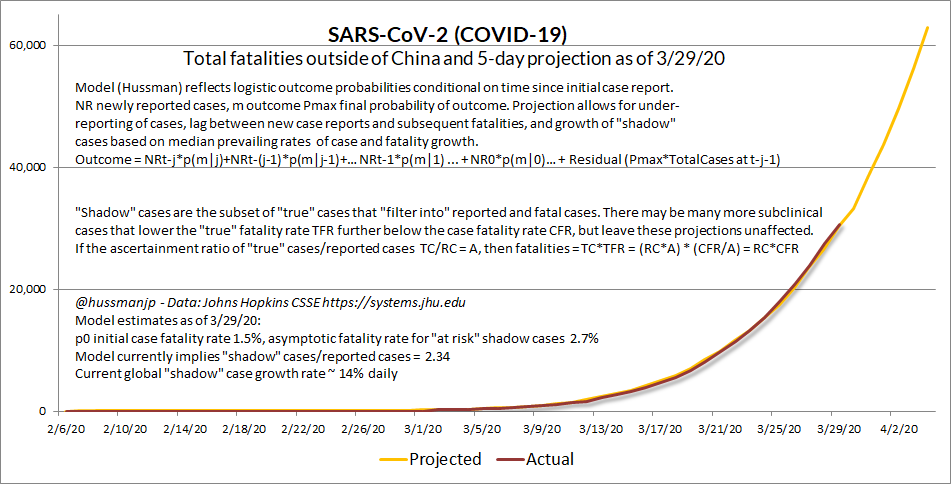
Apr 6 (366,667, 10,783): Estimated an optimistic #SARSCoV2 (#COVID_19) scenario. Requires case growth to fall by half in coming week, to near zero by 4/30. This is a *continued high-containment, low mobility scenario. When people suggest *new cases could “peak” in next 10 days, it would look like this.
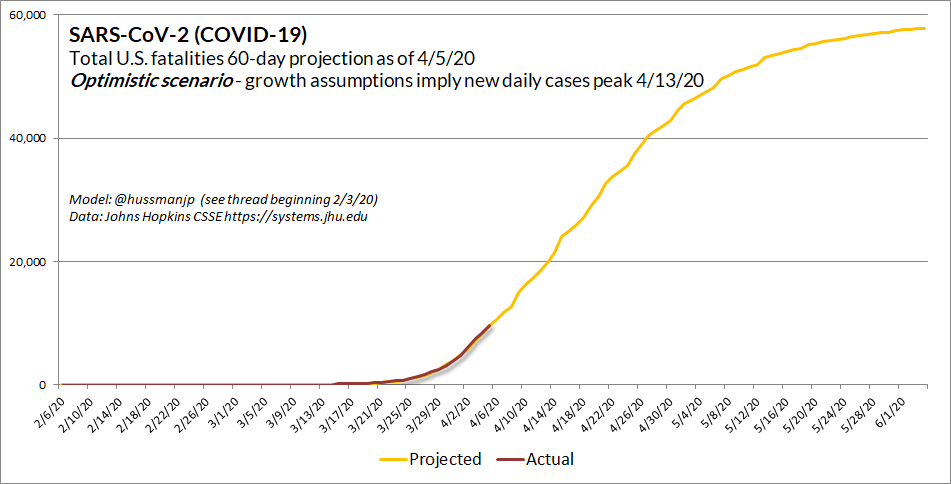
Apr 8 (429,052, 14,695): The hopeful news here is U.S. case growth has slowed to ~10% daily, fatalities to ~17%, and “shadow case” estimate to ~14%. My concern is that people may not realize that this progress is wholly dependent on sustained containment.
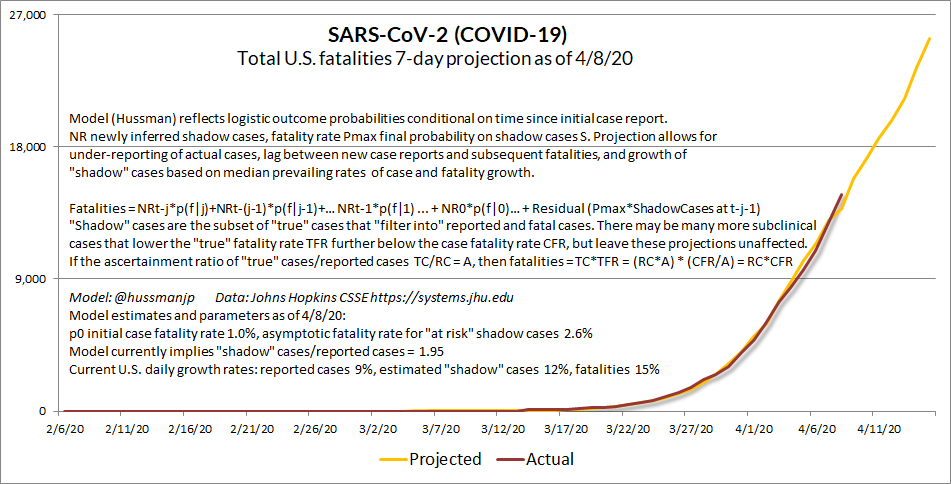
Apr 9 (462,437, 16,478): The hopeful sign: thanks to containment efforts, daily growth rates have eased to 9% (cases), 12% (estimated “shadow” cases), and 15% (fatalities). Chart should bend toward logistic shortly. Even with a desperately needed flattening of the curve from exponential to logistic, even a peaking of daily new cases this week would imply that most U.S. fatalities are ahead.
The caveat: One way to estimate the impact of containment efforts to estimate the expected date of various outcomes using an adaptive model. It is only *continuing containment effort that prevents the future from rushing back toward us.
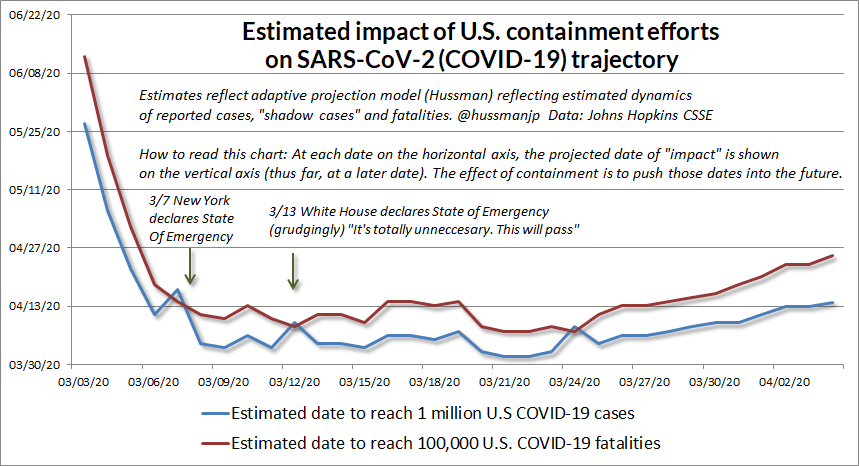
Apr 11 (526,396, 20,463): Even w/sustained containment efforts, most U.S. fatalities are likely ahead, unless the therapeutic response in ICUs more directly considers the inflammatory pathway (IL6/TNF-a/Th17/IL17). My 4/3 memo to research colleagues and NIH/NIAID here.
Apr 15 (637,716, 30,826): Assuming sustained containment efforts, the “optimistic” projection (my adaptive model) suggests that U.S. daily new cases may have peaked. This does NOT mean these efforts can now be abandoned. Most U.S. fatalities are still ahead, and we still lack capacity to test/track/trace.
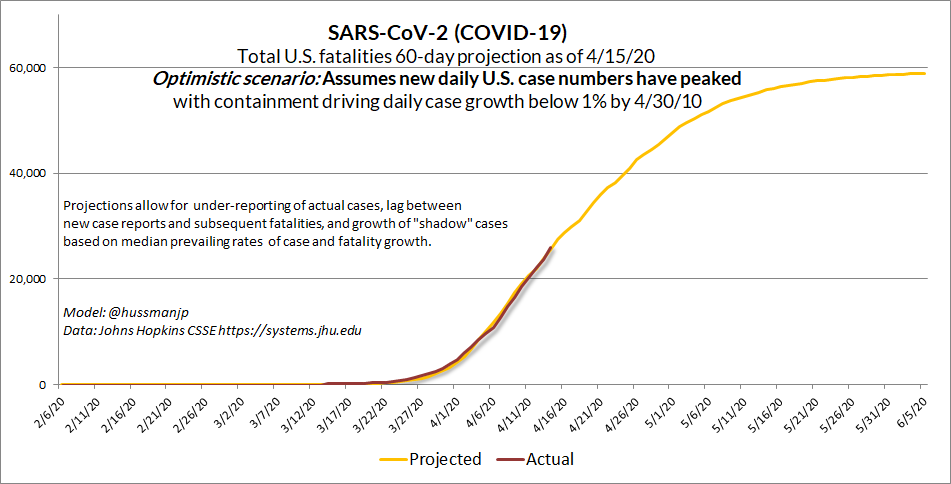
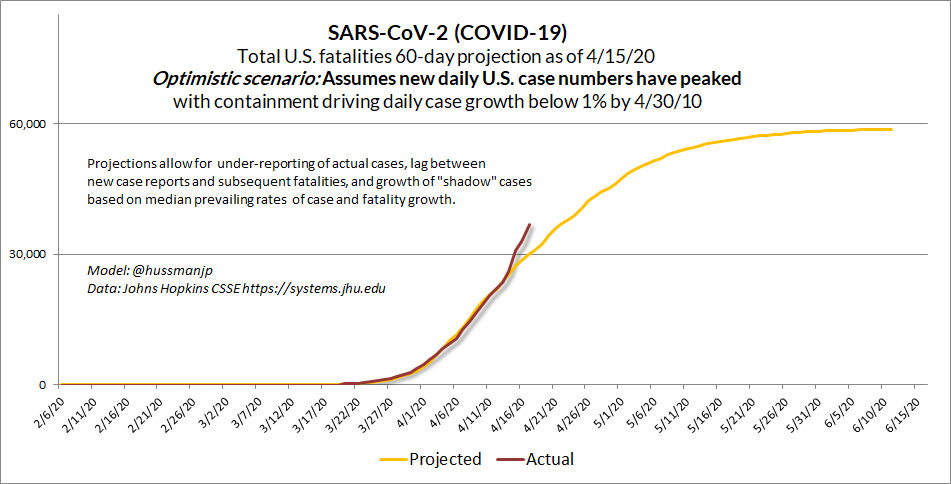
Apr 16 (667,801, 32,917): This isn’t good. U.S. fatalities just jumped off book. We shouldn’t see 31,000 yet.
Apr 18 (735,076, 38,903): So much for the optimistic scenario. We’re way off book. I had hoped this was just a one-time adjustment. Understand this: PEAK daily new cases in a containment scenario is also PEAK infectivity if containment is abandoned at that moment.
Understanding the epidemic curve
One of the frustrating aspects of the current epidemic and its response is that it has spawned a variety of half-informed debates that have little or no bearing on the trajectory of the epidemic.
As I’ve noted since day one, for example, “ascertainment” – the difference between actual cases and reported cases – is clearly an issue. Indeed, as the epidemic has progressed the ratio of fatalities to reported cases has been inexorably rising, regardless of whether one examines total, China, ex-China, or U.S. cases. The reason for this is that “reported” case numbers undoubtedly understate “true” cases, many which may be mild or sub-clinical.
Because we can observe fatalities accurately, but not “true” cases, the progressive under-counting of “true” cases results in a growing “case fatality rate” (CFR) which is calculated as fatalities/reported cases.
Currently, the case fatality rate in most of the world is pushing 7-8%. In the U.S., the CFR is now 5.4%. Whatever one imagines might be true for “unobserved” cases, one thing is not in dispute at all: at the point that someone in the U.S. is actually identified as having COVID-19 (the disease caused by the virus SARS-CoV-2), there is a 5.4% likelihood that the case will be fatal. Take that in.
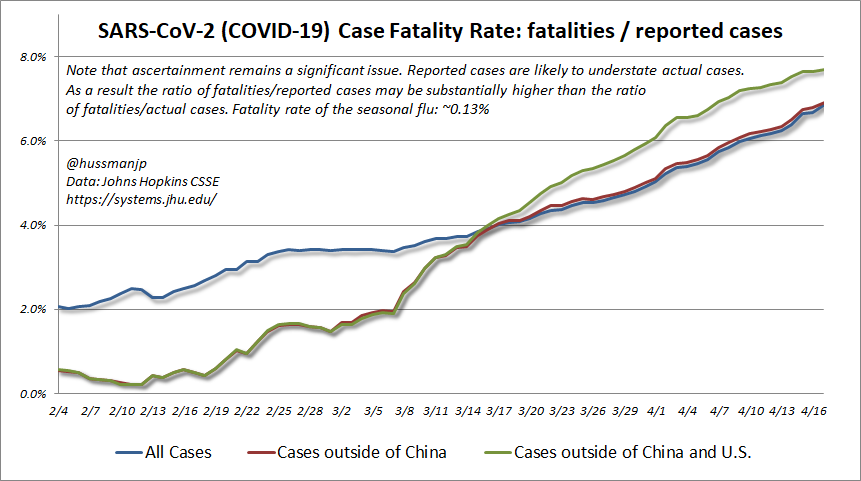
Despite uncertainties about “true” cases and “true” fatality rates, there are clear relationships between various quantities that allow valid and accurate projections about the epidemic. For example, as long as one assumes that the “true” fatality rate is relatively stable and not exploding higher over time, we can take changes in the observed case fatality rate (fatalities/reported cases) as a measure of how quickly actual cases are diverging from reported ones.
Here’s essentially how I’ve modeled this situation (shown in the preceding graphs). Suppose we assume there are 3 types of cases. True cases include all cases – both asymptomatic ones, and “shadow cases” that may or may not be reported, but are always reported if they are fatal. We assume that both the “true” fatality rate and the “shadow” fatality rate are stable; a reasonable assumption that implies that the ratio of shadow cases to true cases is also stable. Finally, reported cases are the subset of “shadow” cases that result in an identified outcome (fatality or recovery).
Well, in that world, we can model the trajectory of cases and fatalities with great precision, and can even obtain a very good estimate of the fatality rate on “shadow cases” – I get 2.8% for both U.S. and global data. My current estimate of shadow cases/reported cases for the U.S. is about 3.6. We can’t observe the ratio of “true” cases to “shadow” cases, but that ascertainment ratio (call it “A”) is actually irrelevant to projected fatalities. The reason is that the “true” fatality rate divides by A, but the “true” number of cases multiplies by A, so A cancels out in the projection of fatality numbers.
Similarly, we know that other quantities like the basic reproductive rate R0, the transmission rate, the duration of infection, and the early case growth rate are also algebraically related. As noted below, those relationships have interesting implications for the appropriate crisis response.
In contrast to the “optimistic” case of fewer than 60,000 U.S. fatalities we could estimate a few weeks ago, we’re now looking at the likelihood of about 90,000 by mid-year, with the potential for far greater numbers if containment is eased without offsetting practices. Put simply, containment substitutes for immunity.
Currently, the case fatality rate in most of the world is pushing 7-8%. In the U.S., the CFR is now 5.4%. Whatever one imagines might be true for “unobserved” cases, one thing is not in dispute at all: at the point that someone in the U.S. is actually identified as having COVID-19 (the disease caused by the virus SARS-CoV-2), there is a 5.4% likelihood that the case will be fatal. Take that in.
Yes, I’m aware of the recent Santa Clara study suggesting that true cases may be 50-85 times reported cases. My reading, frankly, is that when the history of this epidemic is written, that report will be used as a case study in ascertainment bias, representativeness, and extrapolation. It’s astonishing that anyone would think a Facebook ad offering free serologic testing would not enrich 1.5% of one’s sample with actual cases. If people who have recently experienced illness are more likely to respond, the sample will be biased toward those individuals, and the prevalence of positive antibody tests in the sample will be much different from the population average.
Even if these results are valid, the ascertainment ratio still drops out in the calculation of fatalities, and the “optimistic” scenario (if one can use such a word) still approaches 90,000 U.S. fatalities, assuming that current containment efforts are sustained. The other difficulty is that if silent infections are already up to 50 million cases, the base reproductive rate of this virus is far higher than 2.6, which means the percentage of the population that needs to be infected for transmission to stabilize is vastly higher than (1-1/R0=) 62%, and we would still likely see over a quarter-million U.S. fatalities if we were to abandon containment efforts. Again, all of these objects are algebraically related.
A Scottish study similar to the Santa Clara report tested 1000 donated blood samples. None of the 500 samples taken on one day in March were positive. 500 samples taken later in March found 6 positive cases. Four of those positives were drawn from the Edinburgh Health Board area (and we know from prior epidemics that hospitals are important nodes of transmission). The authors wisely concluded “we cannot use the rise in numbers seropositive to infer the contemporary seropositive or the growth rate of the epidemic.” I think that’s exactly the right conclusion.
I should note that I do actually believe that daily case growth has peaked, as a result of recent containment efforts. It’s not clear whether that peak will be durable, but even in the optimistic case that the “peak” is behind us, it’s important to understand that the epidemic curve has a long, fat tail. Cases and fatalities do not simply collapse to zero. Even in the optimistic case, we’re only about half-way through this thing from the standpoint of likely U.S. fatalities.
Moreover, shifts in behavior also produce shifts in the curve. It’s particularly unfortunate, I think, that the push for reduced containment is occurring at precisely the same point the “peak” in new daily cases is being reached. Understand that “peak new daily cases” also means “peak infectivity,” because we currently have the maximum number of infective people out there. What kind of free-range ignorance does it take to encourage people to relax containment efforts at this, the worst of all possible moments? I am concerned that this impatience may prove to be very costly.
Without getting too deep into epidemiology, there are several actions that can make a substantial difference. The growth rate of an infection is driven by how easily the infection passes from one person to another, the length of time a person remains infective, and the frequency of contact between individuals. Social distancing efforts address frequency of contact, so to the extent that those are eased, it’s essential to boost the other modes of defense.
Look. The base reproductive rate of an epidemic is equal to transmission rate (how easily the virus spreads from person to person) times duration (the length of time a case remains infective). If people are going to increase social contact, I’ll come right out and advocate mandatory use of face masks in enclosed areas (where aerosolized respiratory droplets persist for hours, not minutes). That will at least reduce the ease of infection from one person to another. Quarantine of infected individuals is also essential as a substitute for shortening infective duration. It doesn’t matter if the infected person isn’t severely ill – what matters is that the virus remains a transmissible virus just the same.
Look, I understand that people are frustrated, but tens of thousands of Americans are going to be needlessly taken from their families and loved ones if the risks of this virus aren’t taken seriously. This is not the flu, and even if the “true” fatality rate was no higher than the flu (a suggestion that I view as inane), the high reproductive rate would require exposure to reach about 200 million Americans for the virus to become stable, and that itself would imply a quarter-million U.S. fatalities.
Understand that ‘peak new daily cases’ also means ‘peak infectivity,’ because we currently have the maximum number of infective people out there. What kind of free-range ignorance does it take to encourage people to relax containment efforts at this, the worst of all possible moments?
My sense is that many people are eager to run a real-life experiment to test the hypothesis that they, their families, their friends, and the innocent people around them are somehow more immune to this virus than the people of New York have been.
A final note. Those of you who know me understand that my finance work has two purposes: to serve others, and to fund charitable research and assistance on behalf of public health and vulnerable populations. Most of my own research is in statistical genetics, autism, and molecular pathway analysis.
My impression is that the best way to blunt the impact of this virus once a case hits the ICU is for intensivists to broaden therapeutic modalities to include therapeutics that directly modulate the storm of inflammatory cytokines (particularly on the IL-6/TNF/IL-17 axis) that result from disrupted immune pathways. That hyperinflammatory response in the respiratory system is what actually kills people. If we can blunt fatal impact in the ICU and improve testing capacity and contact-tracing, we may be able to take the teeth from COVID-19.
We came to this crisis with a rich volume of research on prior CoV variants such as the SARS coronavirus. I’ve posted some of my research correspondence with colleagues on the Hussman Foundation website, in hope that it might be a useful addition to the thought process of researchers and clinicians in the difficult weeks ahead (I’ll continue to update this periodically based on emerging research findings). If you know someone in a patient-facing role, I’d appreciate if you would pass this article on: https://www.hussmanfoundation.org/articles/SARSCoV2_Therapeutics.html
Financial market conditions
In an overvalued market lacking trend uniformity, investors are skittish. The market may very well rally strongly for a while, but the underlying structure of the market is vulnerable. In that kind of environment, seemingly irrelevant items of news can cause large and sudden price declines. In historical data, we’ve seen too many examples of seemingly powerful bear market rallies suddenly launching into vertical declines. We do believe that the U.S. is already in recession, and that stocks remain in a bear market likely to generate much more serious losses.
– John P. Hussman, Ph.D., May 14, 2001
Overbought conditions in unfavorable Market Climates tend to be rare. The steepest bear market losses tend to follow immediately on the heels of such overbought conditions.
– John P. Hussman, Ph.D., December 10, 2007
In recent weeks, investors have chased stock prices higher (on relatively dull volume and narrow, cyclical leadership) like kids riding their bikes up a board they’ve laid over a pile of bricks to take a sweet jump. Once in the air, the question is ‘what now?’
– John P. Hussman, Ph.D., May 19, 2008
One of the characteristics of bear market periods is that they alternate between collapses to fresh spike lows, and advancing periods that serve to “clear” the compressed, oversold condition of the market. Having cleared the oversold condition that emerged on a few occasions in March, we now observe the fairly unusual combination of overbought conditions, renewed valuation extremes, and still unfavorable market internals (which we use to infer the inclination of investors toward speculation or risk-aversion). Similar points during the 2000-2002 and 2007-2009 include May 2001, December 2007, and May 2008. All three, in hindsight, had unfortunate consequences.
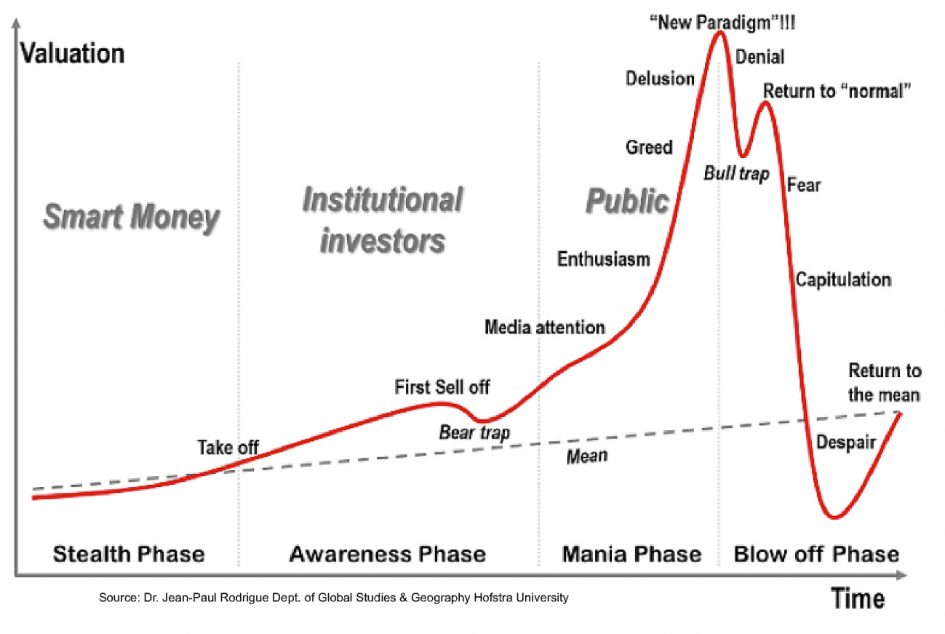
The current position of the market is reminiscent of the “return to normal” trap in John Paul Rodrigue’s familiar chart of speculative bubbles.
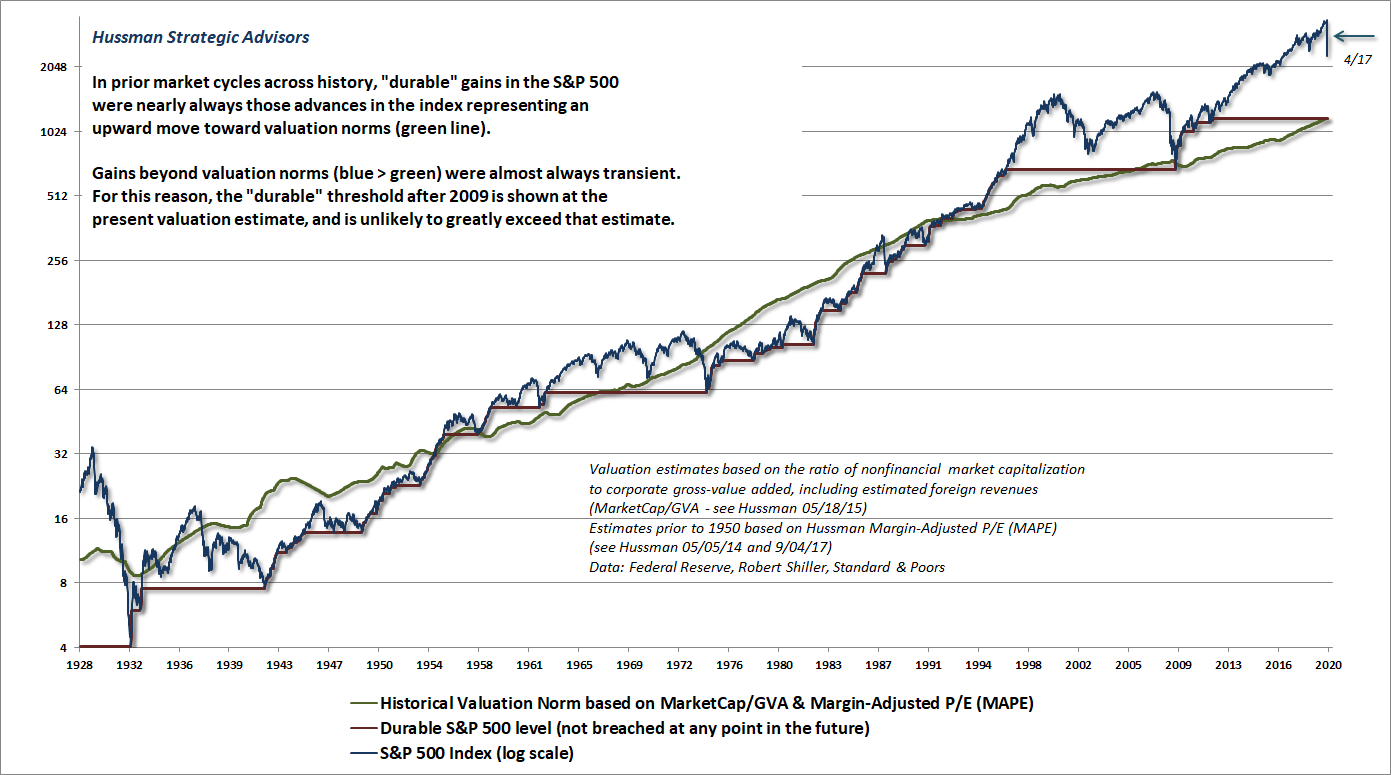
The chart below offers a useful overview of where market valuations stand from a historical perspective. The green line below is based on the two valuation measures we find best-correlated with actual subsequent market returns across a century of market cycles, and shows where the S&P 500 would stand at historically run-of-the-mill valuations (and also run-of-the-mill long-term expected returns).
The blue line shows the actual level of the S&P 500. The red line shows what I call the “durable” level of the S&P 500, and reflects market levels that were not breached at any point in the future. You’ll notice that substantial market advances above that green valuation line were almost always transient, while “durable” market advances typically represented upward moves toward historical valuation norms. At present, run-of-the-mill valuations place the green line slightly below 1200 on the S&P 500 Index.
My sense is that investors remain disoriented about where they actually are in the cycle. The initial selloff shocked them that it’s even possible for stocks to decline at all.
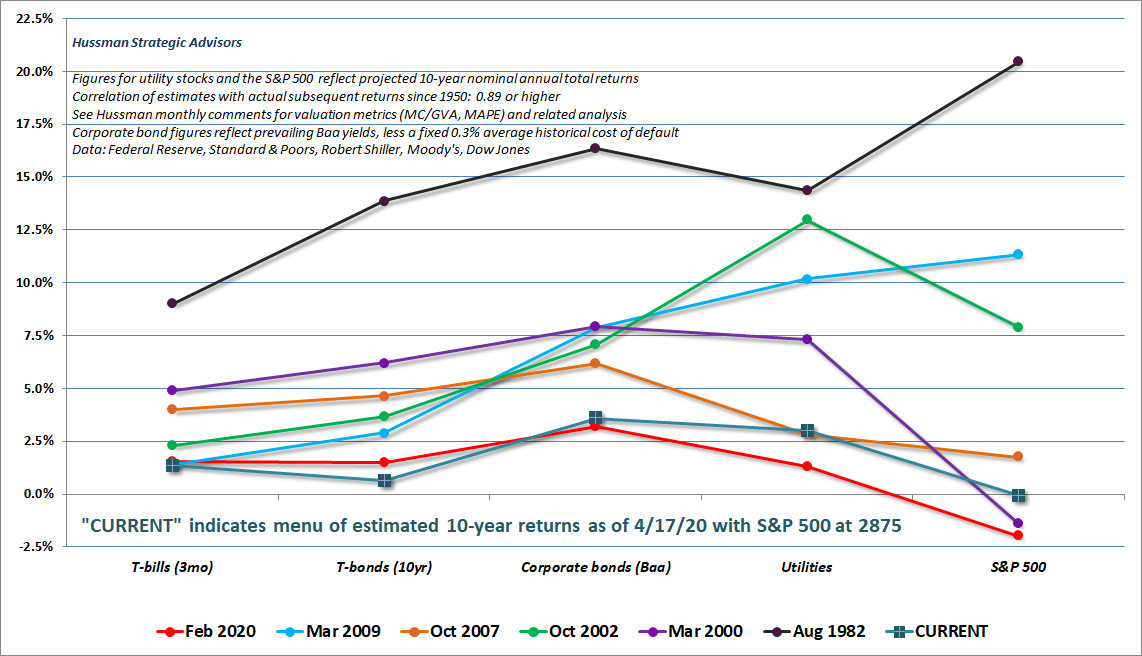
The chart below updates the menu of expected 10-year returns that we presently estimate across various investment classes here. These are based on the most reliable valuation measures we use, and each of these projections has a correlation of 0.89 or higher with the actual subsequent returns of each asset class, in market cycles across history.
The “CURRENT” line shows the menu of investment alternatives as of Friday, April 17. Probably the most striking feature of this menu is that our estimate of 10-year S&P 500 total returns is back down to zero.
Meanwhile, our measures of market internals remain clearly negative here, and are ragged enough that a shift to the uniformity we associate with “speculation” is not even close. As a result, I presently view the recent advance as a “clearing rally” to relieve the oversold compression that I noted at the market lows. Again, we currently observe the fairly unusual combination of overbought conditions, renewed valuation extremes, and still unfavorable market internals.
For now, the combination of extreme valuations, divergent market internals, and overextended conditions creates a ‘trap door’ situation. Until a shift to more uniform market internals signals a broader willingness of investors to speculate, even easy money does not remove downside risk here.
This is a moment that provides the opportunity to adjust one’s investment exposure to full-cycle risk, not a time to chase what Wall Street calls a “buying opportunity,” just 15% from the most extreme valuations in history, at levels on the S&P 500 that currently match the January 2018 market high, and that were never seen before that date.
Yes, if market internals become uniformly favorable, even at these valuations, our investment outlook would shift to a more neutral view. Possibly even to something that might be described as “constructive, with a safety-net.” For now, the combination of extreme valuations, divergent market internals, and overextended conditions creates a “trap door” situation. Until a shift to more uniform market internals signals a broader willingness of investors to speculate, even easy money does not remove downside risk here.
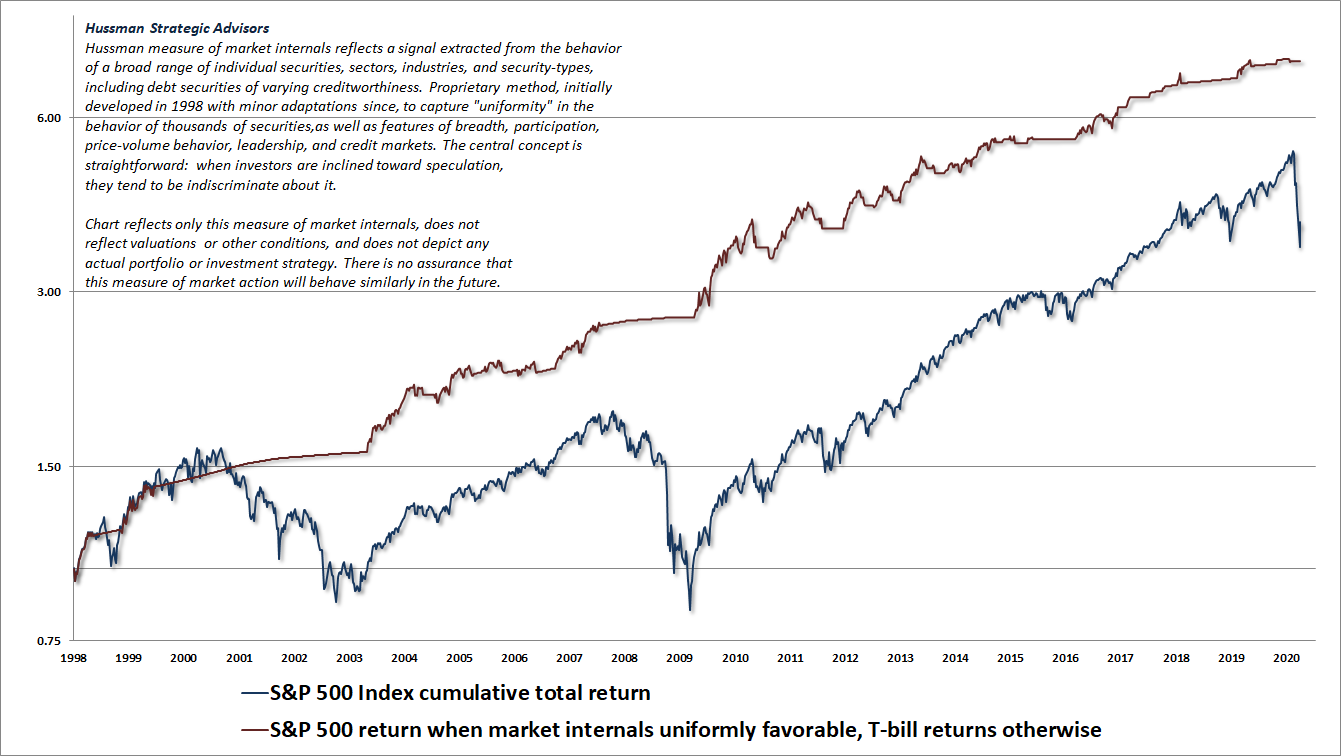
I fully expect that we will have opportunities to adopt a constructive, unhedged or leveraged investment outlook over the completion of this cycle (which I’ve done after every bear market collapse in over three decades). In the meantime, it’s worth committing this to memory: The most favorable market return/risk profiles we identify are associated with a material retreat in valuations that is then joined by an improvement in our measures of market internals.
We’ve got to play the wind too
It is important to note, however, that overvaluation alone does not determine market direction. When the market is able to recruit ‘trend uniformity’ across a wide range of market internals, an overvalued market can easily become more overvalued. Essentially, trend uniformity means that investors are increasingly willing to take stock-market risk. If the market can recruit sufficient trend uniformity, we will quickly establish a constructive position. Trend uniformity is not something that most investors consider, but it is critical, particularly when placed in the context of valuations.
– John P. Hussman, Ph.D., May 14, 2001
One might wonder why the combination of valuations and market internals (what I used to call “trend uniformity”) was so effective in helping us repeatedly navigate complete market cycles prior to this one, and yet failed during most recent bull market. The answer is simple. Valuations and internals weren’t the problem.
It’s important to understand this: the combination of valuations and internals remained beautifully effective in the recent cycle – even in the face of quantitative easing by the Federal Reserve. It was a third feature of our investment discipline – our response to certain overextended “limits,” that we were forced to abandon.
Put simply, we’ve become content to measure the presence of speculation or risk-aversion, without assuming that there is a definable limit to either.
I openly discuss this in nearly every one of my market comments. These two paragraphs (from my July 2019 comment) provide the clearest summary of both my error in the recent bull market, and our late-2017 adaptation:
“As I’ve detailed extensively, both valuations and market internals performed beautifully in the recent complete market cycle, as they have historically. My error in recent years was due to a different consideration: my pre-emptive bearish response to ‘overvalued, overbought, overbullish’ syndromes that had generally signaled a ‘limit’ to speculation in prior market cycles across history. Because of their reliability across history, we prioritized those syndromes following our 2009-2010 stress-testing exercise against Depression-era data. In hindsight, amid the novelty of quantitative easing and zero-interest rate policy, our pre-emptive bearish response to those ‘overvalued, overbought, overbullish’ syndromes turned out to be detrimental. No incremental adaptation was enough until I threw my hands up in late-2017 and completely abandoned the notion that it was still possible to define any ‘limit’ to speculation.
Since then, our requirement has been straightforward: Regardless of how extreme valuations or other conditions might become, we will defer adopting or amplifying a ‘bearish’ investment outlook unless our measures of internals have explicitly deteriorated. Some conditions may be extreme enough to justify a neutral outlook, but a bearish outlook requires deterioration in internals, signaling that investors have shifted toward risk-aversion. That single requirement would have dramatically improved our experience in this half-cycle. It allows us to pursue a historically-informed, value-conscious, full-cycle investment discipline, while fully embracing the likelihood of future episodes of zero interest rates and quantitative easing, and even the possibility of negative interest rates, helicopter money, and other extraordinary policies.”
Did it take too long for me to abandon my belief in a “limit” to the stupidity of Wall Street? Yes it did. That’s my fault, and I detail that often, because it’s not too late to realize that the combination of valuations and market internals remains important. It may help to understand that my dissertation committee at Stanford was comprised of Thomas Sargent (Nobel Prize, rational expectations), Ronald McKinnon (international economics, financial repression), John Taylor (rational expectations, Taylor Rule), Joseph Stiglitz (Nobel Prize, information asymmetry) and Robert Hall (macroeconomics, chair of the NBER recession dating committee). That’s a pedigree that left me with deep respect for the rational treatment of evidence. So yes, it took too long to accept that the IQ of Wall Street hit zero the moment interest rates did.
That’s fine. We’ve adapted. As the Scottish golfer said as a gust blew his companion’s drive into the trees, “Well, laddie, now we’ve got to play the wind too.”
Keep this in mind. Just as overbought “limits” have become unreliable in the face of sustained speculation, oversold “limits” may prove equally unreliable in the face of sustained risk-aversion. The “Three considerations” and “Navigating turbulence” sections of my April 2020 market comment describe our likely response to changes in observable market conditions as they emerge over the completion of this cycle, and in future ones. Nearly every factor that’s likely to affect the course of the financial markets, including monetary policy, is likely to affect the markets through the filter of valuations and market internals. See my December 2018 comment for details on how the condition of market internals affects the response of the stock market to Federal Reserve easing or tightening.
Investors have a choice: 1) they can ignore the reason for my admitted error in the recent bull market, and use it as a reason to ignore the information available from valuations and market internals; or 2) they can understand the nature of my error, and how we’ve adapted in response, without ignoring essential measures that can allow them to pursue and informed investment discipline in the face of whatever extraordinary events we might encounter.
Recession and the misguided, illegal Federal Reserve response
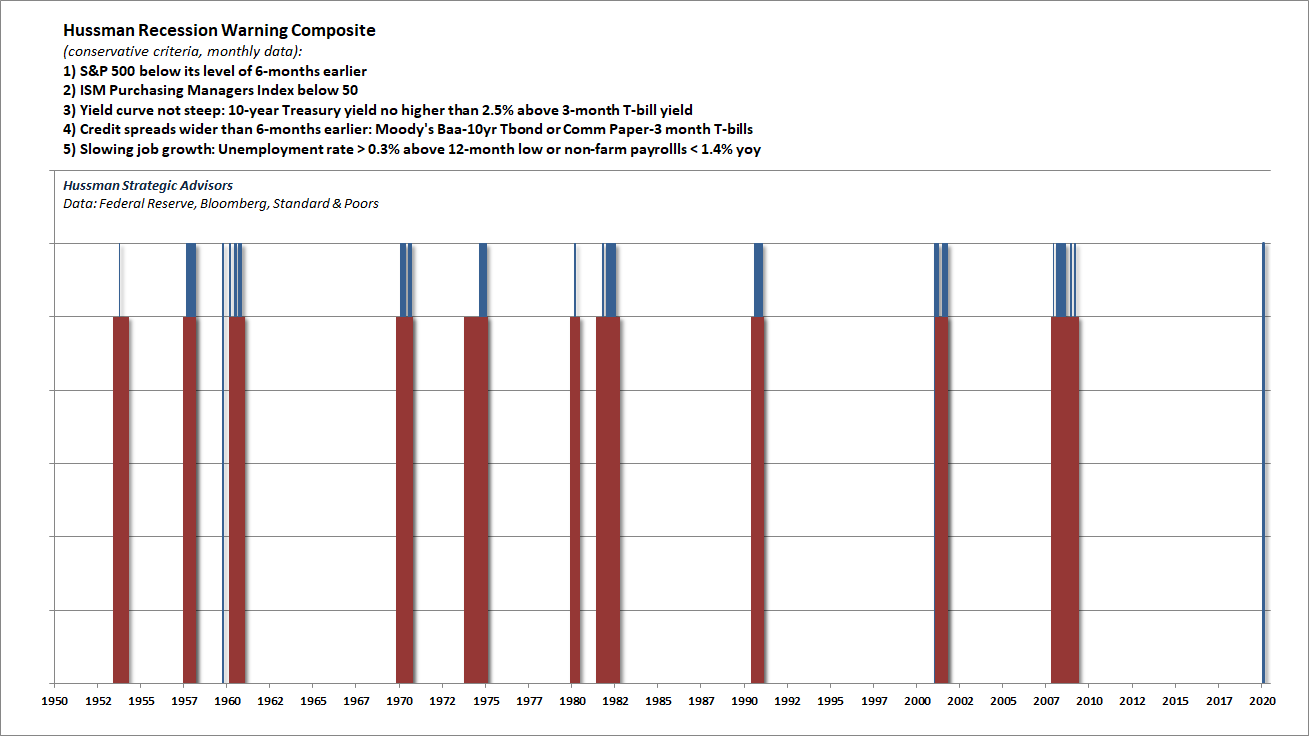
In 2000 and 2007, my projections of an oncoming recession were controversial. At present, the abrupt collapse in employment figures has made this point obvious, but it’s still worth noting – in March, even on the most conservative criteria, our Recession Warning Composite shifted to a recession outlook.
It’s clear that investors are already eager to “look over the valley” to an economic recovery. The problem is that post-recession bull markets typically begin at valuations about 40% of those we observe at present. Yes, I mean at levels on the S&P 500 that would be 60% below where we are today.
For those expecting a “V” bottom out of this, another observation may be useful. As I’ve noted in prior downturns, a recession is typically a period where the mix of goods and services that is demanded by the economy no longer properly matches the mix of goods and services that is supplied. It is unlikely that this precise mix will be wholly restored after we recover. This means that many of the dislocations that we presently observe are likely to persist longer than investors may imagine.
It’s clear that investors are already eager to “look over the valley” to an economic recovery. The problem is that post-recession bull markets typically begin at valuations about 40% of those we observe at present. Yes, I mean at levels on the S&P 500 that would be 60% below where we are today.
Containing this epidemic, and containing this economic downturn, both require a clear understanding of how the infection is transmitted, and how to blunt its impact. See, economies don’t collapse just because the prices of debt, or stocks, or other investment securities go down. Rather, economies are endangered when the “circular flow” of payments through the economy is stunted. The most effective intervention is to direct funds toward that entry point – where spending by ordinary Americans enters into the circular flow.
The closer we can get economic assistance to the very entry point of the circular flow – supporting individual basic incomes, contractual payments like rent and mortgage obligations of families, and fixed obligations of businesses experiencing actual economic damage – the closer these economic support policies will hit their mark.
What’s not needed, however, is the use of public money to bail out the losses of investors who hold already outstanding securities that have gone down in price.
Indeed, my impression is that investors have taken excessive hope from announced, planned interventions of the Federal Reserve that are illegal under the CARES act.
Let’s be clear about where the financial markets stand at this moment. The total return of the S&P 500 is down less than 15% from the highest valuation extreme in U.S. history. The total return of junk bonds now down just 8% from historic highs. Across a broad range of conventional “passive” asset classes, the U.S. financial markets are again priced at levels that are likely to produce near-zero returns for investors over the coming 10-12 year period.
We’re only down 15% from the all-time high of February 19, and it seems to me that the world is more than 15% screwed up.
– Howard Marks, April 20, 2020
Even at the market lows a few weeks ago, the S&P 500 was down just 34% from its highest level in history, and remained at valuations that were 2.3 times their historical norms. Junk bonds, at their worst, were down less than 23% from their highs, and the effective yield on the very junkiest of junk bonds had spiked to levels not seen in history since, well, since 2016.
Yet, the Federal Reserve views even these valuations as “dysfunctional,” and has announced a planned facility that would explicitly violate CARES 4003(c)(3)(B) requirements related to loan collateralization and taxpayer protection, in order to divert funds from supporting families and businesses to supporting secondary market purchases of securities from investors.
You think I’m exaggerating.
“We are going in and buying securities, backing securities, rather than letting the market do it. But I would submit the market wasn’t doing it. The markets were totally disrupted. They were dysfunctional. And so we needed to do these things to keep the markets, you know, going, and to keep them working. We are kind of making some of the market. But since those interventions, we have seen much more improved market functioning. In other words, it’s more like the pricing has come back to be more – to work.”
– Loretta Mester, President, Cleveland Federal Reserve, April 10, 2000
Notice the criterion that defines a functioning market: “pricing has come back to be more – to work.”
Pricing. As Ben Hunt of Epsilon Theory observed last week, “This is the Greenspan-Bernanke-Yellen legacy: a financialized political economy where the preservation of asset prices is our government’s primary objective.”
Thus far, the Fed’s purchases have focused on Treasury securities and mortgage backed debt explicitly guaranteed by the U.S. government. And that, frankly, is fine. And before discussing why leveraged, uncollateralized Federal Reserve purchases of junk debt and other corporate securities would actually be illegal under current law, it’s important to make a few things very clear.
First, it’s essential to have a powerful U.S. policy response, including substantial aid packages to the economy. It’s just that the funds used to purchase unsecured financial assets aren’t just monopoly money. Those dollars are grants of purchasing power, allowing the receiver to obtain real goods and services produced by the economy, and it is urgently important who those dollars benefit.
Now, if Congress chooses to support distressed companies by lending to them directly, or to support their restructuring, while suspending dividends and repurchases, excluding excess and stock-based compensation from public subsidy, and requiring repayment of public money by companies that still show a profit – have at it. These are reasonable policy responses, and they are urgently needed. What’s not needed is a public bailout of private investors in the secondary markets.
Even during the global financial crisis, it wasn’t Federal Reserve asset purchases that ended the collapse. The crisis actually ended, precisely, in March 2009, when the Financial Accounting Standards Board revised FAS157 mark-to-market accounting rules. With the stroke of a pen, that change suddenly gave banks discretion in how they valued their troubled assets, and eliminated their insolvency overnight (insolvency: assets < liabilities).
Why leveraged Federal Reserve purchases of unsecured secondary market securities are illegal
Both the Federal Reserve Act and the recent CARES Act places very clear restrictions on the types of assets that the Federal Reserve can purchase, and the conditions that must be satisfied in order to purchase them. Congress went so far as to include a section in CARES to emphasize these requirements “for the avoidance of doubt.”
Put simply, Fed purchases under the Federal Reserve Act are restricted to assets that are explicitly guaranteed as to interest and principal by the U.S. government, or that has a claim to sufficient collateral to avoid losses to the public.
The securities that the Federal Reserve is legally allowed to purchase are:
a) Section 14 open market purchases of securities that are fully guaranteed as to interest and principal by the U.S. government or a foreign government;
b) Section 14 purchases of “commercial bills of exchange” arising out of commercial transactions. What are those? See the definition in Section 13(2), which defines commercial bills of exchange exactly as they’re commonly understood: arising out of commercial transactions, secured by agricultural products, goods, or merchandise, with a maturity of less than 90 days, and specifically prohibited from “covering merely investments, or issued or drawn for the purpose of carrying or trading stocks, bonds, or other investment securities, except bonds and notes of the government of the United States.”
c) Section 13(2) discounting (i.e. prepayment) of commercial, agricultural, and industrial paper (again, bills of exchange);
d) Section 13(3) emergency lending to individuals, partnerships, and corporations, restricted to discounting notes, drafts and bills of exchange, and contingent on collateral (“security”). Section 13(3) also requires that these activities must be for “the purpose of providing liquidity to the financial system, and not to aid a failing financial company, and that the security for emergency loans is sufficient to protect taxpayers from losses.”
e) Section 13(4) and 13(6) lending for payment of sight drafts for agricultural transactions, and bankers acceptances which typically arise out of merchandise transactions.
That’s it. The menu is very specific: either government securities, or those that are backed by a pledge of collateral “sufficient to protect taxpayers from losses.” This principle is consistent with the U.S. Constitution: only Congress has fiscal authority. The Federal Reserve does not. If this is not taken seriously, the Fed could purchase whatever security it wished, at whatever valuation it might choose, and the American public would be on the hook for any losses.
On April 9, the Federal Reserve announced the creation of the “Secondary Market Corporate Credit Facility” (SMCCF), that would leverage $75 billion of CARES funding from the U.S. Treasury to buy as much as $750 billion of corporate debt and ETFs.
The initial allocation from the Treasury covers $50 billion for “primary” lending (directly to companies), and $25 billion for “secondary market purchases” of outstanding corporate bonds from investors. That Treasury funding is fine. Congress allocated the $75 billion in Treasury funds as part of the CARES Act. Every dollar provided by the Treasury acts as a Federal guarantee for the equivalent amount of corporate obligations that the Federal Reserve purchases.
The problem is that the Fed intends to leverage these funds 10-to-1 without taking actual collateral pledges from the underlying companies. This exposes the public to outright losses in the event that declining market prices or corporate defaults reduce the value of these bonds by even 10%.
As a result, the newly created SMCCF is either a Ponzi scheme at public expense (if the Fed plans to allow portfolio losses to exceed 10%) or a 1987-style portfolio insurance scheme (if the Fed plans to liquidate securities into a falling market in order to cap its losses at 10%). Section 13(3) requires updates every 30 days on the “value of collateral” – that’s going to be an interesting dance if we break the March lows. In any event, even here, the SMCCF is already illegal.
Uncollateralized junk bonds are being treated as their own collateral.
What makes this so brazen is that when Congress approved the CARES Act, it wrote the terms and conditions section like a children’s book, “for the avoidance of doubt” – to prevent exactly this sort of abuse of public funds. Specifically, here is section 4003(c)(3)(B), which limits how the $500 billion of 4003(b)(4) funding provided for businesses, states, and municipalities may be used:
4003(c)(3)(B) FEDERAL RESERVE ACT TAXPAYER PROTECTIONS AND OTHER REQUIREMENTS APPLY. – For the avoidance of doubt, any applicable requirements under section 13(3) of the Federal Reserve Act, including requirements relating to loan collateralization, taxpayer protection, and borrower solvency, shall apply with respect to any program or facility described in subsection (b)(4).
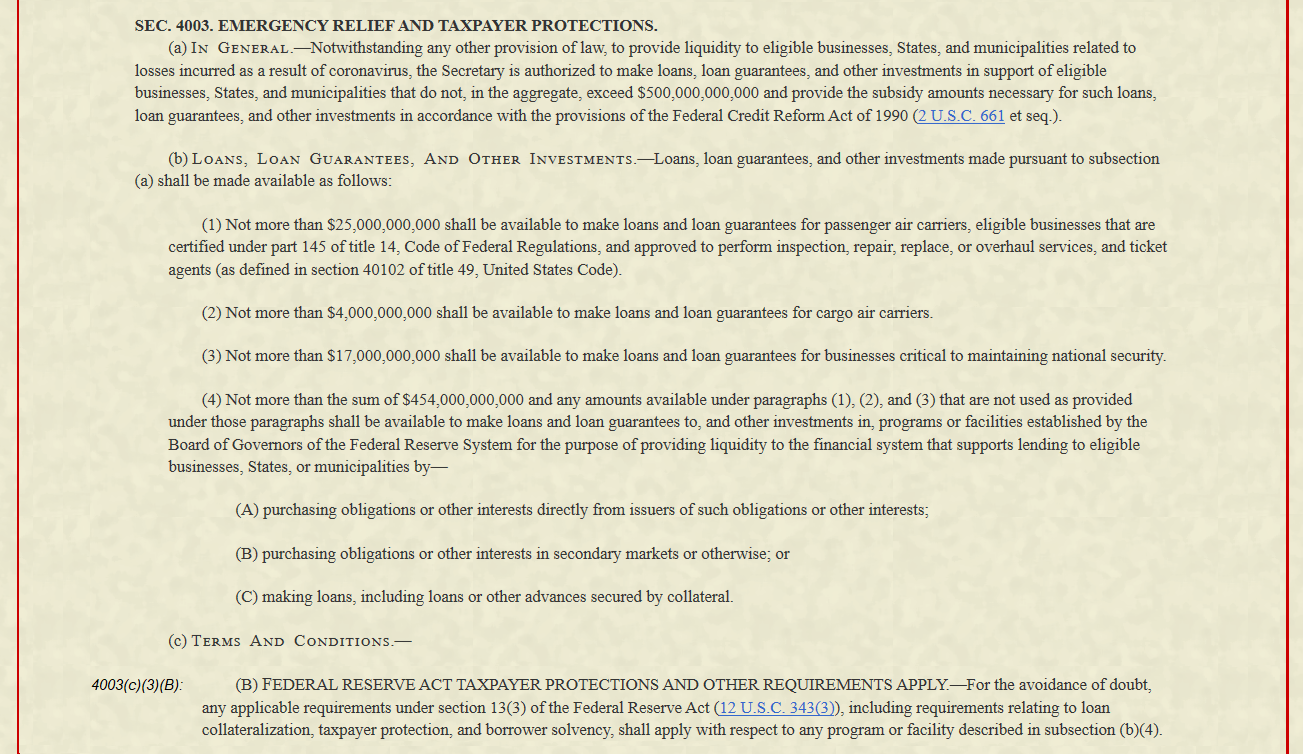
Has the Federal Reserve announced that it will take collateral pledges from the companies underlying these “loans”? Has the Federal Reserve ensured that “the security for emergency loans is sufficient to protect taxpayers from losses”? Nope.
Instead, what’s going on here is that the Fed is treating the SMCCF as if it is a “business” in itself. It is then treating the corporate bonds and ETFs purchased by that vehicle as if those unsecured bonds are the “collateral.”
Yes, that’s right. Uncollateralized junk bonds are being treated as their own collateral.
Of course, that’s also why Section 13(2) of the Federal Reserve Act was written to prevent this sort of thing, prohibiting discounting of corporate securities “covering merely investments, or issued or drawn for the purpose of carrying or trading stocks, bonds, or other investment securities, except bonds and notes of the government of the United States.”
The whole operation is a hand-waving attempt to the purchase of assets that are wholly rejected by the provisions of 13(3), and may ultimately be impossible to close without a loss to the Fed, which is a loss to the public, which is fiscal policy, which belongs to Congress, not the Fed.
Again, it’s fine for the Federal Reserve to use the $75 billion of Treasury funding as “collateral“ that confers a federal guarantee on $75 billion of corporate loans and security purchases. Those funds are part of the amount that Congress, in its singular constitutional role, has allocated for public support for corporate lending.
In contrast, additional purchases to “leverage” that funding are neither secured by non-financial collateral, nor have security sufficient to protect taxpayers from losses. They are illegal, both under Section 13(3) of the Federal Reserve Act, and under Section 4003(c)(3)(B) of the CARES act, which “for the avoidance of doubt” specifically invokes 13(3) “requirements relating to loan collateralization, taxpayer protection, and borrower solvency.”
The newly created SMCCF is either a Ponzi scheme at public expense (if the Fed plans to allow potential portfolio losses to exceed 10%) or a 1987-style portfolio insurance scheme (if the Fed plans to liquidate securities into a falling market in order to cap its losses at 10%).
Essentially, the Federal Reserve has announced a plan to make leveraged purchases of uncollateralized corporate debt, at public risk, in explicit violation of Section 13(3) of the Federal Reserve Act and Section 4003(c)(3)(b) of the CARES act. The moment the Fed acts on that plan, somebody had better lawyer up.
Helping American families, workers, and businesses: the way forward
It’s worth repeating that economies don’t collapse just because the prices of debt, or stocks, or other investment securities go down. Rather, economies are endangered when the “circular flow” of payments through the economy is stunted. The most effective intervention is to direct funds toward that entry point – where spending by ordinary Americans enters into the circular flow.
The closer we can get Federal rescue funds to the very entry point of the circular flow – supporting individual basic incomes, contractual payments like rent and mortgage obligations of families, and fixed obligations of businesses experiencing actual economic damage – the closer these economic support policies will hit their mark.
In contrast, Treasury and Federal Reserve are choosing to use much of this federal support as monopoly money – doing everything to support existing security holders, with little but indirect trickle-down effects to support families or even businesses.
As former FDIC chair Sheila Bair recently argued, “They’re throwing money in the wrong place. We need to get help out there, especially to small businesses and people already losing their jobs.”
Worse, rather than supporting the immediate and essential part of the “circular flow” – current spending, current interest obligations, and current cash flows – using public funds to buy securities wastefully takes on years, and even decades, of future cash flows, along with their price risk.
Buying corporate debt from investors in the secondary market is a ridiculous strategy that puts the public in first-loss position behind even the most subordinate bondholder. Worse, the Federal Reserve is diverting public funds toward this strategy within a stone’s throw of the most extreme valuations in the history of the U.S. financial markets.
The closer we can get Federal rescue funds to the very entry point of the circular flow – supporting individual basic incomes, contractual payments like rent and mortgage obligations of families, and fixed obligations of businesses experiencing actual economic damage – the closer these economic support policies will hit their mark.
Let’s also be clear about this. The right to choose actions with fiscal effect is reserved to the American public, acting through Congress. The Fed, as a banking arm, is restricted to purchases of assets that have been thereby secured. Unsecured corporate junk debt is not its own collateral.
Some have argued that Fed buying somehow reduces the risk of bankruptcy for these companies. This is incorrect. If the Fed simply buys securities on the secondary market, nothing ensures that the proceeds of the Fed buying will be used by those investors to benefit those businesses, U.S. economy, American workers, or any of the targets that Congress intends. It might help investor psychology by propping up the market, but the public is entirely on the hook for that prop.
First principles
From my standpoint, several principles are useful in thinking about policies that would best support families and businesses in the face of the current crisis.
1) Equal treatment – I’m not exactly sure how equity is served by paying employees up to $99,000 if they are kept on the payroll, whether they are working or not, but paying far less if they are on unemployment. In my view, this is a high-income subsidy. My impression is that it’s best to standardize these levels more uniformly (possibly as a minimum basic income plus some fraction of prior income in excess of that minimum). There should also be a cap on the amount of the income subsidy. Josh Hawley (R, MO) proposes using the median U.S. income as a cap.
2) Economic damage – Beyond income support to individuals, the most pressing obligations of businesses include mortgage/lease obligations, net interest obligations, utilities, and other fixed expense. Forgiveness of loans on this basis should be available to companies that experience an actual loss, adding back any extraordinary salaries. So at the end of the year, for example, you take the actual P&L, add back whatever amounts were paid to employees above the “standardized” compensation (above), and you forgive the loan only to the extent that the business experienced actual economic damage. Emphatically, if a company has a profit, or its executives are drawing salaries above the capped income subsidy that’s available to other Americans, the public shouldn’t be paying toward it.
3) Prohibition of using public money to bail out private securities losses. This is really where Federal Reserve activity can be insidious, because if it’s allowed to buy private securities like stocks and bonds, private investors are simply being bailed out at public expense. Not only is that wildly inefficient from an economic standpoint (it does nothing to ensure that the funds have broad economic benefit for workers or productive activity), but it’s also wildly inequitable, since the holders of these securities are highly concentrated among wealthy Americans.
4) Use of existing structures rather than novel ones, wherever possible. It’s not clear to me that a broad expansion of unemployment insurance, albeit with different formulas isn’t superior to novel programs like paycheck protection and other programs with far less certain implications for equity or abuse (again, as far as formulas go, I’m inclined toward minimum basic income plus some modest fraction of prior income in excess that minimum). The IRS could also administer support through existing SSN (individuals) and EIN (businesses) registrations, and would be most capable of applying criteria related to loan forgiveness or recovery.
Support for specific companies
Beyond general and broadly available support to individuals and businesses, there will also be situations where public money may be directed for loans to specific companies. On that front, a few observations may also be useful.
First, if the public lends directly to private companies, it should be getting senior secured, or senior unsecured bonds. The difference between those two is that senior unsecured is privileged but isn’t tied to specific collateral. In recent years, most corporate debt has actually been issued as “covenant lite” bonds that provide minimal recovery in the event of bankruptcy. These loans should use funds specifically designated by Congress, and not “leveraged” by the Federal Reserve.
In some cases, issuing new bonds is not possible. In this case, provided that the company is expected to become solvent after the crisis, it may be useful to take cumulative preferred stock – at a yield that’s sufficiently high to discourage abuse and encourage early repayment. During the 2007-2009 global financial crisis, for example, banks became insolvent and required capital. But they couldn’t issue bonds to get it because they would still be technically insolvent. That’s why – in the case of banks – Warren Buffett opted for cumulative preferred equity from Goldman Sachs at 10% (plus stock options).
Keep in mind that recovery rates drop as default probability increases. In the event of default, even senior secured debt typically enjoys recovery of less than 60%, dropping sharply for unsecured debt, and next to nothing for preferred stock. In addition, the higher the probability of default, the lower the recovery tends to be, which means that recovery in a crisis can fall substantially short of estimates.
If there is no reasonable prospect for loan repayment, the proper response of government is to support restructuring in the least disruptive way.
Remember Washington Mutual, the largest bank failure in U.S. history? The chaos it caused?
No. No you don’t.
Properly done, corporate bankruptcies, and even bank failures, simply wipe out stockholders and subordinated bondholders. The company doesn’t fire its employees. Depositors don’t lose a cent. The products of the company continue to be produced. What happens is that the bankrupt entity, relieved of part of its subordinated balance sheet obligations, is sold to an acquirer or recapitalized, and then everything moves on. Corporate failures are mostly packaged restructurings.
When company fails it does not generally fire its employees. It goes through a packaged bankruptcy. The people who get wiped out are those that own unsecured debt and equity, and by the way, those are the rules of the game.
– Chamath Palihapitiya
The fact is that the main beneficiaries of “bailouts” during an economic crisis are corporate bondholders. Indeed, the global financial crisis could have been resolved primarily through orderly bank restructuring, as the FDIC did with Washington Mutual, but it turned into a Wall Street bailout because Geithner, Paulson, and the Federal Reserve were unwilling to allow the bondholders of banks and Wall Street investment companies to lose money.
“Why did we do the bailouts? It was all about the bondholders. They did not want to impose losses on bondholders. They’re supposed to take losses.
– Sheila Bair, FDIC Chair, 2006-2011
Amid the current crisis, a forceful economic policy response is essential. The central principle here is that the closer we can get economic support to the point where current spending enters the “circular flow” – basic incomes, net rent and lease obligations, utilities, contractual payments, even net interest payments, the better we can support the entire economy. The other principle is to create a level playing field, ensuring that the access to support doesn’t depend on who someone knows, that the support is the same whether it comes through payroll protection or unemployment, and that public funds are linked to actual economic damage and the loss of basic income (rather than subsidizing extraordinary income, profit, or investment losses).
We’ll get through this.
Keep Me Informed
Please enter your email address to be notified of new content, including market commentary and special updates.
Thank you for your interest in the Hussman Funds.
100% Spam-free. No list sharing. No solicitations. Opt-out anytime with one click.
By submitting this form, you consent to receive news and commentary, at no cost, from Hussman Strategic Advisors, News & Commentary, Cincinnati OH, 45246. https://www.hussmanfunds.com. You can revoke your consent to receive emails at any time by clicking the unsubscribe link at the bottom of every email. Emails are serviced by Constant Contact.
The foregoing comments represent the general investment analysis and economic views of the Advisor, and are provided solely for the purpose of information, instruction and discourse.
Prospectuses for the Hussman Strategic Growth Fund, the Hussman Strategic Total Return Fund, the Hussman Strategic International Fund, and the Hussman Strategic Allocation Fund, as well as Fund reports and other information, are available by clicking “The Funds” menu button from any page of this website.
Estimates of prospective return and risk for equities, bonds, and other financial markets are forward-looking statements based the analysis and reasonable beliefs of Hussman Strategic Advisors. They are not a guarantee of future performance, and are not indicative of the prospective returns of any of the Hussman Funds. Actual returns may differ substantially from the estimates provided. Estimates of prospective long-term returns for the S&P 500 reflect our standard valuation methodology, focusing on the relationship between current market prices and earnings, dividends and other fundamentals, adjusted for variability over the economic cycle.

