

Herd Mentality


John P. Hussman, Ph.D.
President, Hussman Investment Trust
October 2020
That the rate of interest will be lower when commerce languishes and when there is little demand for money, than when the energies of commerce are in full play and there is an active demand for money, is indisputable; but it is equally beyond doubt, that every speculative mania which has run its course of folly and disaster in this country has derived its original impulse from cheap money.
– The Economist, 1858 (h/t Jamie Catherwood)
1858. That 162 year old quote might as well have been written yesterday.
There is a particular lesson that history regularly teaches, yet the public never actually learns. The lesson is simple. When a) the government – or since 1913 the Federal Reserve – insists on making money cheap by aggressively suppressing interest rates, and b) provided that investors are inclined to speculate – an essential condition that we’ll get to shortly – the combination invariably produces an episode of “irrational exuberance,” often with a subsequent collapse that exerts economic damage far exceeding whatever benefits the depressed interest rates were intended to produce.
Specifically, provided that investors are not so risk-averse that they view low-interest liquidity as a preferred asset in itself, depressed interest rates encourage them to chase competing yields by bidding up the prices of speculative assets that they believe will offer them a “pickup” in returns. Once yield-starved investors surrender to the herd mentality, in the belief that depressed interest rates offer “no alternative,” the entire structure of the financial markets shifts away from productive allocation of capital toward yield-seeking speculation.
So investment banks and hedge funds become inclined to borrow money to speculate in “carry trades” that exploit small – but emphatically not riskless – differences in yield between different securities. Inefficient projects that would never survive the hurdle of normal interest rates suddenly become viable, particularly activities involving leveraged buyouts, speculative real-estate, and debt-financed stock buybacks, where interest is the primary cost of doing business. Wall Street becomes eager to pump out low-grade debt and sketchy new issues to satisfy the rabid demand of investors, who only seek relief from the yield-starvation intentionally engineered by the Fed.
Ultimately, the speculation drives prices high enough, relative to likely future cash flows, to virtually ensure zero or negative long-term returns on even those assets. But here’s the irony: everybody is happy. All anybody cares about is the ink on a piece of paper, or the pixels on a screen, that tell them that they own something of worth. Never mind that if they hold those assets over the long-term, they will earn nothing more. Never mind that in order to sell those assets, they will require someone else to step up to hold the bag. Never mind that if enough people attempt to sell without those greater fools absorbing the supply at nearby prices, a great deal of that paper wealth will vanish into thin air.
And when that collapse comes, as we observed most recently in 2008-2009, the other irony is this: everyone will look to the government and the Federal Reserve to save them: by making money cheap.
Negative yield? You’re soaking in it!
Even for those who learn this lesson, it turns out that applying it is far more challenging than one might expect. Between 2012 and 2017, the Federal Reserve made that situation nearly excruciating, making attention to part b) of the above lesson absolutely critical: “provided that investors are inclined to speculate” – or equivalently – “provided that investors are not so risk-averse that they view low-interest liquidity as a preferred asset in itself.” Easy money doesn’t reliably support stocks when investors are inclined toward risk-aversion. But when they view low-interest cash as an “inferior” asset, look out. Once interest rates hit zero, so does the IQ of Wall Street.
Suppose investors are willing to pay $80 today for an expected $100 payment a decade from now. It’s easy enough to calculate that they can expect an average return of just over 2% annually over the coming 10 years. If an investment of similar risk has historically been priced to offer much higher annual returns, one might be tempted to think that the security is overvalued, and that the price will somehow “fall by its own weight.” But if investors are inclined to speculate, and the Fed insists on pouring fuel on the fire, investors may very well drive the price all the way to $100. At that point, sure, the return on that security over the coming decade will be zero. But the short-term outcome, in the rear-view mirror, is that the security will have gained an additional 25%, and speculators will be doing nothing but patting themselves on the back about it.
Worse, speculators might even become willing to pay $110 for the security, in which case passive buy-and-hold investors will be facing average annual returns of -1% annually. Yet at that same moment, they’ll be even more exuberant about it than when their long-term return prospects were zero.
My hope is that it’s clear how all of this works. See, while Wall Street seems excited about the possibility that the Federal Reserve may eventually drive rates to negative levels, passive investors should recognize that the Fed has already engineered negative rates – for the first time in U.S. history, including the 1929 top.
Unfortunately, it’s in their portfolio, and they don’t realize it.
The chart below shows our estimate of average annual 12-year nominal total returns for a conventional, passive asset mix invested 60% in the S&P 500, 30% in Treasury bonds, and 10% in Treasury bills. The red line shows the actual 12-year total return on that portfolio (and of course, ends 12 years ago because we don’t have the data yet for more recent periods).
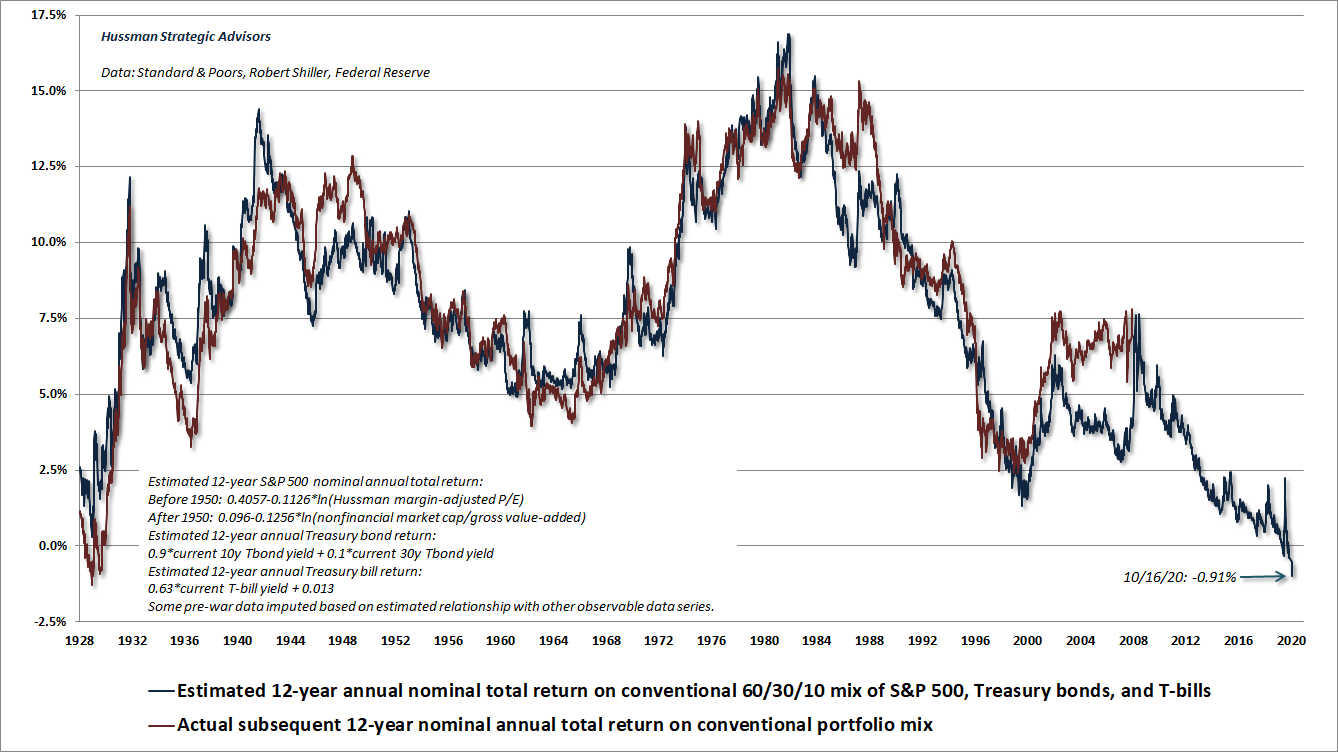
I should add that the current estimate does not reflect the transient plunge in second quarter economic activity, because I strongly believe that valuation measures should reflect representative fundamentals, not “outliers” in the data. Even based on corporate fundamentals that were in place at the February peak, 2020 is the first time in history that our estimate of prospective 12-year returns has been negative for this portfolio mix. But ask any investor, and you’ll find that, to a person, they’re all super-excited about it. That’s because they see the ink on the paper and the pixels on the computer screen, and they don’t give a moment’s thought to the prices that they’re paying in relation to the future cash flows they will receive. Put another way, they don’t care about value, they care about price.
No forecasts required
The one aspect of the recent bull market that was truly “different” from history was this: once the Federal Reserve drove interest rates to zero, even the most extreme and historically reliable “limits” to speculation became ineffective. In late-2017, I finally threw up my hands and abandoned the idea that there was any reliable “limit” to speculation at all. Instead of acting pre-emptively in response to extremely overextended conditions, we adapted our investment discipline to require deterioration in our measures of market internals before adopting a bearish outlook. Across history, we’ve found that the best gauge of investor risk-aversion is ragged or divergent behavior across a broad range of securities (when investors are inclined to speculate, they tend to be indiscriminate about it). While sufficiently extreme conditions can still justify a neutral market outlook, we no longer adopt or amplify a bearish outlook unless our measures of market internals are explicitly unfavorable.
Now, saying that the Fed has disabled previously reliable limits to speculation doesn’t mean embracing risk regardless of observable market conditions. Rather, I expect that the most valuable aspect of our investment discipline over the completion of this cycle, and future ones, will be our ability and willingness to flexibly respond to changes in observable market conditions – particularly valuations and market internals – as they emerge.
As I’ve noted for decades, I do believe that it’s possible to measure the presence or absence of speculative investor psychology, which is best inferred from market internals. Moreover, even the adaptations we made in our investment discipline in late-2017 recognize that some conditions are sufficiently overextended to encourage a neutral view, even when internals are constructive. But whatever reliable “limits” there were to speculation in market cycles prior to the recent one, those limits have been abrogated by an activist Federal Reserve. If the yield-starved herd is willing to pay $110 today in order to get $100 a decade from now, and they’ve got the speculative bit in their teeth, nothing stops them from paying $120. It may not be wise to speculate on it, but one can’t stand in front of it either.
So we have to distinguish between what we expect over the long-term and the complete market cycle, and what we can expect over shorter segments of the market cycle. I continue to expect the market to lose about two-thirds of its value over the completion of its cycle. At current overextended extremes, even somewhat improved market internals (which we’ve observed over the past few weeks) hold us to a fairly neutral outlook. A shift to unfavorable internals would immediately restore a “trap door” scenario. A material retreat in valuations coupled with an improvement in market internals would encourage a strongly favorable outlook. In every case, we’ll respond to the evidence in hand.
While Wall Street seems excited about the possibility that the Federal Reserve may eventually drive rates to negative levels, passive investors should recognize that the Fed has already engineered negative rates – for the first time in U.S. history, including the 1929 top. Unfortunately, it’s in their portfolio, and they don’t realize it.
We might wish this situation was different; that the dogmatic interventionists at the Fed might recognize the road to financial implosion that they’ve placed the economy on once again. We might even hope that someone at the Fed will learn a lesson when it all goes to smoke in a blazing dumpster fire. Don’t hold your breath.
Still, we’ve become content to navigate the market cycle by focusing on prevailing valuations, market internals, and other conditions, without expecting or requiring an enlightened Federal Reserve. Valuations are enormously informative about long-term returns as well as prospective market losses over the completion of a given cycle. Market internals are informative about the presence or absence of speculative pressures. What we abandoned in late-2017 is the assumption that speculation has a limit, but that certainly doesn’t mean that we expect speculative psychology to persist indefinitely. Rather, it means that we can be content to identify rather than forecast. That sort of discipline certainly allows us to adopt a neutral view in an overextended market, but it also requires us to refrain from adopting an outright bearish outlook except when we identify a shift toward risk-averse investor psychology.
Even optimistic assumptions imply poor long-term returns for passive investors
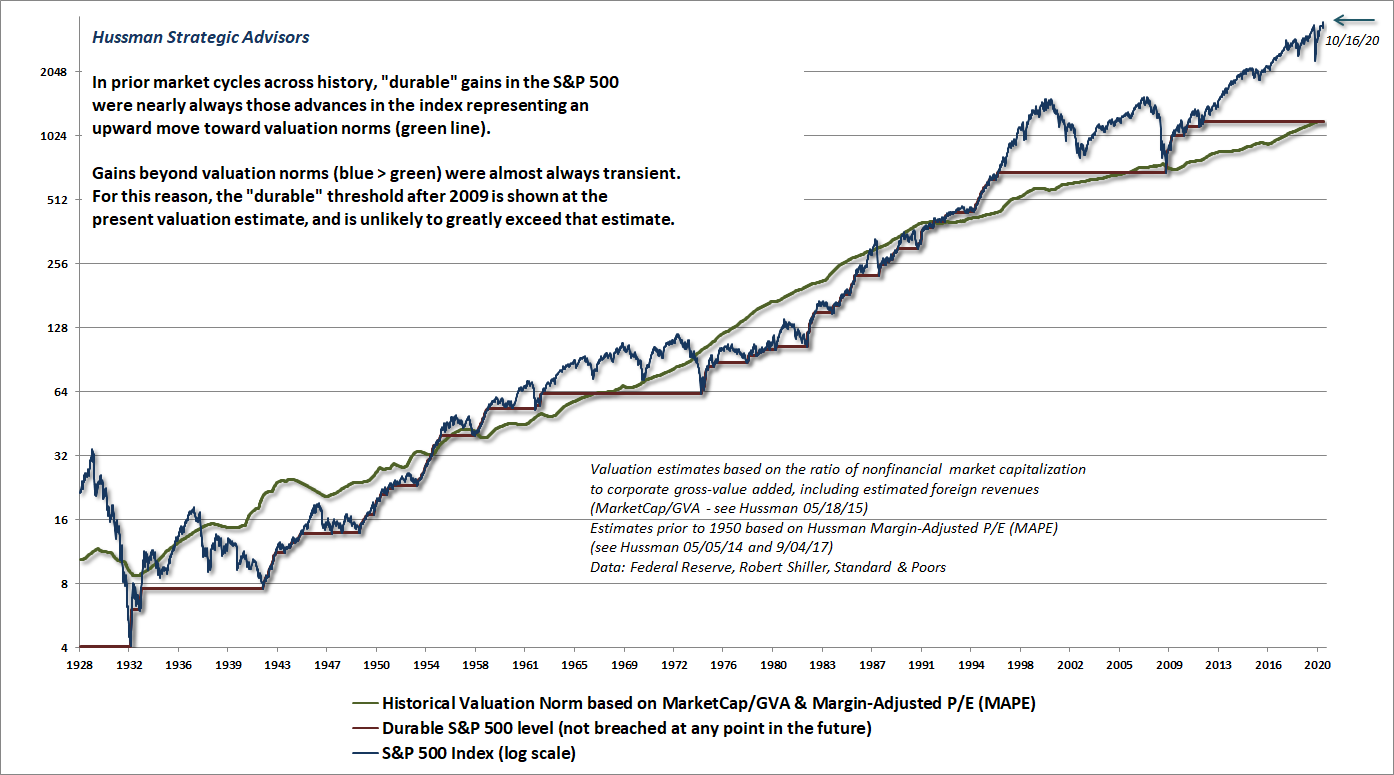
The chart below is a reminder of where the S&P 500 stands relative to levels that we would consider “durable.” The blue line shows the S&P 500, the green line shows our best estimate of historical valuation norms at each point in time, and the red line shows “durable” levels in the S&P 500 that were never again breached in later cycles. Notice in particular that market advances toward valuation norms (that is, blue line below green line) tend to be durable. In contrast, market advances far beyond valuation norms (blue line above green line) tend to be transient, and are often wiped out over the completion of the market cycle, or even the following market cycle, as was the case in 2009.
Want my opinion? My opinion is that at some point over the completion of the current cycle, or even the following one, we’ll see the S&P 500 trade below the 1200 level. Nothing in our discipline requires that, and we’re content to navigate the conditions that the market provides us. But my view is that investors should not rule out that possibility, which doesn’t even contemplate a decline below historical norms that were breached as recently as 2009. Believe what you wish about the Fed’s ability to keep stock prices elevated forever. I expect that we’ll do just fine if that’s the case. I just think it’s a terrible idea to rely on the idea of a “permanently high plateau.”
But what if valuations literally never ever visit historical norms again? Fine, let’s examine that possibility. Suppose we assume that market valuations maintain the “permanently high plateau” that Irving Fisher famously projected at the 1929 market peak. What then?
Well, let’s do the arithmetic. We know that real “structural” GDP growth over the past decade has averaged only about 1.6% annually. That’s the rate at which real GDP has grown in recent years, excluding the impact of changes in the rate of unemployment. It’s essentially the underlying economic growth that’s driven by the sum of demographic labor force growth and trend productivity growth (output = workers x output/worker). Even a 3% structural growth rate would require a near-doubling of trend productivity. Let’s be optimistic and bump expected structural growth up to 2%. Adding 2% inflation then gives us 4% nominal growth.
It’s worth noting that at the very peak of the recent economic expansion, the actual nominal growth rate of S&P 500 revenues over the recent 20 years had averaged just 3.6% annually, which reflects the full benefit of stock buybacks and share reductions over that period. Likewise, the growth rate of U.S. nominal GDP averaged just 4% in the 20 years measured up to the peak of the recent expansion.
Now, suppose we also assume that the profit margins observed at the peak of the recent economic expansion will never, ever normalize. We can then expect earnings to match the growth rate of revenues, and we’ll assume that dividends do the same, leaving us with expected long-term growth of 4% all around.
Finally, let’s assume that market valuations never, ever retreat. In that case, prices would grow at the same rate as fundamentals, which gives us 4% annual capital gains for a passive investment in the S&P 500. Add the current S&P 500 dividend yield of 1.6% (which would also remain constant forever), and if all of these assumptions were to work out for investors, they would imply long-term investment returns for the S&P 500 of 5.6% annually. Emphatically, that figure relies on the S&P 500 maintaining the most extreme valuations in U.S. financial history forever.
Given a 10-year Treasury bond yield of 0.72%, and a T-bill yield of 0.10%, a conventional portfolio mix invested 60% in the S&P 500, 30% in Treasury bonds, and 10% in Treasury bills would then have an estimated 10-year nominal total return of just 3.59%. That’s basically your optimistic case given current valuation extremes, assuming that they are sustained forever.
But what if inflation runs far beyond 2%? Won’t that boost nominal stock market returns? The answer is yes, in a hyperinflation. But don’t expect inflation in the 2-25% range to benefit stocks. Historically, the first casualty of rising inflation has been collapsing valuations. It’s only once valuations collapse to levels near or below historical norms that the positive effect of inflation on nominal growth outweighs the negative impact of inflation on valuations. We’d need the CPI to nearly triple for that occur. That’s 5 years of 25% inflation before that bet starts paying off.
The fact is that the S&P 500 has lagged Treasury bills, on average, when inflation has been anywhere above 2% and rising, with worse returns the higher the rate of inflation has been. Examine the data. After stock valuations get hammered and nominal S&P 500 total returns lag T-bills – as they did during the inflationary period between 1968-1982 – U.S. stocks earn their long-term reputation as “inflation hedges” by recovering the lost ground as inflation retreats – as we observed between 1982-2000.
Extreme valuations mean extreme sensitivity
The other problem is this. Prior to the bubble period of recent decades, the average dividend yield of the S&P 500 was close to 4%. During much of the post-war period, the combination of robust labor force growth, high productivity, and moderate inflation generated growth of more than 6% annually in nominal fundamentals. Add a 4% dividend yield to 6% nominal growth, and there’s the average 10% nominal return that investors associate with historical returns for the S&P 500, and imagine is still a relevant figure despite current valuation extremes.
In a world where the S&P 500 yields 4%, pushing long-term expected returns up by 0.5% requires a loss of (.04/.045-1=) just -11% in stock prices. But see, in today’s world where the S&P 500 yields 1.6%, pushing long-term expected returns up by that same 0.5% requires a loss of (.016/.021-1=) about -24%.
So it’s not enough to assume that extreme valuations will be sustained over the long-term. One also has to assume that there will be virtually no change at all in expected returns. That’s because even slight increases in expected returns from these valuations are likely to drive steep drawdowns in stock prices.
The argument goes the other way too. Sure, our estimates of 10-12 year S&P 500 total returns are already solidly negative, and are already beyond the worst extremes observed at the 1929 and 2000 market peaks. But if one believes that long-term investment returns will be driven to even more negative levels (and assuming that the trajectory of long-term cash flows remains constant), it follows that one believes that prices will advance to even greater speculative extremes.
Frankly, that’s not something that we can rule out, because it’s entirely dependent on investor psychology. We can certainly adopt a neutral market outlook when conditions are particularly extreme, but as I’ve noted regularly since 2017, we’ve abandoned our reliance on “limits” to speculation that were useful in prior market cycles across history. When internals indicate that investors have the speculative bit in their teeth, we refrain from adopting or amplifying a bearish market outlook. It’s clear that this adaptation was of benefit in 2018 and thus far in 2020.
As for 2019, it may be helpful to recognize that the main challenge for disciplined, value-conscious hedged-equity strategies that year was not the “hedged” part but the “equity” part. As I observed in One Tier and Rubble Down Below, the behavior of individual stocks in 2019 featured a breathtakingly narrow but temporary focus on large-capitalization glamour stocks, particularly relative to the broad, value-conscious discipline that drives our stock selection. Though broad market participation remains rather tepid, the imbalance has been much less extreme in recent quarters, and better reflects what we’ve observed over the longer term.
More importantly, as I’ve detailed in other market comments, the dispersion in valuations between large-cap glamour stocks and the broad market has rarely been wider. That’s no assurance that the gap will close over the short-term, but it does create what I view as an unusually interesting setup for value-conscious hedged equity approaches.
See, the nice thing about discounted cash flows is that over the long-term, the expected returns implied by valuations tend to be reflected in the portfolios of investors (which I typically illustrate using valuation measures like MarketCap/GDP, Price/Revenue, MarketCap/GVA and MAPE). That’s particularly true as discounted cash flows actually materialize. If you pay $110 today in return for $100 a decade from now, there’s nothing that prevents the price from going to $120 over the short run, but assuming the $100 cash flow is actually delivered, your investment is still going to be worth $100 a decade from now, and you’ll still have realized a negative return. Likewise, if you buy that $100 future cash flow for $60 today, there’s nothing that prevents the price from falling to $50 in the short run, but a decade from now, the cash flow is still what matters.
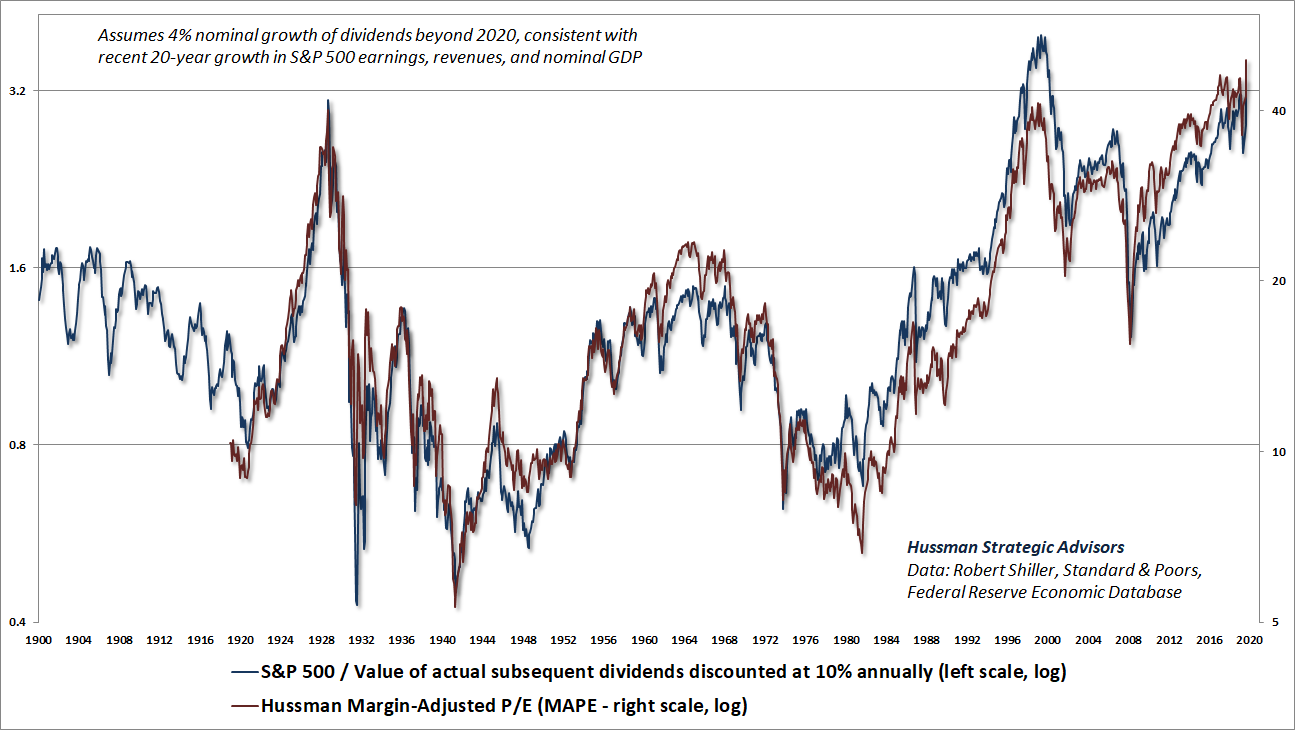
Remember, a good valuation measure is nothing but shorthand for a proper discounted cash flow analysis. Investors should understand that to the extent that reliable valuation measures are wildly above their historical norms, future stock market returns are also likely to be wildly below their historical norms. The blue line in the chart below shows the ratio of the S&P 500 across history to the value of actual subsequent S&P 500 dividends, discounted at a 10% long-term rate of return. The red line is our Margin-Adjusted P/E. It should not be a surprise that these two measures move hand-in-hand.
Show me a plunge in the S&P 500 Index to the 1100-1200 area, and I’ll show you long-term estimated S&P 500 total returns of about 10% annually. But investors are likely to be extremely disappointed if they imagine that their future investment returns will somehow be anywhere close to that level, given current valuation extremes.
Again, I expect that the most valuable aspect of our investment discipline over the completion of this market cycle, and future ones, will be our ability and willingness to flexibly respond to changes in observable market conditions – particularly valuations and market internals – as they emerge.
Present conditions
In recent months, S&P 500 valuations have pushed even beyond the extremes that we observed in February of this year, as well as those that marked the bubble extremes of 1929 and 2000. Interestingly, neither the equal-weighted S&P 500 Index, the Dow Jones Industrials, the Russell 2000, the NYSE Composite, nor the Value Line Composite have recovered their February 2020 peaks, underscoring the relatively narrow focus of investors on the largest capitalization glamour stocks.
Our broad measures of internal uniformity reflect the behavior of thousands of individual stocks, industries, sectors, and security types (including debt securities of varying creditworthiness). We’ve seen periods in recent months that we’ve classified as favorable from the standpoint of market internals, but typically coupled with sufficiently overextended conditions to hold us to a neutral or only modestly constructive investment outlook – always with a safety net that allows for extreme “tail risk” to the downside. A shift to more constructive market action in recent weeks encouraged us again to adopt a rather neutral near-term outlook, despite profound full-cycle concerns. Still, as I wrote about a similar shift back in June:
“Given the likely level of market volatility relative to the volatility currently reflected in index option prices, my inclination is to adopt an investment stance that is fairly neutral in response to ‘local’ market movements, keeps a strong safety net, but for now, refrains from a bearish response in the event of a further advance. In the context of extreme valuations, economic headwinds, and overbought extremes, the shift in market internals here is not a ‘buy signal’ or even a constructive ‘opportunity.’ It’s more like the cast of Jackass showing up on your driveway with skateboards and dynamite. You don’t need to join them, and you expect that it will end badly, but since you don’t know what they’ve got in mind, or how long they’ll hang around, it’s best not to stand directly in front of them.”
In short, despite breathtaking market valuations, our measures of internals have encouraged us to adopt a rather neutral, and occasionally “locally” constructive outlook, in recent weeks. By “locally,” I mean that strong safety nets remain essential due to profound full-cycle risks. The increased flexibility of our near-term outlook, even amid extreme conditions, has been part of our discipline since our late-2017 adaptations.
Even the near-term outlook is clouded by the failure of many broad indices to confirm the recent strength in the S&P 500, along with the extreme overextension we observe short-term market action and bullish sentiment. I continue to believe that the S&P 500 is likely to lose something on the order of two-thirds of its value over the completion of this market cycle, which I don’t believe will be postponed indefinitely. Still, we’re content to change our market outlook as the evidence changes.
This is not a market that encourages substantial risk-taking. We certainly haven’t abandoned our safety nets, but we’re also being cautious to restrict hard-negative outlooks to periods when our measures of market internals have deteriorated. On that front, pay particularly close attention to divergent behavior in the broader market (weak participation, expanding new lows, and muted advancing issues despite strength in the indices) as well as in the credit markets (particularly spreads between Treasury yields and lower grade corporate debt). My impression is that breakdowns in those measures will precede or quickly accompany any persistent market downturn.
Meanwhile, in lieu of a lengthy review of exactly how breathtaking current valuation extremes remain relative to reliable historical norms, it may be useful to revisit the chart-storm in last month’s market comment, simply titled Yikes.
Public health note
Early international seeding – reported U.S. cases rose from 5 to 11 over the weekend w/new locations. Each acts as local ‘patient zero,’ so containment and China flight restrictions look essential.
– John P. Hussman, Ph.D, February 3, 2020
Containment matters. On Friday morning, January 31 2020, the three largest U.S. airlines announced that they would suspend flights to and from China. Following this decision by the airlines, the 45th occupant of the White House responded by ordering that suspension.
The episode reminded me of a page from The Little Prince, by Antoine de Saint Exupery, in which the little prince encounters a king on asteroid 325, who orders him to do everything that he has already proposed:
“May I sit down?” came now a timid inquiry from the little prince
“I order you to do so,” the king answered him
“I beg that you will excuse my asking you a question”
“I order you to ask me a question,” the king hastened to assure him.
Unfortunately, the restrictions on passengers from China stood, for nearly 6 weeks, as the singular containment response during the most critical window that we had to limit the SARS-CoV-2 epidemic. Technically, flights from China were re-routed to a handful of airports including JFK in New York, SEA in Seattle, and SFO in San Francisco. Only symptomatic passengers arriving from Hubei Province or mainland China on or after February 2nd were subject to mandatory quarantine. Others from China were encouraged to self-quarantine at home, and passengers arriving from other countries even in March could waltz right through U.S. airports, no questions asked. It’s not a surprise that the areas of the U.S. that suffered high early fatalities were those with international hubs like New York, Seattle, and San Francisco, overlapping those that Lauren Gardner of Johns Hopkins CSSE projected back in January.
Worse, despite a disruptive and weakly-coordinated “lockdown” that was required primarily because of that early containment failure, no effective national post-lockdown arrangements were made to transition from population-wide containment measures to strong local containment measures involving testing, tracing, and isolation – which is the only thing that sustains the benefit. We are now far closer to the tipping point of a second wave of COVID-19 than may be evident. My hope is that some of what follows will help to put the situation into perspective, and encourage behaviors to restrain it.
It’s important to emphasize that the containment behaviors that we’ve pursued as a nation have saved hundreds of thousands of lives. Many Americans have sacrificed a great deal. Still, I also believe that many Americans have been needlessly persuaded to question or discount reasonable, prudent containment measures. This lack of coordinated response has worsened the situation for everyone.
As I noted in Avoiding a Second Wave, the entire trajectory of this epidemic can be described by rather straightforward arithmetic. Standard epidemiological projections use variants of a SIR (susceptible, infected, recovered) model based on a set of differential equations, but one can get the same results a bit more intuitively.
I haven’t seen this particular arithmetic elsewhere (but then, I also used to teach my college undergraduates how to derive the Black-Scholes option model using brute-force integration instead of appealing to the heat-transfer equation of thermodynamics). What follows will hopefully be intuitive, and it allows one to see the effect of various parameters directly.
A quick review of how epidemics spread
Note: If the equations in this section make you wheeze, please feel free to gloss over them as you read the text. You’ll still get all the key points.
Suppose that each person infected by SARS-CoV-2 encounters only one other person during the time that they are infected, and that the probability of transmitting the disease to that second person is p. Suppose that the second person also comes in contact with only one other person, and so on. Then the total number of people expected to be infected by the virus will be a “geometric sum”
1 + p + p^2 + p^3 + p^4 + …
As long as p is less than 1.0, this sum converges to 1/(1-p).
Now let’s scale this result up. Assuming that an infected person encounters an average of N people a day, and that the duration of the infective period is D days, each person infected by the virus will go on to infect, on average, N*D*p additional people. That’s what’s called the “base reproductive rate” or R0. If that number is greater than 1.0, the spread of the virus becomes exponential.
So for example, if the probability of infecting a contact is 10%, and an infected person comes in close contact with an average of 4 people a day, and remains infective for 7 days, each infected person will infect an average of R0 = 4*7*0.10 = 2.8 additional people.
Fortunately, there are effective ways of slowing or stopping an epidemic, and we can literally read them right out of the arithmetic:
- Reduce the probability that contact with an infected person will transmit the disease, which is where the use of face masks in shared indoor public airspace is critical, along with increased person-to-person distance, shorter interactions, and hygiene like hand washing and disinfecting common touchpoints;
- Reduce the number of contacts and social interactions, particularly involving “superspreading” events where one infected person can come into contact with lots of uninfected people, and “hub” locations where previously isolated groups of people come together and mix;
- Reduce the duration of infectivity, by quickly isolating new cases and tracing their recent contacts, in order to prevent transmission to additional people.
– John P. Hussman, Ph.D., Avoiding a Second Wave, July 30 2020
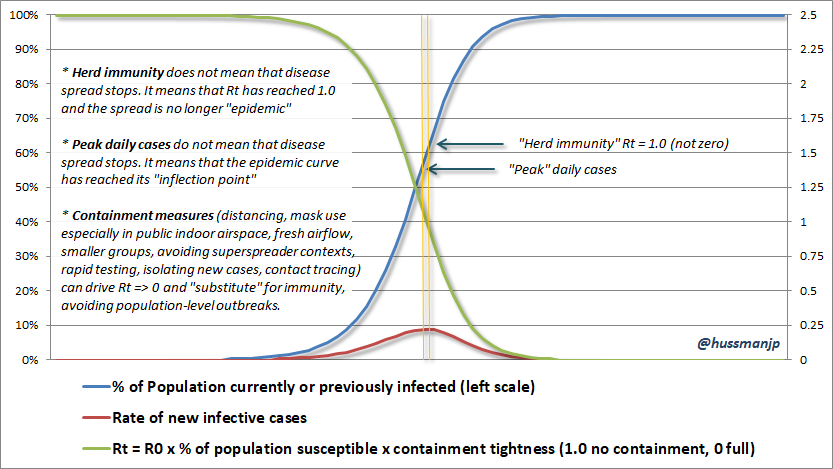
The most awful, brute force way to reduce the reproductive rate is to let everyone get infected. Assuming that an infected person either dies or develops immunity, then once some proportion H of the population is infected, each person will only go on to infect R0*(1-H) new people. For example, if R0 is 2.8 when everyone is susceptible, once half the population has been infected, half of all person-to-person interactions will have no consequence, so “Rt” – the reproductive rate at time t – will fall to 1.4.
There’s a particular point along the way, when each new person infected by the virus only goes on to infect just one additional person, on average. Notice that’s not zero additional people, but one.
That’s the definition of “herd immunity.” It’s the point where some proportion H of the population is infected, and each person infects only one additional person, on average. So herd immunity requires:
R0*(1-H) = 1
Which means that herd immunity is reached when the infected proportion reaches H = 1-1/R0
In our example where R0 is 2.8 (which is about the estimate for SARS-CoV-2), herd immunity would occur when about 64% of the population has been infected.
“Herd immunity” does not stop the spread of the virus. It just gives you a better opportunity to contain new local cases, as they emerge, without the spread becoming exponential. Transmission shifts from being “epidemic” to being “endemic.” Again, emphatically, it’s not where new infections stop. The chart below illustrates what phrases like “peak daily cases” and “herd immunity” actually mean.
Fortunately, there are effective ways of slowing or stopping an epidemic, and we can literally read them right out of the arithmetic:
- Reduce the probability that contact with an infected person will transmit the disease, which is where the use of face masks in shared indoor public airspace is critical, along with increased person-to-person distance, shorter interactions, and hygiene like hand washing and disinfecting common touchpoints;
- Reduce the number of contacts and social interactions, particularly involving “superspreading” events where one infected person can come into contact with lots of uninfected people, and “hub” locations where previously isolated groups of people come together and mix;
- Reduce the duration of infectivity, by quickly isolating new cases and tracing their recent contacts, in order to prevent transmission to additional people.
We can collect the overall impact of those intentional actions into a single number that measures the “tightness” of containment behaviors. In my own model, I estimate a parameter that can range between 0 and 1, representing behaviors that range from complete containment to unimpeded transmission. That makes it possible to describe the entire epidemic curve using nothing but basic arithmetic, with the looseness or tightness of containment behaviors helping to determine how many additional infections will result, on average, from each new case that emerges at each point in time.
That’s why containment efforts need to be taken so seriously… Without widespread immunity or vaccines, it’s those containment efforts that allow the growth process to go from exponential to logistic.
– John P. Hussman, Ph.D., Make Good Choices, February 25, 2020
It’s worth noting that while I’ve described R0 and Rt as if they’re specific numbers, they’re actually averages across a large number of individuals. Someone infected by SARS-CoV-2 who is immediately quarantined will contribute few or zero new cases. Someone who is at peak viral load, goes to a superspreader event, and converses with a large number of people will contribute a large number of new cases. The problem is that peak viral load can occur just before or even without symptoms. That’s part of the reason that mask use and avoidance of large, extended, conversational events is essential.
Don’t conflate prudent containment behaviors with “hard lockdown”
One of the most exasperating features of this epidemic has been the tendency of some people to conflate prudent containment behaviors with “hard lockdown.” No, no, no. There is a broad range of behaviors that can improve containment without requiring lockdown. One also has to remember that population-wide containment measures are only needed when local containment measures are inadequate. For most countries that imposed a strong, initial response, a brief lockdown was followed by a shift to coordinated practices that included rapid local testing, contact tracing, and isolation of new cases. That works, because once you can impose tight containment around every new local “patient zero,” you don’t have to impose population-wide lockdown, and you certainly don’t have to surrender to the notion of herd immunity (which again, isn’t where infection stops anyway).
Let’s examine three countries: the United States, Sweden, and China
I’ll preface this section by noting that because testing availability and intensity varies dramatically across countries, data on fatalities align far more closely with epidemiological models than case counts generally do. Countries with low case numbers but with a high percentage of tests being positive (a warning sign) can’t be easily compared with countries that have high case numbers but low test positivity. Early in this epidemic, it was clear that it was necessary to model “shadow” cases, and there was a great deal of uncertainty in those estimates. In recent months, the range of uncertainty has narrowed quite a bit.
The following analysis reflects estimates that are consistent with multiple lines of evidence, but they’re also not definitive. My main goal is to emphasize how strongly the course of this epidemic has followed basic arithmetic, and how important our own actions are in determining the trajectory it will take from here. Having worked with this data on a daily basis since the beginning of February, probably the most sobering aspect is how sensitive the epidemic trajectory is to very small changes in containment behavior. Some of the most distressing moments this year have been when I’ve had to change that “containment” estimate because fatalities suddenly went “off book.”
The chart below shows the actual course of U.S. fatalities, along with the epidemic curve that we can obtain purely based on the arithmetic I’ve described above. What we can infer directly from the data, which tightly overlaps actual policy actions (and I would expect, your own experience), is that U.S. containment practices began to gradually increase in early March, with a sharp tightening between late-March and mid-April, with a gradual relaxation between May and July after CDC “reopening” guidelines were released, and somewhat better adherence to mask use and social distancing in response to a spike in new cases in July. If there’s one thing to understand about this epidemic, it’s this. The epidemic curve doesn’t change because the behavior of the virus changes, but mainly because our own behavior changes.
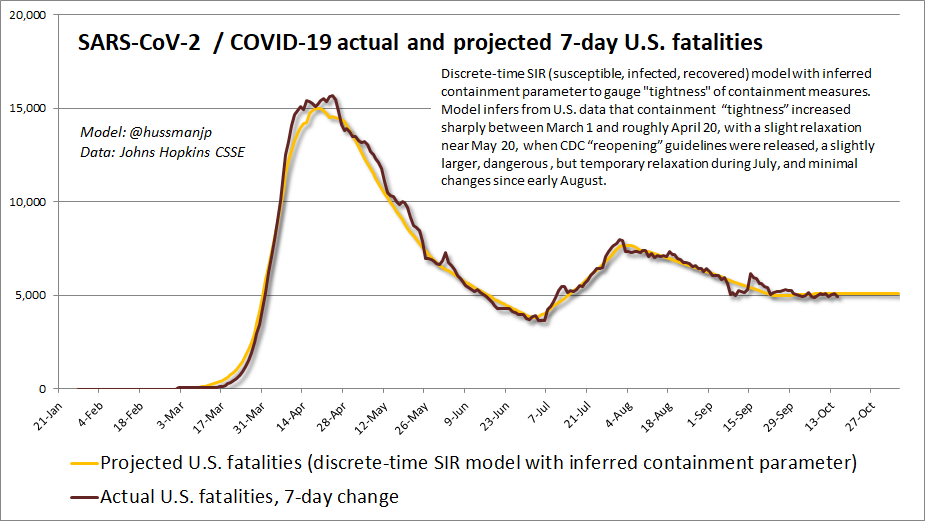
In recent weeks, U.S. fatalities have been fairly stable, but at a level that implies a large infective pool that could quite easily expand into a striking second wave if our containment behavior relaxes (which unfortunately would include greater indoor contact). As I noted a few months ago, nothing about the epidemic curve is fixed in stone. We have the capacity to alter it through our own behavior. The more we let the genie out of the bottle, the stronger the containment measures need to be to get it back in. Again, we actively choose the trajectory of this epidemic. That’s the message that I deeply hope you’ll take away from this discussion.
Sweden
One of the misperceptions regarding this epidemic is the belief that Sweden actively encouraged transmission of the SARS-CoV-2 virus in order to achieve “herd immunity.” While Sweden’s state epidemiologist Anders Tegnell has lamented the number of fatalities in Sweden, particularly early fatalities among the elderly, Sweden emphatically did not “go for” herd immunity. What the Swedish government actually did was to substitute a government mandated lockdown with broad social distancing and hygiene guidelines that relied on the culture of respect and shared responsibility of Swedish citizens for others – something that the U.S. has seemed sorely incapable of demonstrating. The Swedish government also imposed binding regulations against gatherings of more than 50 people in order to avoid “superspreader” events, and extended those measures to include restrictions on nursing home visits, distance learning for high schools, and partial closures of universities.
The concept of “herd immunity” is always discussed when epidemics are concerned. However, choosing to rely on the social responsibility of citizens, as an alternative to mandated lockdown, is wildly different than intentionally pursing herd immunity through viral transmission. The main place where people have been misguided enough to advocate “herd immunity” (or “herd mentality” as one official called it in a cringe-worthy moment) is the United States.
Swedes in general have changed their behavior to a great extent during the pandemic and the practice of social distancing as well as physical distancing in public places and at work has been widespread. During the months of March to early June, all shops were practically empty, people stopped dining with friends, and families stopped seeing even their closest relatives. A lockdown could not have been more effective. Handwashing, use of hand sanitizers, and staying home at the first sign of a cold became the new normal very quickly.
– Maria Furberg, M.D., Infectious Diseases Unit, Umea University Hospital, Sweden
What’s striking about the Swedish data is that while we can infer that containment tightness during three critical weeks in March was much closer to the U.S. than to Sweden’s neighbors, the estimated tightness of Swedish containment behaviors, reflecting the voluntary practices of Swedish citizens, actually became stronger than in the U.S. by mid-April. At that point, certain of our own government officials were tweeting things like “LIBERATE MICHIGAN!” and scheduling massive gatherings with zero social distancing, while Swedish officials were recommending additional measures to protect high-risk groups, along with guidance to avoid unnecessary travel, and were expanding coordinated testing, mental health support, and resources to local governments to strengthen the public health response.
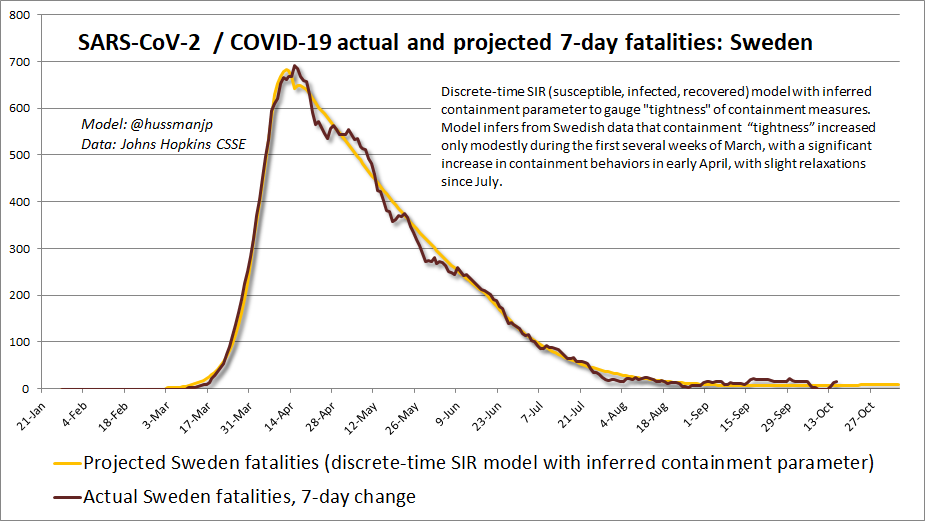
Though the U.S. and Sweden got there in much different ways, the result for both has been about 6 fatalities per 10,000 citizens, with the U.S. taking the lead. Based on multiple lines of evidence, I estimate that about 10% of the citizens in both countries have been infected, though the Swedish data are also consistent with the possibility that a somewhat larger proportion of the population has been infected, but that the elderly have been disproportionately protected in recent months.
In the U.S., the data imply that “herd immunity” would likely be associated with nearly 1.4 million U.S. fatalities, on the way to about 2 million. Remember, herd immunity means an Rt of 1.0 in the absence of additional containment measures, not an Rt of zero. Fortunately, prudent containment measures don’t require hard lockdown, can be wholly consistent with a functioning economy, and are fully capable of bringing Rt down to levels that would give us more time to develop effective vaccines and therapeutics. The main question is one of public will.
Herd immunity does not stop the spread of the virus. It just gives you a better opportunity to contain new local cases, as they emerge, without the spread becoming exponential.
I do believe that widespread use of face masks could have substantially reduced Sweden’s fatality rate much earlier. For those who insist on comparing the size of the virus to the size of mask holes, please understand that virions are not shed as individual particles, but in small respiratory droplets that are teeming with them. Think of a mask like sunscreen – you won’t block out everything, but you’ll certainly reduce the dose. The main thing that reduces the effectiveness of a mask is talking loudly through a poor-fitting one, at close range to others, at an event that you know deep down is probably prone to superspreading. Once you know how a virus spreads, common sense goes a long way.
While we’re on issues that drive endless whataboutism, it’s also worth noting that yes, viruses are constantly mutating, but most of those mutations are non-functional, so a second wave is more likely to be driven by greater indoor interaction and looser containment than by viral mutation. Viruses do tend to be somewhat “thermolabile” (meaning they thrive better in colder temperatures), but that’s a stronger characteristic of influenza than coronavirus. So get your flu shot as the cold weather approaches. Do pay attention to hand-washing, especially before eating or touching your eyes, nose or mouth to reduce transmission of both (advice to “avoid touching your face” isn’t concerned as much with your cheek).
As for vaccines, I’ve got a paper coming that addresses this more broadly, which I’ll share once it’s available – but my main concern is to ensure that safety testing is comprehensive, particularly with spike- and spike-RBD based antigens, and that the potential for immune enhancement (upon subsequent viral challenge) and the generation of self-reactive antibodies are explicitly taken into account. I’ve seen papers that claim the absence of antibody-dependent enhancement in monkeys or mice that were killed off 4-5 days after viral challenge. The problem is that in SARS coronavirus vaccine studies, diffuse alveolar damage in macaques wasn’t detected before day 7. Let’s get this right. Provided that testing is comprehensive and not just rammed through the FDA, I’ll be happy and relieved to get vaccinated.
Meanwhile, the group of one Americans who immediately received monoclonal antibodies coupled with dexamethasone to suppress their own immune response may want to consider the possibility that they may have cleared the virus without establishing adaptive immunity of their own. It may be best to refrain from tempting karma, who when tempted, has been known to be, um…
China
Finally, it’s instructive to examine the epidemic curve based on data from China. The SARS-CoV-2 epidemic was first reported to the World Health Organization by China on December 31, 2019, as “pneumonia of unknown etiology.” The virus was isolated and its genome was sequenced within two weeks of that. During those early weeks, the data suggest that new infections occurred in China without being impeded by social distancing or other containment measures.
Just after mid-January, the data suggest that containment measures were rapidly implemented. By the first week of February, China tightened far beyond anything observed in the U.S. or Sweden, and that tightness was sustained until new cases effectively dropped to zero. While I estimate that the containment parameter for the U.S. dropped as low as 0.37 during the spring (but not for very long), Sweden’s dropped as low as 0.36 and was sustained longer. China’s plunged almost immediately to 0.26 (where zero is equivalent to full isolation).
There’s little question that these measures were more authoritarian than a democracy would accept, but they also illustrate that the epidemic curve is just an exercise in arithmetic. The U.S. could very well achieve similar containment outcomes with far less authoritarian measures, if only we pursued ordinary, evidence-based, non-lockdown containment behaviors in a nationally coordinated way.
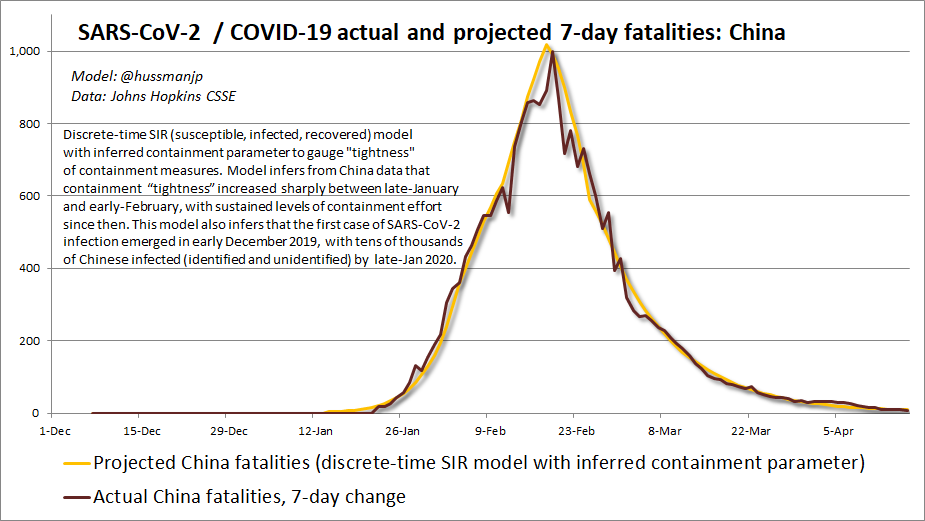
A fascinating aspect of the Chinese data is that the same epidemic parameters that help to explain other countries can be projected backwards, prior to the actual availability of data, in order to estimate the rough date at which community transmission began in earnest. By my estimate, that was about the second week of December 2019, undoubtedly with scattered but inefficiently transmitted cases before then. Remember, not all cases result in transmission to others. All of this is fairly consistent with reports that mark November 17 as the date of the first case of pneumonia (of unknown cause at that point).
What’s also fascinating is that back in early February, the ratio of actual cases to reported cases was estimated at anywhere between 10-to-1 (Johns Hopkins CSSE) and 38-to-1 (Wu et al, Lancet). Based on my own estimates, both of these figures are in the ballpark – just at slightly different dates, because of the rapid growth of early infection relative to case reports and testing. Specifically, as of January 25 2020, my own estimates infer actual cases over 33 times the number of cases China reported on that same date. Yet by February 1 2020, that same ratio was down to 11, I think mainly because testing became more broadly available and careful contact tracing was being implemented. That multiple has gradually declined further in China as testing has expanded relative to case growth.
Here in the U.S., I estimate that the actual number of people infected by SARS-CoV-2 to-date is currently just over four times the number of reported cases. Actual cases are undercounted partly because, based on very large-scale, unbiased testing, roughly 45% of people who acquire SARS-CoV-2 infection are asymptomatic. It’s also because many mildly symptomatic cases also go untested and unreported. Tragically, we’re still averaging over 700 fatalities a day, which is equivalent to one 9/11 attack nearly every 4 days. Somehow, we’ve proven ourselves to be remarkably skilled at riding right up to the edge of tragedy, with a willingness to change our behavior only when we cross the line, as we did when fatalities pushed higher in July.
Again, while I’ve seen my share of data-free verbal arguments, misleading claims, and reports based on highly biased sampling, my impression is that only about 10% of the U.S. population has been infected by the SARS-CoV-2 virus to-date. Yet we’ve already lost over 218,000 U.S. citizens. My hope is that all of us might be willing – in ways that need not involve “lockdown” or economic damage – to carefully exercise containment actions that respect and defend the well-being of others.
Keep Me Informed
Please enter your email address to be notified of new content, including market commentary and special updates.
Thank you for your interest in the Hussman Funds.
100% Spam-free. No list sharing. No solicitations. Opt-out anytime with one click.
By submitting this form, you consent to receive news and commentary, at no cost, from Hussman Strategic Advisors, News & Commentary, Cincinnati OH, 45246. https://www.hussmanfunds.com. You can revoke your consent to receive emails at any time by clicking the unsubscribe link at the bottom of every email. Emails are serviced by Constant Contact.
The foregoing comments represent the general investment analysis and economic views of the Advisor, and are provided solely for the purpose of information, instruction and discourse.
Prospectuses for the Hussman Strategic Growth Fund, the Hussman Strategic Total Return Fund, the Hussman Strategic International Fund, and the Hussman Strategic Allocation Fund, as well as Fund reports and other information, are available by clicking “The Funds” menu button from any page of this website.
Estimates of prospective return and risk for equities, bonds, and other financial markets are forward-looking statements based the analysis and reasonable beliefs of Hussman Strategic Advisors. They are not a guarantee of future performance, and are not indicative of the prospective returns of any of the Hussman Funds. Actual returns may differ substantially from the estimates provided. Estimates of prospective long-term returns for the S&P 500 reflect our standard valuation methodology, focusing on the relationship between current market prices and earnings, dividends and other fundamentals, adjusted for variability over the economic cycle.