

Fabricated Fairy Tales and Section 2A


John P. Hussman, Ph.D.
President, Hussman Investment Trust
April 2023
To describe a small change in the fed funds rate as a grave policy error vastly overestimates the correlation between monetary policy and economic outcomes. Information about the stance of monetary policy offers surprisingly little improvement or meaningful impact on forecasts for GDP growth, employment growth and inflation. Likewise, the relationship between unemployment and general price inflation better resembles a scatter of birdshot than a well-defined ‘curve’ or a manageable policy framework.
– John P. Hussman, Ph.D., FT Op-Ed, The Fed policy error that should worry investors, Jan 26, 2022
Amid the overabundance of economic opinion, unexamined clichés, and unverified assertions, and nutrient-free word salad dispensed by talking heads on television, market observers, and even Federal Reserve officials, I often wonder how many of them have ever taken the time to carefully examine historical data. After all, one might think, this is their profession – literally what they do for a living.
Yet when one compares the claims that are regularly made about economics and finance with actual historical data, the only reasonable conclusion is that people seem more interested in having a common framework to describe their world than whether that framework is correct.
A small example: On average, how much does the rate of inflation fall in the first year of a recession, as measured by the core personal consumption expenditures (PCE) index? The answer is that it doesn’t. During the first year of 11 recessions since 1950, core PCE inflation has actually posted a very slight increase, on average. The main contributor to that positive average was a 4.9% acceleration in the rate of inflation during the 1973-74 recession. The largest decline was -2.4% during the 1981-82 recession, as inflation retreated from a peak of over 9% in the core PCE price index and nearly 15% in the consumer price index (CPI). Inflation does fall during most recessions, but not by much. The median decline in core inflation in the first year of those 11 recessions was just -0.6%.
The change in core inflation during the two-year period following the beginning of a recession has averaged just -0.4%. The median decline was -0.7%. The single largest decline was -3.9%, as inflation retreated from the record highs that preceded the 1981-82 recession.
If we examine the change in core PCE inflation strictly from the beginning of a recession to its end, core inflation has not changed at all, on average. The median change is also zero. Shifting the window backward or forward by a few quarters doesn’t materially change these results. If we examine the average change in core inflation during the one-year period starting at any point during a recession, the average change is -0.4%.
To say that “monetary tightening reduces inflation by throwing the economy into recession” is to reveal that one has not examined the data. Much of that belief is driven by the 1981-82 period, when Paul Volcker tightened monetary policy to combat record inflation. But it was not recession in itself that broke the inflationary cycle. The essential victory of the Volcker Fed was to restore public confidence in monetary restraint and systematic monetary policy. Volcker did that by reducing the Federal Reserve’s balance sheet to the lowest fraction of nominal GDP in history. It was this restoration of public confidence, not recession per se, that brought down the rate of inflation so sharply. On average, recessions have no such effect.
But surely, the depth of a recession is correlated with the change in core inflation, isn’t it?
No. No, it is not. The correlation between the change in the unemployment rate during a recession and the change in core PCE inflation is 0.0.
To say that ‘monetary tightening reduces inflation by throwing the economy into recession’ is to reveal that one has not examined the data. Much of that belief is driven by the 1981-82 period, when Paul Volcker tightened monetary policy to combat record inflation. But it was not recession in itself that broke the inflationary cycle. The essential victory of the Volcker Fed was to restore public confidence in monetary restraint and systematic monetary policy.
But what about the Phillips Curve? Everybody knows that a higher unemployment rate results in lower inflation, and a lower unemployment rate results in higher inflation. Doesn’t it?
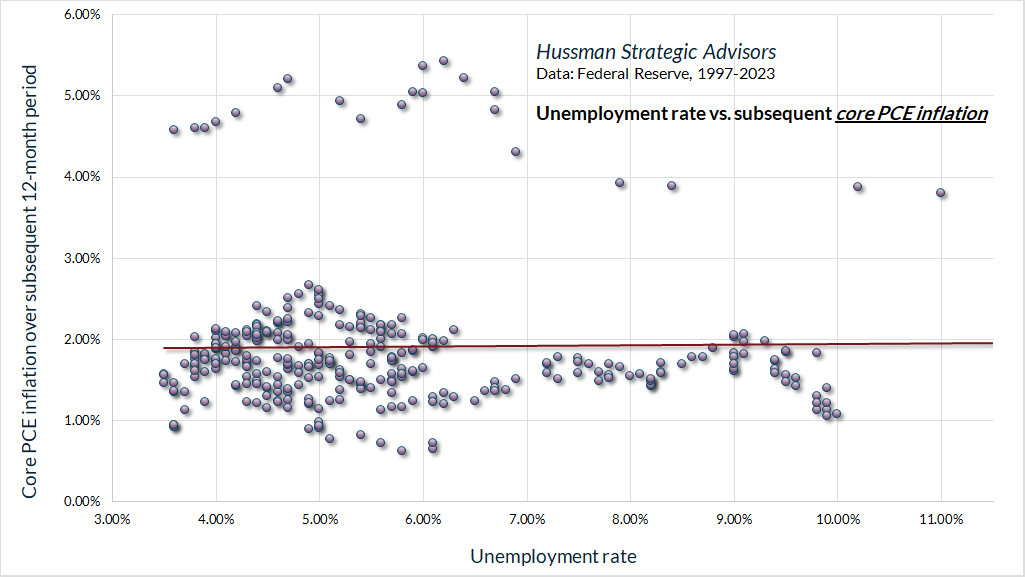
No. No, it does not. In data since 1950, the unemployment rate has had a slight positive correlation of 0.18 with the rate of core inflation over the following year. The best that can be said is that higher unemployment has exerted very slight downward pressure on the change in core inflation, but with a remarkably weak correlation of just -0.08. The chart below shows the relationship between unemployment and core inflation in recent decades.
The Phillips Curve is about real wage inflation, not general price inflation
You know this thing that the Fed, economists, college professors, and Wall Street all refer to as the “Phillips Curve”? Well, as I’ve observed for decades, it’s not the Phillips Curve at all. See, “curve” that A.W. Phillips actually proposed in 1958 was not a relationship between unemployment and general price inflation, but rather a relationship between unemployment and wage inflation. Moreover, Phillips based that research on a century of U.K data, most of which time the United Kingdom was on the gold standard, with very little general price inflation. Indeed, Phillips explicitly made an exception for periods when import price inflation (which reached its peak in 1920 following World War I) caused changes in the level of general prices.
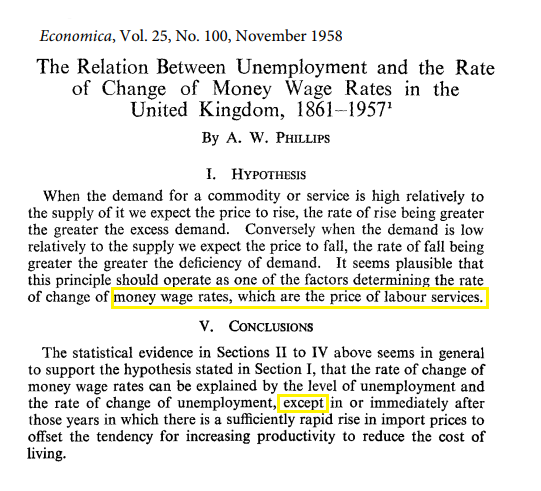
The “inflation” studied by A.W. Phillips in his seminal 1958 Economica paper wasn’t inflation in general prices. It was inflation in wages, amid stability in general prices. As a result, the Phillips Curve actually describes a relationship between unemployment and real wage inflation. As Phillips noted in his own hypothesis, it simply illustrates the principle of supply and demand, applied to the labor market. When unemployment is low and labor is scarce, the price of labor tends to rise relative to the price of goods and services. When unemployment is high and labor is in surplus, the opposite is true.
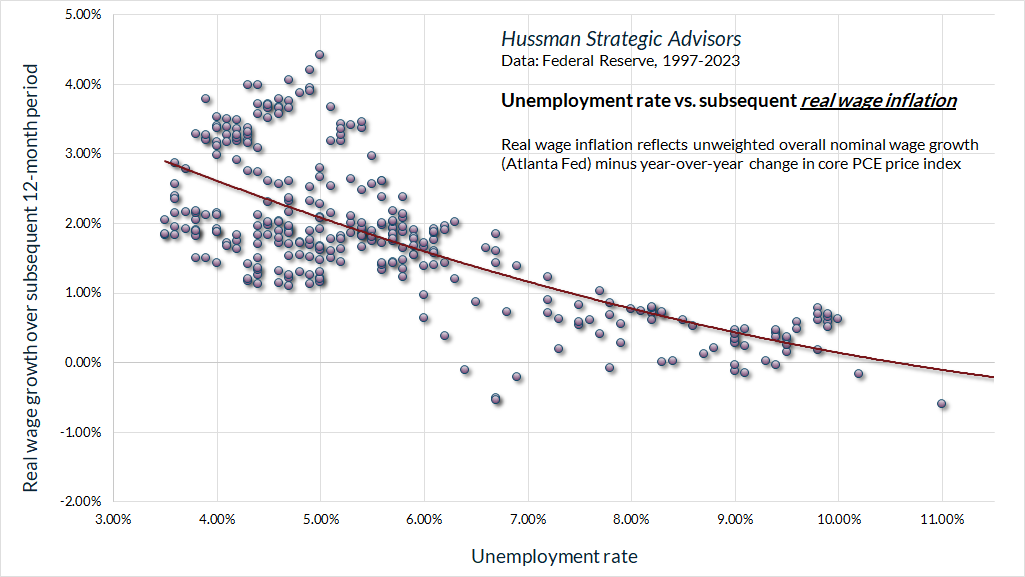
The Phillips Curve actually describes a relationship between unemployment and real wage inflation.
The chart below presents what I view as the actual Phillips Curve, showing the relationship between unemployment and real wage inflation. Whatever else people call a “Phillips Curve” is a misinterpretation of Phillips’ work, and when examined against historical data, has no basis in fact.
To imagine that the Phillips Curve proposes a “tradeoff” between the unemployment rate and general price inflation, and to set it as a cornerstone of the Federal Reserve’s “dual mandate,” is a profound deformation of economic fact. Indeed, to imagine that the primary role of the Federal Reserve is to actively to manipulate some “tradeoff” between inflation and unemployment is a misinterpretation of the Federal Reserve Act itself.
Violating the 2A mandate
Investors sometimes imagine that the Federal Reserve is an independent branch of government, and Fed officials encourage this belief with regular talk of Fed “independence.” The fact is that the Federal Reserve is a government agency, regulated by Congress, subject to the provisions of the Federal Reserve Act.
Want to know the Federal Reserve’s actual legal “mandate”? It’s the phrase following the word “shall.” Want to know the Fed’s policy objectives? They follow the phrase “so as to promote.” After the global financial crisis, the 2010 Dodd-Frank Act added an additional objective: to identify and monitor risks to the financial system, through the Fed’s participation on the Financial Stability Oversight Council (FSOC).
Section 2A. Monetary policy objectives
The Board of Governors of the Federal Reserve System and the Federal Open Market Committee shall maintain long run growth of the monetary and credit aggregates commensurate with the economy’s long run potential to increase production, so as to promote effectively the goals of maximum employment, stable prices, and moderate long-term interest rates.
Take a close look at actual mandate – the “shall” – of Section 2A. The Federal Reserve “shall maintain the long run growth of the monetary and credit aggregates commensurate with the economy’s long run potential to increase production.” The Fed doesn’t have a “dual mandate.” It has a single mandate, which it is expected to pursue in a way that effectively promotes several policy goals: maximum employment, stable prices, moderate long-term interest rates, and financial stability.
In its conduct of monetary policy, the Federal Reserve buys interest-bearing government bonds and replaces them with “base money” – historically bank reserves and currency in circulation. The mandate to increase base money “commensurate with” the economy’s potential to produce goods and services is central to maintaining long-run control of inflation.
While economists generally endorse an “independent” central bank, that independence has a very specific objective: to relieve the central bank from political pressure to monetize deficits, which could result in runaway inflation. The most important aspect of Fed independence is the responsibility to run a restrictive monetary policy when necessary.
Now, technically, it’s impossible for monetary policy to be truly “independent” of fiscal policy. If the government runs a deficit, it can either issue Treasury bonds to the public, or the Fed can buy those Treasury bonds and let the public hold base money instead. It’s more accurate to say that fiscal policy determines the quantity of government liabilities that the public has to hold, and monetary policy determines the mix of government liabilities (bonds versus money) that the public has to hold.
Over the past decade, the Federal Reserve has wildly abused its “independence,” violating both its 2A mandate and its responsibility for maintaining financial stability, insisting on unprecedented monetary expansion, bringing the ratio of Fed liabilities to both real and nominal GDP to levels never before seen in history, and triggering a decade of yield-seeking speculation that is likely to unwind in tears.
Why is the 2A mandate important? Well, a unit of fiat money is a sort of “security,” whose value, like any security, rests on the sum of all the little future “services” it will provide as a means of payment and as a store of wealth. The reason others accept these pieces of paper in return for goods and services is because they expect the next person to do so, without losing much value along the way. The next person accepts it for the same reason, and so on – it’s “turtles all the way down.”
As crypto speculators will gradually discover the hard way, one of the indispensable advantages that give value to the dollar is that, as “fiat money,” people are required by law to accept it. You can read that provision directly under the Federal Reserve’s emblem on the left side of any dollar bill in your wallet. Fed-created base money is, by law, also the substrate of the entire banking system. Nearly every non-cash transaction, including those that settle credit card obligations, involves a transfer of base money from one bank to another.
The benefit of fiat money to the government is that, as long as people are willing to accept it in return for valuable goods and services, creating the stuff can be a form of deficit finance. If the Federal Reserve obeys its 2A mandate, the quantity of money can be increased over time, commensurate with the economy’s ability to produce output, providing a non-inflationary source of funding to the government. But adhering to that 2A mandate is the key to long-term price stability.
Over the past decade, the Federal Reserve has wildly abused its ‘independence,’ violating both its 2A mandate and its responsibility for maintaining financial stability, insisting on unprecedented monetary expansion, bringing the ratio of Fed liabilities to both real and nominal GDP to levels never before seen in history, and triggering a decade of yield-seeking speculation that is likely to unwind in tears.
The situation is as insane as it looks
Adhering to 2A is what enables the Federal Reserve to conduct monetary policy without requiring extraordinary measures (such as paying hundreds of billions in interest payments to banks). Here’s why. Conceptually, if the quantity of base money “M” was to grow at the same rate as real GDP “Y,” and the general level of prices “P” was stable, with zero inflation, then the ratio of base money to nominal GDP (M/PY) would be constant. In practice, the ratio of base money to nominal GDP changes over time. But fluctuations in that ratio can be very consequential to the financial markets. In fact, changes in the ratio of base money to nominal GDP are directly linked to the level of short-term interest rates.
Prior to the past few years, the base money created by the Fed earned zero interest. If the Fed created more base money, banks with excess holdings would try to lend their excess reserves to other banks, driving down the “Federal funds” rate that banks charge each other for those loans. Meanwhile, savers (whose bank deposits are backed by base money) would look for higher-yielding alternatives, typically finding that alternative in Treasury bills. As a result, increasing base money as a share of GDP would result in a lower Federal funds rate and lower T-bill yields.
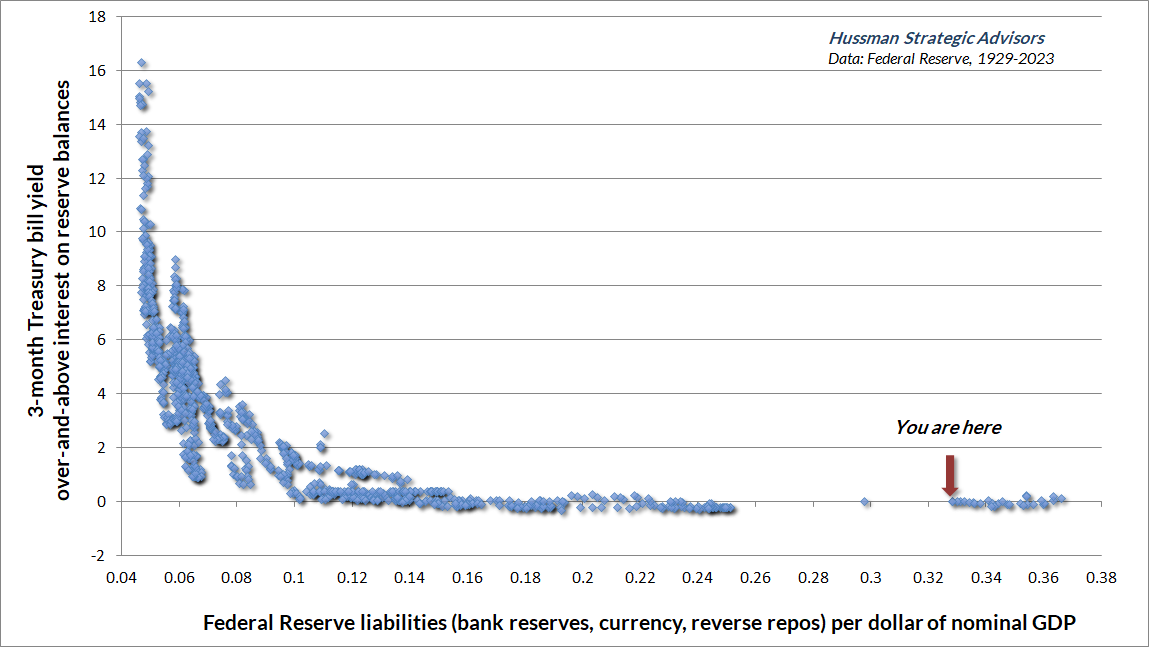
Once the Fed expands its balance sheet beyond about 16% of GDP, which never occurred prior to 2010, interest rates are driven all the way to zero. Beyond that point, the Federal Reserve loses the ability to change the level of interest rates through changes in its balance sheet. Indeed, having expanded its balance sheet to the equivalent of 32% of nominal GDP, the Fed is presently operating monetary policy by explicitly paying 4.9% interest to banks on all of their reserves (even though the assets on its balance sheet were purchased at an average yield of only about 2.5%).
The chart below puts all of this together, in monthly data since 1928, and illustrates how egregiously the Fed has violated its 2A mandate to align monetary growth with output growth. The chart is our version of what economists call the “liquidity preference curve.” The horizontal axis shows the ratio of Fed liabilities (bank reserves, currency, and newer “reverse repurchase” obligations) to nominal GDP. Prior to recent years, it was enough to label the vertical axis as “3-month Treasury bill yield.” In recent years, rather than operating monetary policy by changing the amount of base money – as the Federal Reserve Act intended – the Fed has taken to changing interest rates by explicitly paying interest to banks on their reserve balances (IORB). As a result, we now label that vertical axis as “3-month Treasury bill yield over-and-above interest on reserve balances.”
The situation is as insane as it looks.
When Jerome Powell tells you that ‘the large financial institutions hold very large quantities of safe assets now as a liquidity buffer, and that includes a lot of reserves,’ it’s worth remembering that the ‘safe assets’ are Fed liabilities, and financial institutions are holding them because the Fed has jammed them down everybody’s throats. What Powell describes as a ‘scarce reserves regime’ is actually the policy environment that operated during the entire existence of the Federal Reserve prior to 2010.
John P. Hussman, Ph.D., Now Comes the Hard Part, September 25, 2022
For more details on how quantitative easing, open market purchases, and interest rates are related, see the section titled Diary of a deranged ‘ample reserves regime’ in the market comment quoted above.
None of the intended benefit, all the unintended consequences
As the Fed expanded its balance sheet wildly beyond anything reasonably “commensurate” with GDP, it ensured that someone in the economy would have to hold those monetary liabilities. For more than a decade, that money earned zero, provoking the most extreme episode of yield-seeking speculation in U.S. market history. The U.S. banking system now holds $8 trillion in deposits over-and-above the FDIC insurance limit, because the Federal Reserve put them there. Silicon Valley Bank used those deposits to chase yield in long-term Treasury bonds. The combination of losses on those bonds, and a run on the bank by depositors, recently produced the second-largest bank failure in U.S. history.
That was just round one. Buckle up.
Combined with post-pandemic supply disruptions and excess demand fueled by pandemic subsidies, the Fed’s reckless expansion of base money has also reduced public confidence and devalued the dollar relative to goods and services, which we observe as inflation. Meanwhile, the Fed has also lost the ability to manage short-term interest rates except at public expense.
In an attempt to respond to inflationary pressures, the Fed is now making explicit interest payments of 4.9% to banks on their excess reserves. This has raised short-term interest rates, though artificially and at enormous cost.
Yet just as the Phillips Curve has been misconstrued as a relationship between unemployment and general price inflation (rather than real wage inflation), the appropriate response to inflation has been misconstrued as a task of raising interest rates, when it is actually a task of constraining the supply of money – specifically, the ratio of Fed liabilities to GDP.
Across history, prior to quantitative easing, those two things were basically the same. Reducing the ratio of base money to nominal GDP was essentially equivalent to raising interest rates. Paul Volcker knew this. Appointed as Fed Chair in 1979 by Jimmy Carter, Volcker understood that it was essential to restore public confidence that was lost by the overly accommodative policies of Arthur Burns, which had been encouraged by Nixon (evidence from the Nixon Tapes).
Volcker targeted the money supply directly. Interest rates rose because the ratio of base money to GDP declined, but Volcker wasn’t under the delusion that raising interest rates was what would bring inflation under control. Instead, inflation declined because the Volcker Fed restored public confidence that the Fed would exercise restraint and pursue systematic monetary policy.
The truly unique power of a central bank, after all, is the power to create money, and ultimately the power to create is the power to destroy. When I hear complaints about less liquidity, remember there is such a thing as too much liquidity.
– Paul Volcker
This understanding has been entirely lost in recent years, as investors and economists alike have somehow come to believe that inflation is brought under control by raising interest rates enough to create unemployment and throw the economy into a recession – wholly ignoring the size of the Fed’s balance sheet, and perpetuating the Fed’s deranged “ample reserves regime” despite massive capital losses, despite hundreds of billions interest payments to banks at public expense, and despite $8 trillion in bank deposits over-and-above FDIC insurance limits, there precisely because the Fed put them there.
In effect, everyone has come to believe that inflation is brought under control by manipulating what they imagine is the “Phillips Curve.” Yet in decades of actual economic data, there’s no strong or reliable relationship between the rate of unemployment and the subsequent level or change in inflation.
Volcker wasn’t under the delusion that raising interest rates was what would bring inflation under control. Instead, inflation declined because the Volcker Fed restored public confidence that the Fed would exercise restraint and pursue systematic monetary policy.
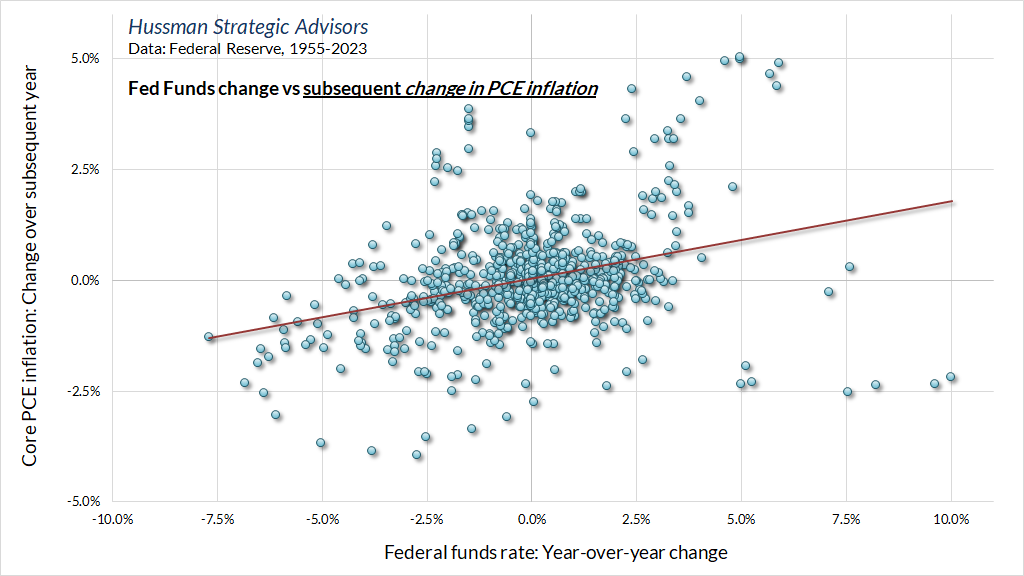
Even rate hikes themselves have a weak and unreliable effect on the change in core inflation over the subsequent year. Worse, that weak and unreliable effect has a positive slope. The greater the increase in the Fed funds rate, the larger the increase in core PCE inflation over the subsequent year, on average. There’s no evidence at all that raising the Fed funds rate, in itself, is associated with a slowing of core inflation. There are certainly benefits in setting rates based on systematic policy benchmarks, including increased public confidence and reduced risk of financial distortion. But a strong and reliable cause-and-effect impact on inflation is not among those benefits.
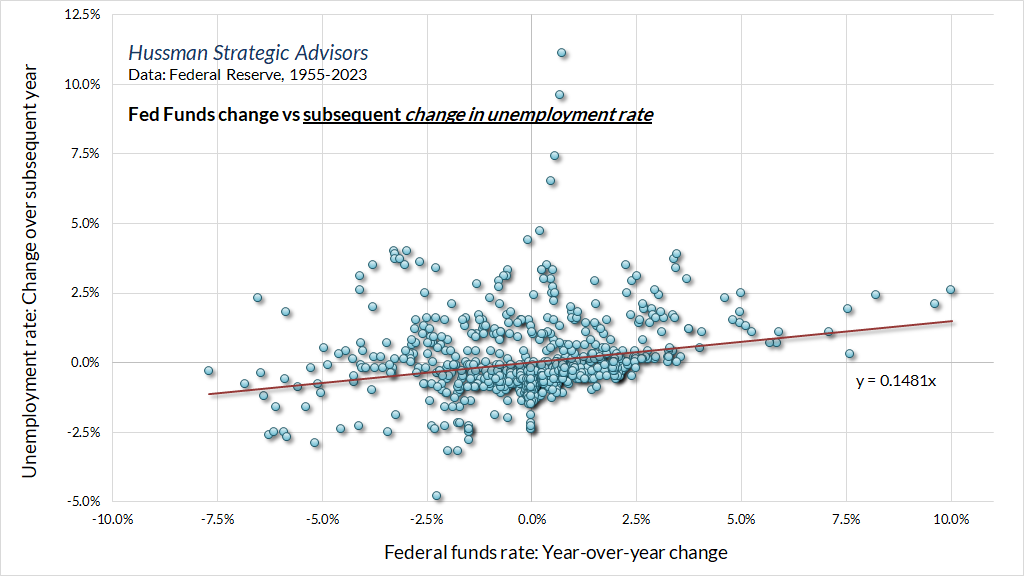
Similarly, the impact of rate hikes on unemployment is also weak and unreliable. The effect is slightly positive, so rate hikes do tend to be associated with higher subsequent unemployment, but the effect size is minor – a 200 basis point change in the Fed funds rate is associated, on average, with an increase of only 0.3% in the unemployment rate. Rate hikes have a disproportionate impact on interest-sensitive sectors such as housing and durable goods, but the effect on overall economic activity is actually fairly weak.
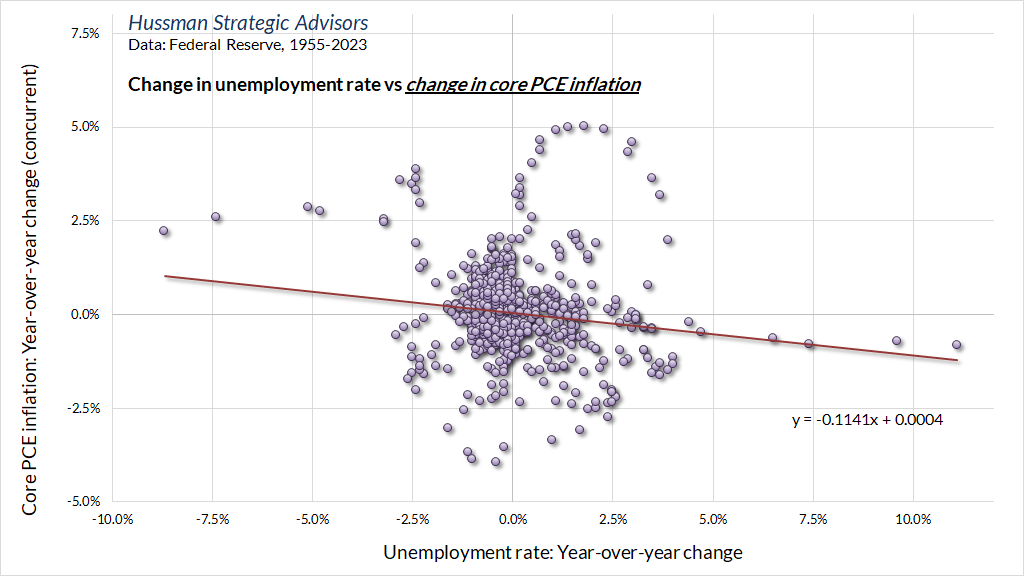
Once the rate of unemployment rises, it’s widely imagined that core inflation should drop like a rock. The reality is that changes in the unemployment rate are virtually uncorrelated with subsequent changes in core inflation. The slope is slightly negative, so increased unemployment does tend to be associated with a subsequent decline in core PCE inflation, but again, the effect size is minor. A 1% increase in unemployment is associated, on average, with a subsequent decline of only about -0.1% in core inflation over the following year. The same is true when changes in unemployment and core inflation are measured concurrently.
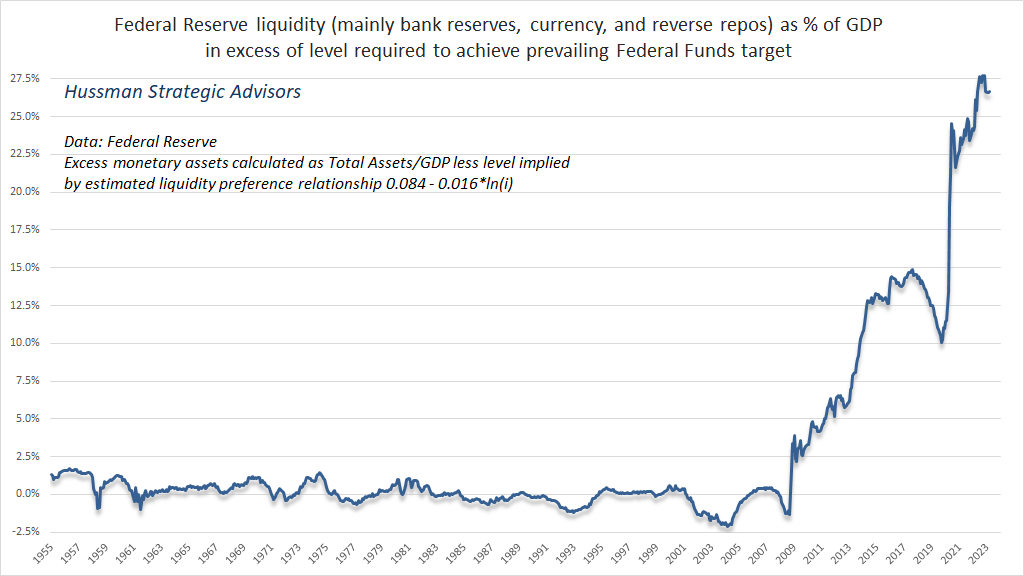
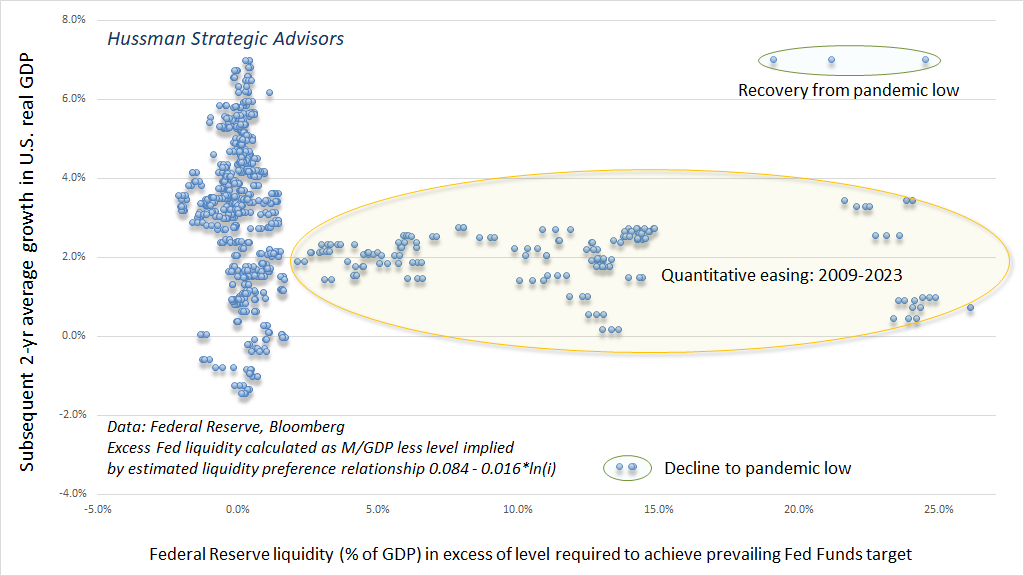
What about quantitative easing? Well, recall that there’s a very well-defined relationship, in data since 1928, between the ratio of Fed liabilities/nominal GDP and the level of short-term interest rates. This also allows us to estimate the quantity of Fed liabilities (as a fraction of GDP) over-and-above the amount that have historically been necessary to achieve the Federal Reserve’s prevailing target for the Fed funds rate. That estimate is presented below.
How has all that excess liquidity helped the economy? Well, despite the most aggressive monetary expansion in history, total bank lending (business, consumer, real-estate) during the 14-year period from 2008 to 2022 grew at just 3.4% annually, the slowest growth rate in U.S. history since 1947.
Similarly, we find no correlation at all between the quantity of excess liquidity produced by the Federal Reserve and the growth of real U.S. GDP over the subsequent two-year period.
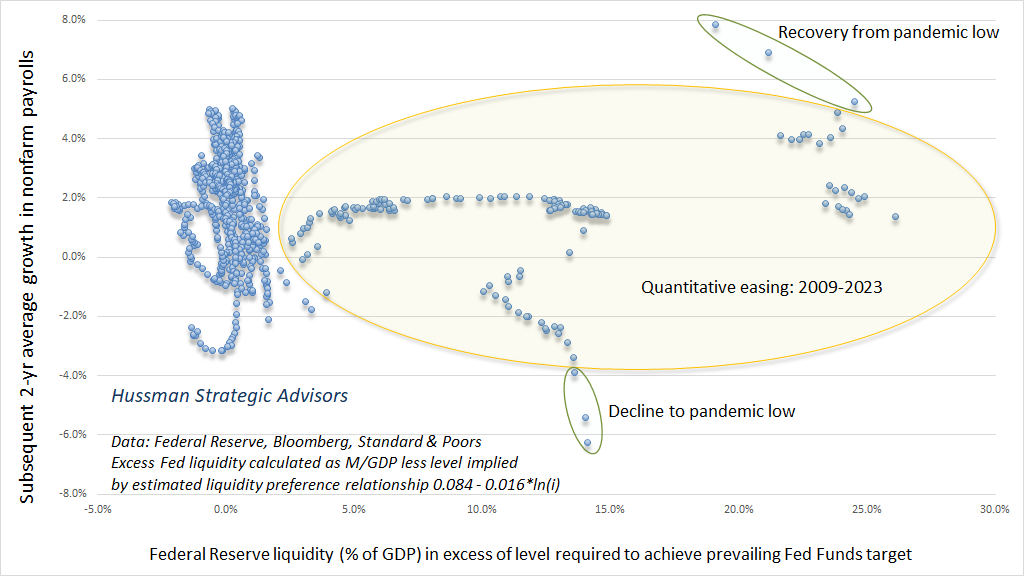
The same is true for the relationship between excess liquidity and the growth of nonfarm payroll employment over the subsequent two-year period.
Examining all this data may leave you thinking “Wait, what?!? How is it possible that there’s no basis in the data for all of these ideas that people take as common knowledge – from the Phillips Curve; to the supposed ‘economic support’ provided by quantitative easing; to the effect of rate hikes on unemployment and inflation? How is it possible that people who do this for a living can keep repeating wholly unsupported cause-and-effect arguments without even taking the initiative to operate a basic scatterplot?”
Welcome to my world.
My impression is that there are two reasons these misconceptions survive. First, I really do believe that, particularly in the face of uncertainty, people find comfort in having a common framework to discuss and explain their world, even if that framework is incorrect. Second, there’s a natural tendency for investors to draw cause-and-effect inferences from the most extreme examples, using them to confirm their framework even when different factors are actually responsible.
For example, inflation fell substantially both during the Depression and during the global financial crisis. Those declines provide anecdotal evidence that recessions and unemployment result in lower inflation. The problem is that both of these factors have rather weak effects on inflation in themselves. Instead, declining inflation is better correlated with measures of risk-aversion, provided the financial strains are extreme, for example, spiking credit spreads and steep equity market losses.
Specifically, when investors become very risk-averse, risk-free liquidity becomes a desirable asset rather than an “inferior” one. When investors become risk-averse, the perceived “value” of Fed liabilities – dollars – becomes very high, so people are willing to exchange lots of goods and services (and as it happens, risky securities) for cash. That produces declining inflation, hand-in-hand with financial market losses.
In the early 1980’s, Paul Volcker drove inflation lower by restraining the supply of money relative to nominal GDP. In the Depression and global financial crisis, credit strains drove inflation lower by increasing the demand for money relative to nominal GDP. Ultimately, price stability is achieved by aligning the quantity of Fed liabilities with the quantity of economic output. Moreover, because the ratio of Fed liabilities to GDP determines the level of short-term interest rates, the proper conduct of monetary policy involves systematically varying that ratio within a historically well-defined range (4%-12% of nominal GDP), in consideration of factors such as employment, inflation, interest rates, and financial stability.
Across history, we find that the best predictor of inflation is not unemployment, GDP growth, or even Federal Reserve policy. Rather, inflation has a significant psychological component; the best predictor of inflation is the most recent rate of inflation, with the next best predictor being lagged inflation from the previous year. In recent months, investors appear to have taken rapidly declining inflation and resumed monetary easing for granted, embedding those expectations into bond yields and still-elevated market valuations. Having done so, investors now rely on those outcomes. Meanwhile, the most likely drivers of improving inflation – economic recession and credit strains – would pose their own challenges to the financial markets. In our view, this creates a tightrope: the failure of inflation to resolve quickly would be unfavorable for the financial markets, yet the conditions most likely to produce a quick resolution of inflation would also be unfavorable for the financial markets.
– John P. Hussman, Ph.D., Hussman Funds 2022 Semi-Annual Report and Shareholder Letter
Amid the fairy tales, what’s the truth?
None of these fairy tales are lovely, adventurous stories that are told to children at bedtime. No, these fairy tales are data-free assertions and misconstructions of reality that the Fed tells Congress, professors tell their Econ 101 students, Wall Street talking heads repeat on financial television in a deluge of cliché, and that investors ultimately tell themselves. They are dangerous because they encourage strikingly misguided policy that ultimately hurts real people.
One is not paying attention if one has not connected the dots from the Federal Reserve’s unsystematic and sustained suppression of interest rates after the tech bubble crashed; to the hunt for alternatives by yield-starved investors; to the increased demand for mortgage securities which offered a higher and historically safe “pickup” in yield; to the lowering of lending standards to create enough “product” to meet that demand; to a speculative housing bubble fueled by sub-prime, no-doc, and securitized loans; to a massive subsequent collapse at the cost of millions of jobs.
One is not paying attention if one has not connected the dots from a decade of “quantitative easing” that pushed base money beyond any systematic range “commensurate with” economic activity; to trillions of dollars of forced zero-rate bank deposits held by investors who could not, in aggregate, get rid of the stuff; to speculation in every sort of asset that might offer a “pickup” in return (T-bills, mortgage securities, “covenant lite” corporate debt, leveraged loans, equities, long-term bonds, and even digital Pokémon); to record low interest rates and record equity valuations beyond 1929 and 2000 extremes; to emerging crises in pension funds; to bank failures as losses on even “safe” securities like Treasury bonds create insolvency while $8 trillion of deposits in excess of FDIC insurance limits trigger bank runs; to the likelihood of a collapse in the S&P 500 on the order of 60% as this Fed-induced yield-seeking spectacle unwinds.
The truth is that departures from systematic monetary policy distort behavior in ways that cause misalignments between financial quantities and real economic quantities, and as a result, they invariably produce damage as the two are ultimately realigned. As I’ve detailed previously (see my January 2022 Op-Ed The Fed Policy Error that Should Worry Investors), “systematic monetary policy” means a framework where policy tools such as the level of the Fed funds rate and the size of the Federal Reserve’s balance sheet maintain a reasonably stable and predictable relationship with observable economic data such as output, inflation, employment, and the “gap” between real gross domestic product and its estimated full-employment potential.
Systematic policy recognizes that the “Phillips Curve” is an observation about the relationship between unemployment and real wages, not a “tradeoff” that can be manipulated. It recognizes that suppressing interest rates and drowning banks in liquidity has weak and unreliable effects on real economic activity and employment, but massive effects on financial speculation and resulting instability. Systematic policy is content to align monetary aggregates with output aggregates. Systematic policy is content to set interest rate targets based on reasonable policy benchmarks informed by observable economic variables. Systematic policy is content to achieve those targets by modestly changing the ratio of base money to GDP, rather than forcing the economy to choke down 36% of GDP in Fed liabilities while using public money to explicitly pay interest to banks on all of it.
That’s the beauty of Section 2A of the Federal Reserve Act: it mandates that the Fed should set monetary aggregates commensurate with output aggregates. It is not a license to expand the balance sheet until inflation becomes unacceptable, or to raise interest rates by paying banks with public funds. It’s just that people are constantly told fairy tales that make them imagine that systematic policy is not enough – aye, too boring when there be dragons to slay, beanstalks to climb, and kingdoms to save by valiant knights. These fairy tales encourage activist and even deranged policy experiments like quantitative easing, and obscure the fact that the Fed is violating its mandate. The children even come to believe that the Fed is an order of chivalry, with knights on white horses, when it’s actually the band of ogres that creates the problems in the first place.
Systematic monetary policy means a framework where tools such as the level of the Fed funds rate and the size of the Federal Reserve’s balance sheet maintain a reasonably stable and predictable relationship with observable economic data such as output, inflation, employment, and the ‘gap’ between real gross domestic product and its estimated full-employment potential. Departures from systematic monetary policy distort behavior in ways that cause misalignments between financial quantities and real economic quantities, and as a result, they invariably produce damage as the two are ultimately realigned.
Systematic policy recognizes that the ‘Phillips Curve’ is an observation about the relationship between unemployment and real wages, not a ‘tradeoff’ that can be manipulated. It recognizes that suppressing interest rates and drowning banks in liquidity has weak and unreliable effects on real economic activity and employment, but massive effects on financial speculation and resulting instability. Systematic policy is content to align monetary aggregates with output aggregates. Systematic policy is content to set interest rate targets based on reasonable policy benchmarks informed by observable economic variables. Systematic policy is content to achieve those targets by modestly changing the ratio of base money to GDP.
A decade of quantitative easing has led investors to imagine that Fed easing reliably supports the stock market, and that it is Fed easing that ends market collapses. The fact is that the Fed eased persistently and aggressively through both the 2000-2002 and 2007-2009 collapses. Historically, the worst market outcomes have typically occurred when the Fed is easing in an environment that combines economic weakness with risk-aversion among investors. If one believes that a Fed “pivot” is something that investors should hope for, one is not paying attention.
The market plunge during the first quarter of 2020 ended because Congress passed the multi-trillion CARES pandemic stimulus package on March 27, 2020. The 2008-2009 global financial crisis ended not because of quantitative easing (though the Fed’s purchases of mortgage bonds were certainly helpful in supporting the housing market), but because the Financial Accounting Standards Board eased FAS 157 mark-to-market requirements in March 2009. That change allowed banks “discretion” in valuing their troubled assets, rather than requiring the use of market value. That basically removed the specter of widespread bank insolvency, by making insolvency opaque.
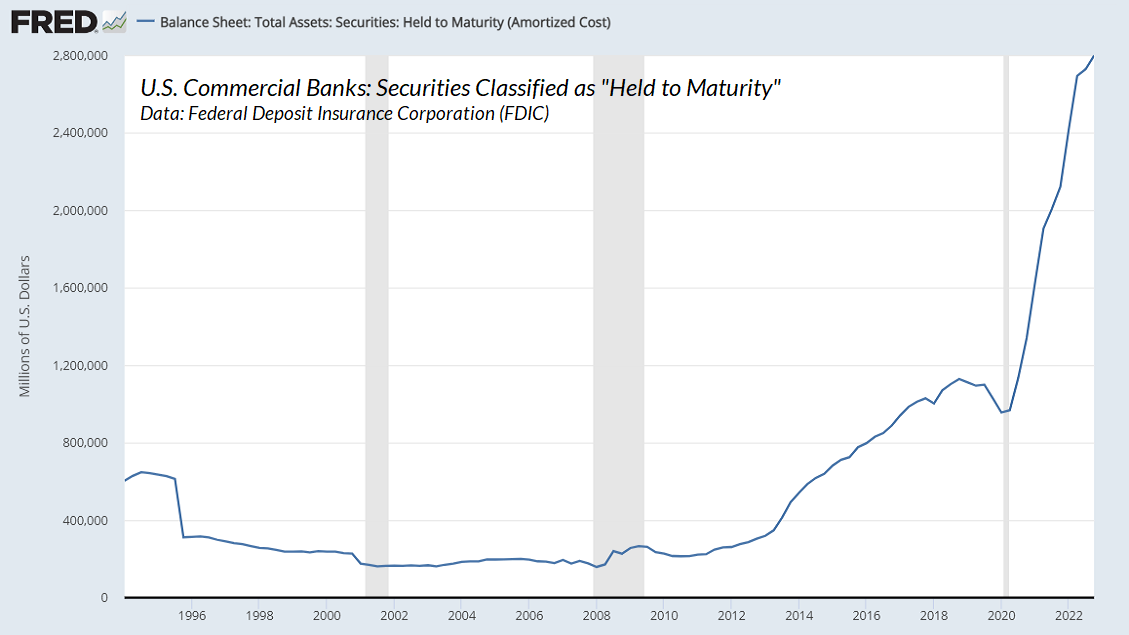
As Silicon Valley Bank discovered, the problem is once depositors ask for their money back, the actual market value of the assets suddenly matters. That’s also true of Ponzi schemes. When you see the exploding quantity of assets classified by commercial banks as “held to maturity,” you’re seeing loose FAS 157 accounting standards in action. Commercial banks now hold $2.8 trillion in held-to-maturity securities. By comparison, total bank capital is $2.2 trillion. Banks, in aggregate, can tolerate a reasonable amount of losses, and of course, classifying assets as held-to-maturity allows those losses to go unreported. Still, none of this quiet Ponzification of the banking system would be necessary if not for a decade of misguided Fed policy.
Market conditions
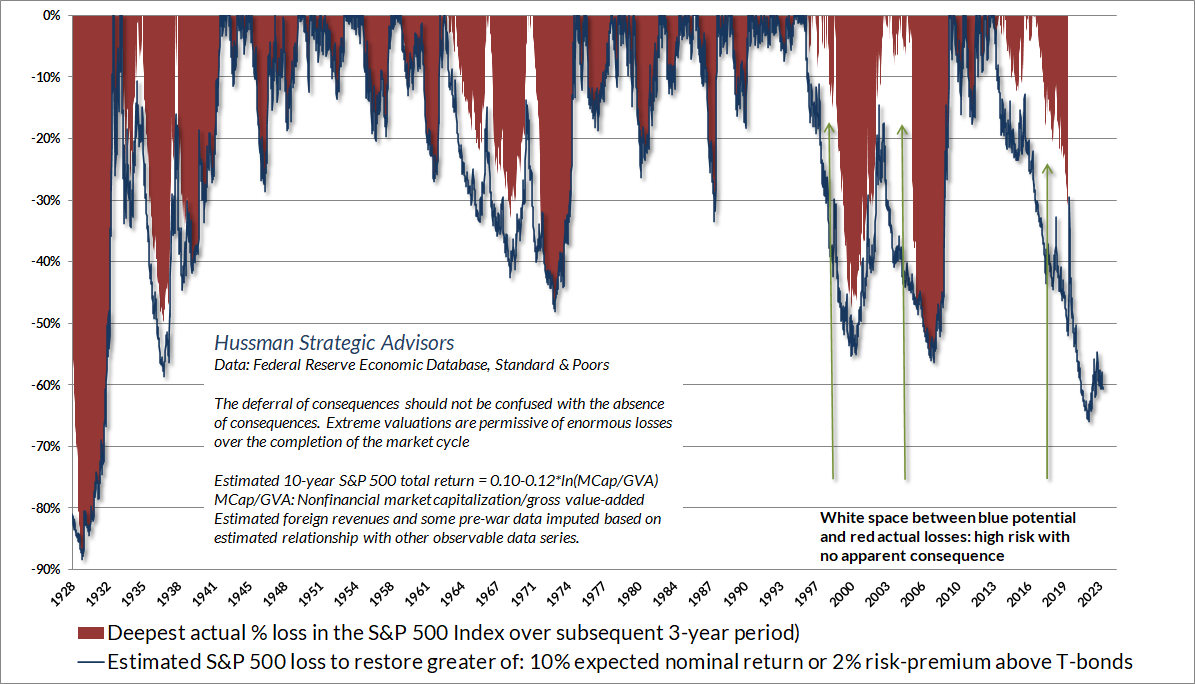
At present, our most reliable equity market valuation measures remain more extreme than at any point in history prior to July 2020, with the exception of a few months directly surrounding the 1929 peak, and two weeks in April 1930. Meanwhile, our primary gauge of market internals remains unfavorable, based on uniformity and divergence of market action across thousands of individual stocks, industries, sectors, and security-types, including debt securities of varying creditworthiness. Those conditions may change, but for now we continue to estimate the likelihood of negative 10-12 year S&P 500 total returns, with the prospect of interim losses on the order of -60%. I recognize that these projections seem preposterous, but that is the situation that more than a decade of Fed-induced, yield-seeking speculation has now created for investors. For an extensive, data-rich discussion, see my February comment, Headed for the Tail.
Still, because financial markets are driven by the beliefs and opinions of market participants, it’s essential to concede that it doesn’t matter a bit – in the short term – whether those beliefs and opinions are correct. Actual economic relationships, cash flows, valuations, and reality only matter over the complete market cycle and over the long-term. It’s on that horizon – the completion of the cycle, and the long-term – that the difference between opinions and reality exert their impact, in the form of events like credit crises, market collapses, and extraordinarily long and interesting trips to nowhere for total returns.
As Benjamin Graham observed, in the short run, the market is a voting machine, but in the long-run, it’s a weighing machine. We remain convinced that attention to the combination of valuations and market internals is the most effective way to arbiter battles between short-term investor psychology and long-term cash flows.
While a shift back toward speculative investor psychology would not relieve the extremely poor long-term outlook for the equity market, it could certainly defer those consequences. My impression is that the window for such improvement is narrowing, given that measures of deteriorating employment conditions are gradually joining leading measures that have been pointing toward recession for months now. At current valuations, an improvement in our measures of market internals wouldn’t provide the basis for a bullish investment outlook, but it would suspend the immediacy of our bearish outlook. For now, conditions remain in what I often describe as a “trap door” situation. A market collapse, at its core, is really nothing but risk-aversion meeting a market that is not priced for risk.
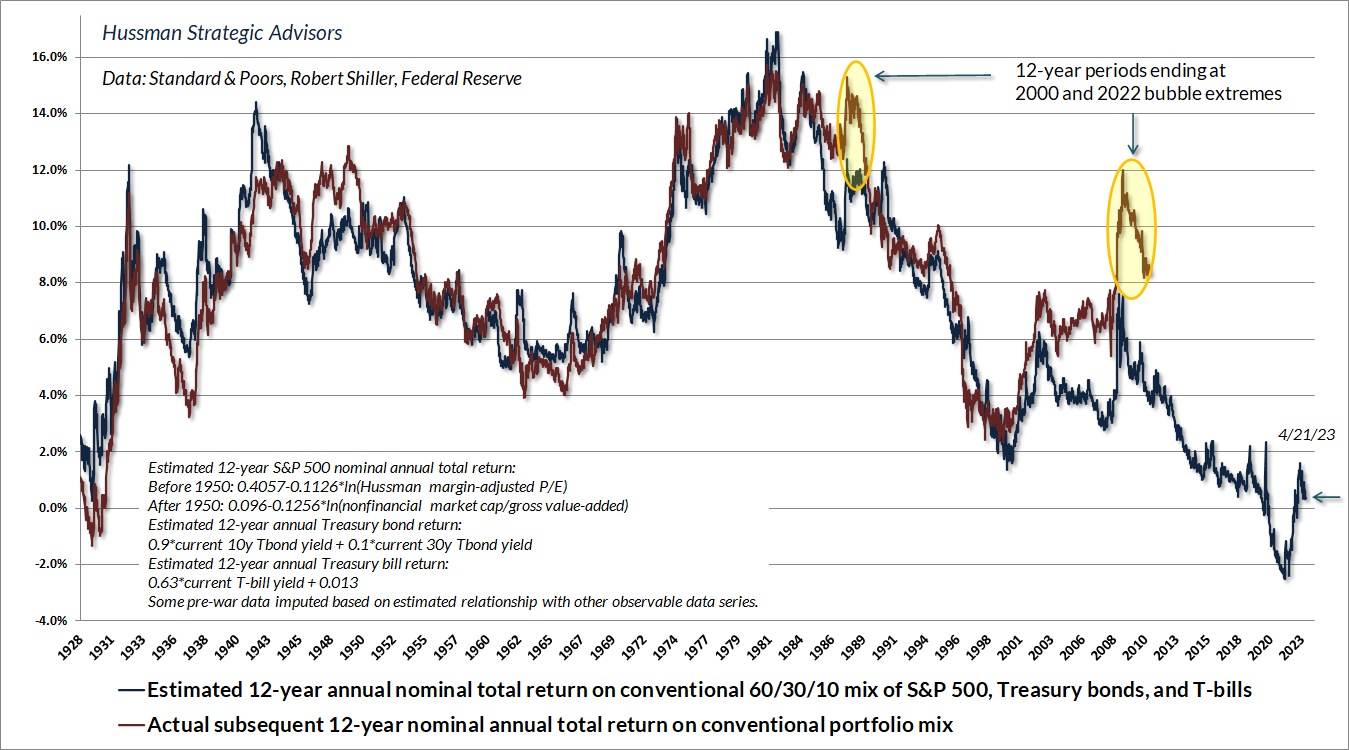
The chart below updates our estimate of likely 12-year average annual total returns for a conventional passive investment mix invested 60% in the S&P 500, 30% in Treasury bonds, and 10% in Treasury bills. Presently, that estimate is below 0.4% annually, but that will change. Upward spikes in expected returns, as we observed in 2000-2002, 2007-2009, and briefly in 2020, correspond to market losses. Presently, valuations remain as steep as they were in 1929, and beyond the extreme we observed in 2000.
Finally, sharing my latest Op-Ed, published today in the Financial Times: Too much Fed liquidity has led to a whack-a-mole world of problems. With gratitude to my always outstanding editor Tony Tassell.
Keep Me Informed
Please enter your email address to be notified of new content, including market commentary and special updates.
Thank you for your interest in the Hussman Funds.
100% Spam-free. No list sharing. No solicitations. Opt-out anytime with one click.
By submitting this form, you consent to receive news and commentary, at no cost, from Hussman Strategic Advisors, News & Commentary, Cincinnati OH, 45246. https://www.hussmanfunds.com. You can revoke your consent to receive emails at any time by clicking the unsubscribe link at the bottom of every email. Emails are serviced by Constant Contact.
The foregoing comments represent the general investment analysis and economic views of the Advisor, and are provided solely for the purpose of information, instruction and discourse.
Prospectuses for the Hussman Strategic Growth Fund, the Hussman Strategic Total Return Fund, the Hussman Strategic International Fund, and the Hussman Strategic Allocation Fund, as well as Fund reports and other information, are available by clicking “The Funds” menu button from any page of this website.
Estimates of prospective return and risk for equities, bonds, and other financial markets are forward-looking statements based the analysis and reasonable beliefs of Hussman Strategic Advisors. They are not a guarantee of future performance, and are not indicative of the prospective returns of any of the Hussman Funds. Actual returns may differ substantially from the estimates provided. Estimates of prospective long-term returns for the S&P 500 reflect our standard valuation methodology, focusing on the relationship between current market prices and earnings, dividends and other fundamentals, adjusted for variability over the economic cycle. Further details relating to MarketCap/GVA (the ratio of nonfinancial market capitalization to gross-value added, including estimated foreign revenues) and our Margin-Adjusted P/E (MAPE) can be found in the Market Comment Archive under the Knowledge Center tab of this website. MarketCap/GVA: Hussman 05/18/15. MAPE: Hussman 05/05/14, Hussman 09/04/17.