
Air Pockets, Free Falls, and More Cowbell

John P. Hussman, Ph.D.
President, Hussman Investment Trust
July 2023
There are certain features of valuation, investor psychology, and price behavior that emerge, to one degree or another, when the fear of missing out becomes particularly extreme and the focus of speculation becomes particularly narrow. We’ve suddenly hit a motherlode of those conditions. Emphatically, this is not a forecast. It’s a statement about current, observable conditions. Not a “limit.” Not a market call. Just sharing what we’re seeing. Still, it’s fair to add that we’ve never seen such a thing.
– John P. Hussman, Ph.D., Motherlode, November 20, 2021
There is a particular “setup” that we’ve historically found to be associated with abrupt “air pockets” and “free falls” in the S&P 500. It combines hostile conditions in all three features most central to our investment discipline: rich valuations, unfavorable market internals, and extreme overextension. The last time we observed this combination to a similar degree was in November 2021, shortly before the S&P 500 lost a quarter of its value. The S&P 500 remains lower than it was then. Despite enthusiasm about the market rebound since October, I remain convinced that this initial market loss will prove to be a small opening act in the collapse of the most extreme yield-seeking speculative bubble in U.S. history.
The present combination of historically rich valuations, unfavorable internals, and extreme overextension places our market return/risk estimates – near term, intermediate, full-cycle, and even 10-12 year, at the most negative extremes we define.
It’s difficult to discuss extremes like this without sounding like one is “calling a top,” so I’ll repeat what I emphasized in late-2021:
“Emphatically – and this is important – my intent here is not to ‘call the top’ of this bubble. Yes, this is a bubble in my view. Yes, I believe it will end in tears. Yes, the price investors pay for a given stream of future cash flows is inseparable from the long-term returns they can expect. Yes, if this bubble is ever to actually have a top, this would be a perfectly reasonable moment to expect one. Still, my present intent is simply to share what we’re observing.”
Let’s examine these three elements in turn – valuations, internals, and overextension.
Valuations – long-term returns, full-cycle risks
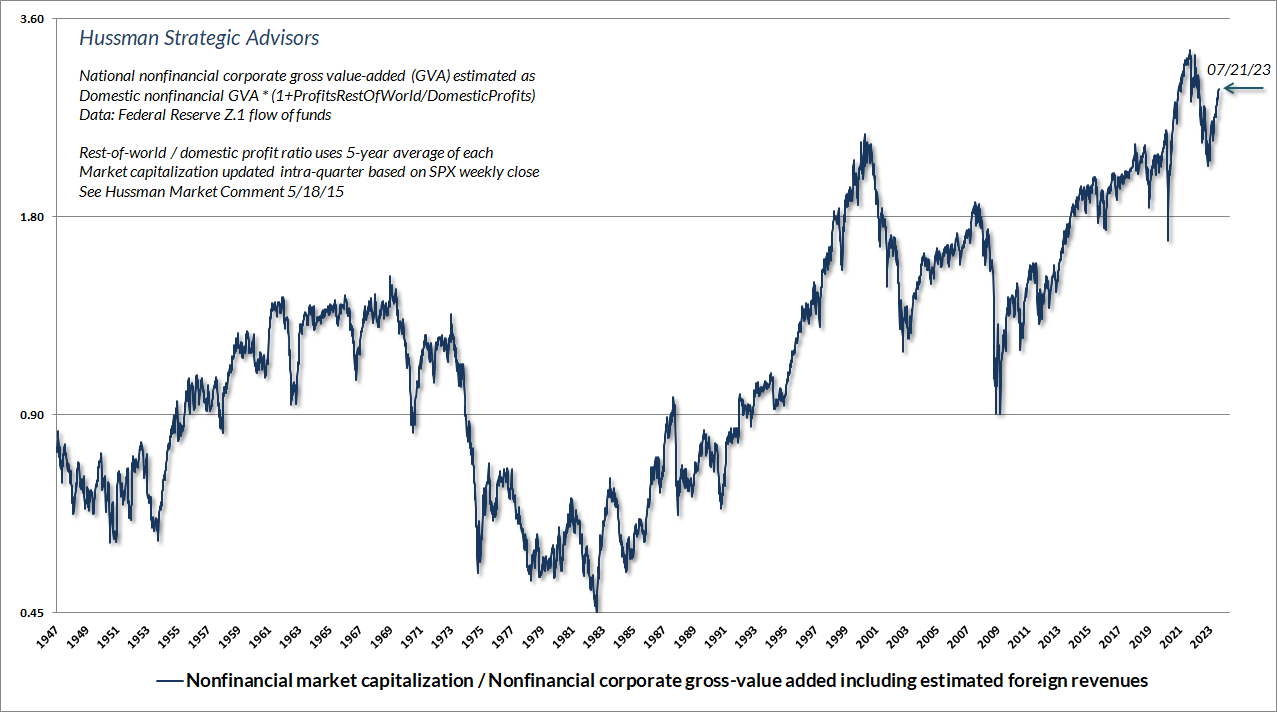
The chart below shows the valuation measure that we find best correlated with actual subsequent S&P 500 total returns in market cycles across history. MarketCap/GVA is the ratio of nonfinancial equity market capitalization divided by corporate gross-value added, including our estimate of foreign revenues. I introduced this measure back in 2015, and it essentially behaves as an economy-wide apples-to-apples, globally comprehensive price/revenue ratio for U.S. nonfinancial corporations.
At present, our best measures of valuation are more extreme than at any point in history prior to December 2020, with the exception of a few weeks surrounding the 1929 market peak. This is what Wall Street is calling a “new bull market.”
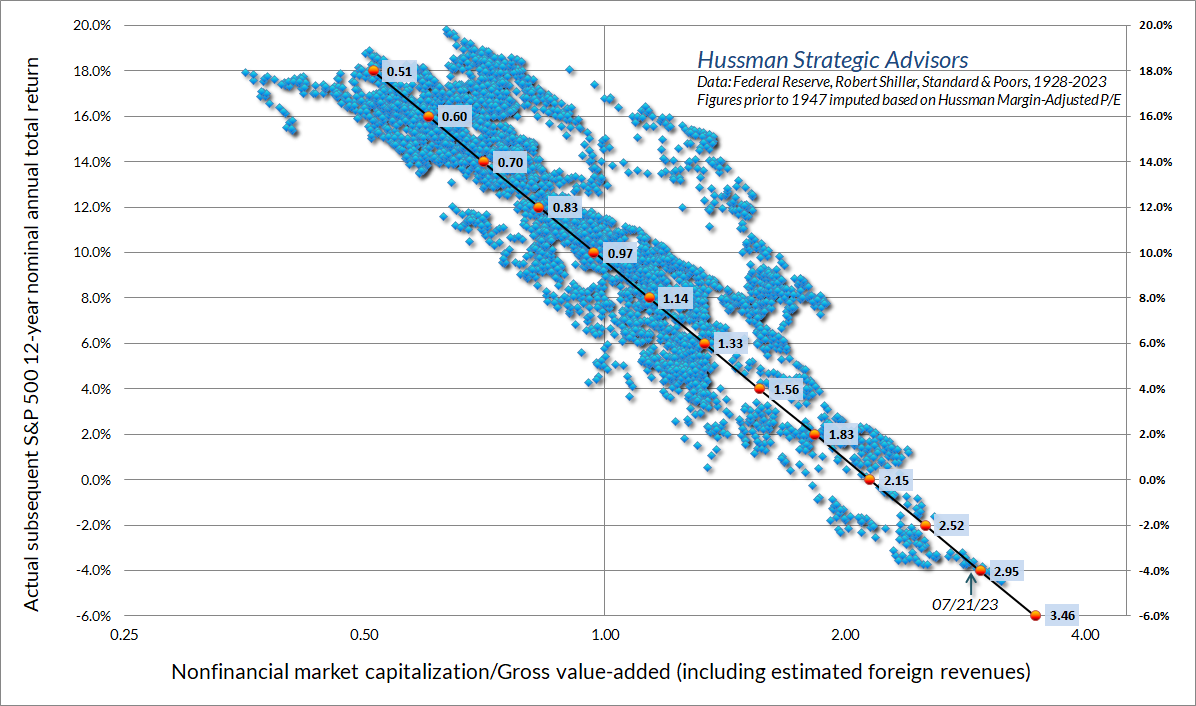
The chart below shows the relationship between MarketCap/GVA and actual subsequent 12-year average annual nominal total returns in data since 1928. The current level is over 2.8 times the level that we would associate with historically “run-of-the-mill” expected S&P 500 total returns of 10% annually. Emphatically, nothing in our investment discipline relies on the market to revisit its historical norms again (though it has regularly done so across history). It’s just that present valuation extremes suggest the likelihood of poor and quite possibly negative 12-year S&P 500 total returns, measured from current market levels.
As I detailed in The Structural Drivers of Investment Returns, basic arithmetic makes it very difficult to expect adequate S&P 500 total returns without also assuming permanently elevated valuations. Indeed, even the ability of the S&P 500 to hold its loss to less than 10% since late-2021 has relied on the restoration of historically extreme valuations.
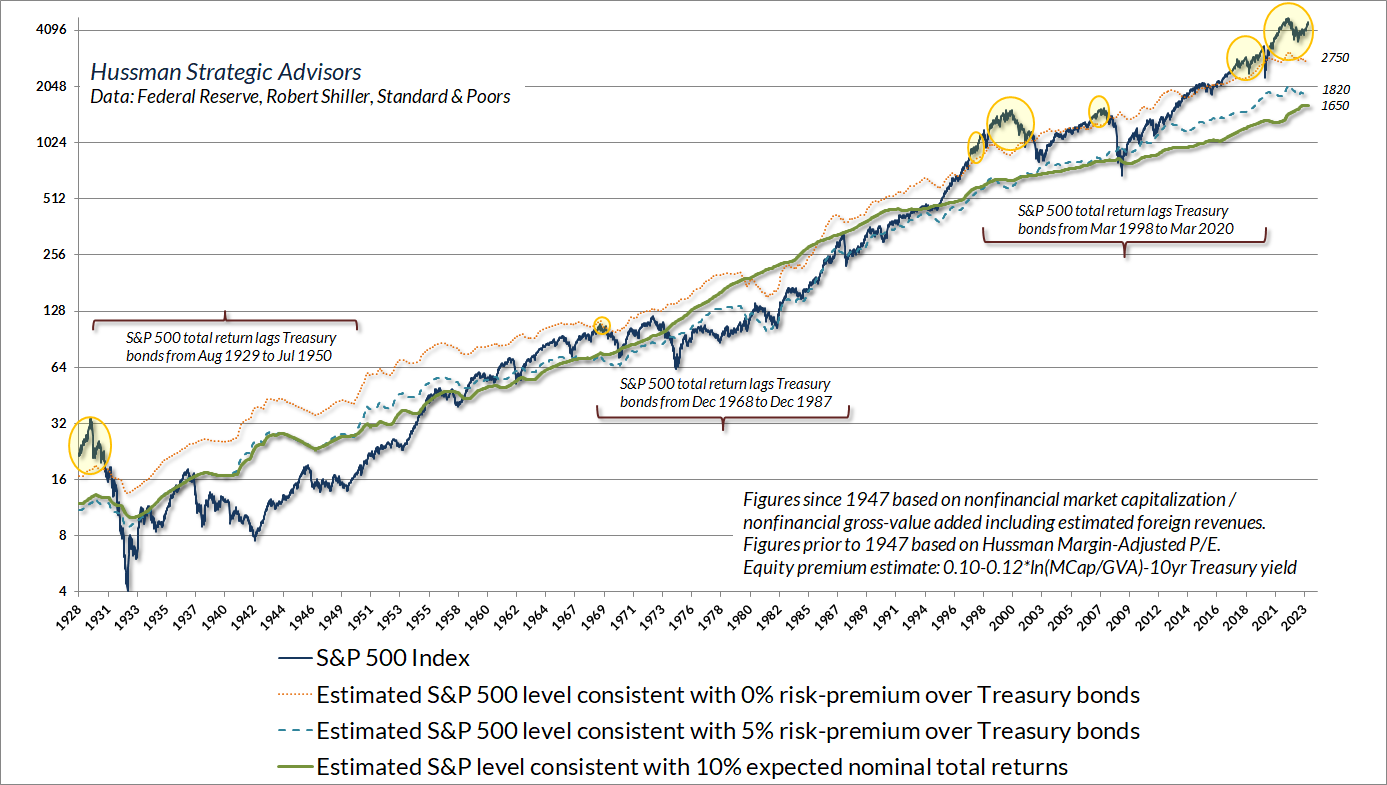
The chart below presents the same valuation information in the form of S&P 500 levels. The green line in the chart below is the level of the S&P 500 that we would associate with historically “run-of-the-mill” expected S&P 500 total returns of 10% annually. The blue dashed line shows the level of the S&P 500 that we would associate with a historically average 5% expected total return over-and-above prevailing 10-year Treasury bond yields. The orange dotted line shows the level of the S&P 500 that we would associate with a zero “risk-premium” over-and-above prevailing 10-year Treasury bond yields. The yellow bubbles show points where the S&P 500 was at valuations that implied a “negative risk premium” relative to bonds. I’ve also added several brackets showing that the S&P 500 did, in fact, lag bonds following these points, typically for about 20 years. I expect the current instance to be no different.
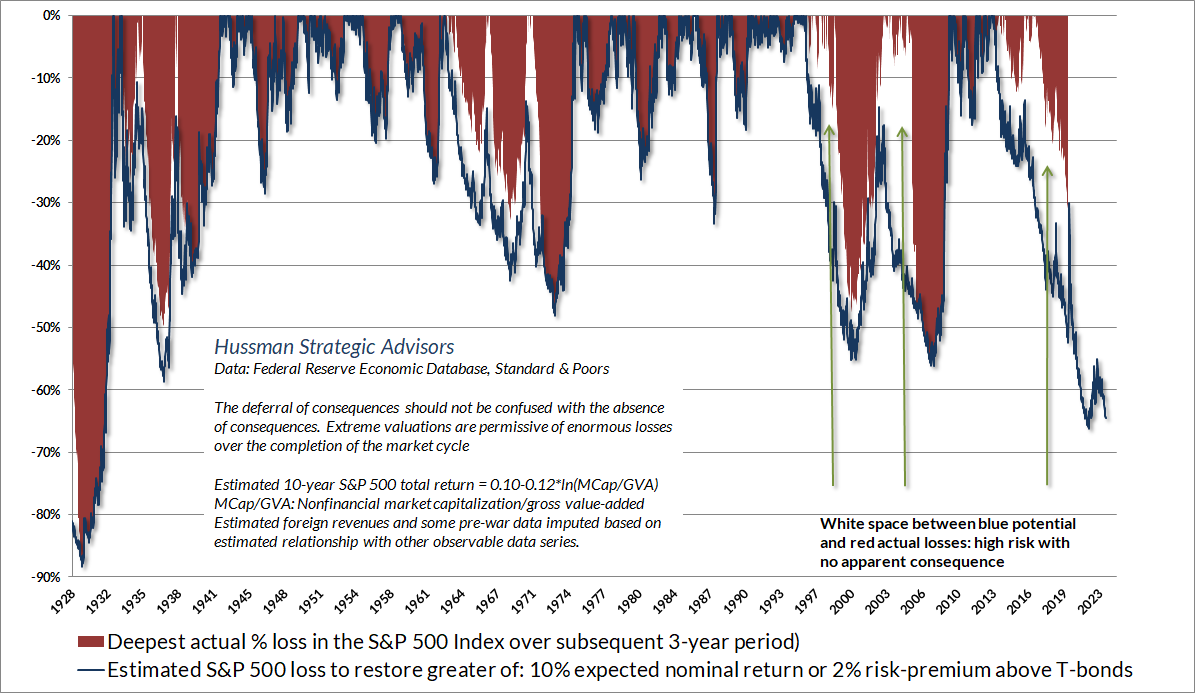
Reliable valuation measures provide information not only about likely long-term market returns, but also about the potential depth of market losses over the completion of a given market cycle. You’ll note that there’s enormous distance between the S&P 500 and the green 10% “run-of-the-mill” valuation norm. We’ve seen that before. Historically, durable market lows (not just interim declines like we observed last October) tend to restore expected S&P 500 total returns to the higher of a) their 10% run-of-the-mill norm, or b) 2% above prevailing Treasury yields. This isn’t a forecast, and there is often quite a bit of “white space” between rich valuations and subsequent market losses, but historically, the blue projected losses tend to eventually be filled with the red ink of actual market losses.
At present, the valuation extremes we observe imply that a -64% loss in the S&P 500 would be required to restore run-of-the-mill long-term prospective returns. I know. That sounds preposterous. Then again, as the chart below suggests, I’ve become used to making seemingly preposterous risk estimates at bubble peaks, having correctly anticipated the depth of the 2000-2002 and 2007-2009 collapses, as well as projecting an 83% loss in technology stocks in March 2000 (the Nasdaq 100 went on to lose an implausibly precise 83%).
As I noted in Grasping at the Suds of Yesterday’s Bubble, the entire historical total return of Treasury bonds, in excess of T-bill returns, has accrued in periods when the 10-year Treasury bond yield exceeded T-bill yields. A more useful “benchmark” is the weighted average of Treasury bill yields (0.5), nominal GDP growth (0.25) and core CPI inflation (0.25). Presently, that weighted average is: 0.5*5.4% + 0.25*7.2% + 0.25*4.9% = 5.7% which is clearly above the current 10-year Treasury bond yield of 3.8%. In my view, even a 2% drop in T-bill yields, nominal GDP growth, and core inflation would still leave prevailing 10-year Treasury bond yields only marginally competitive with T-bills. In effect, bond yields already anticipate a weaker economy, Fed easing, and success on inflation. That may prove to be true. It’s just that it’s already priced in.
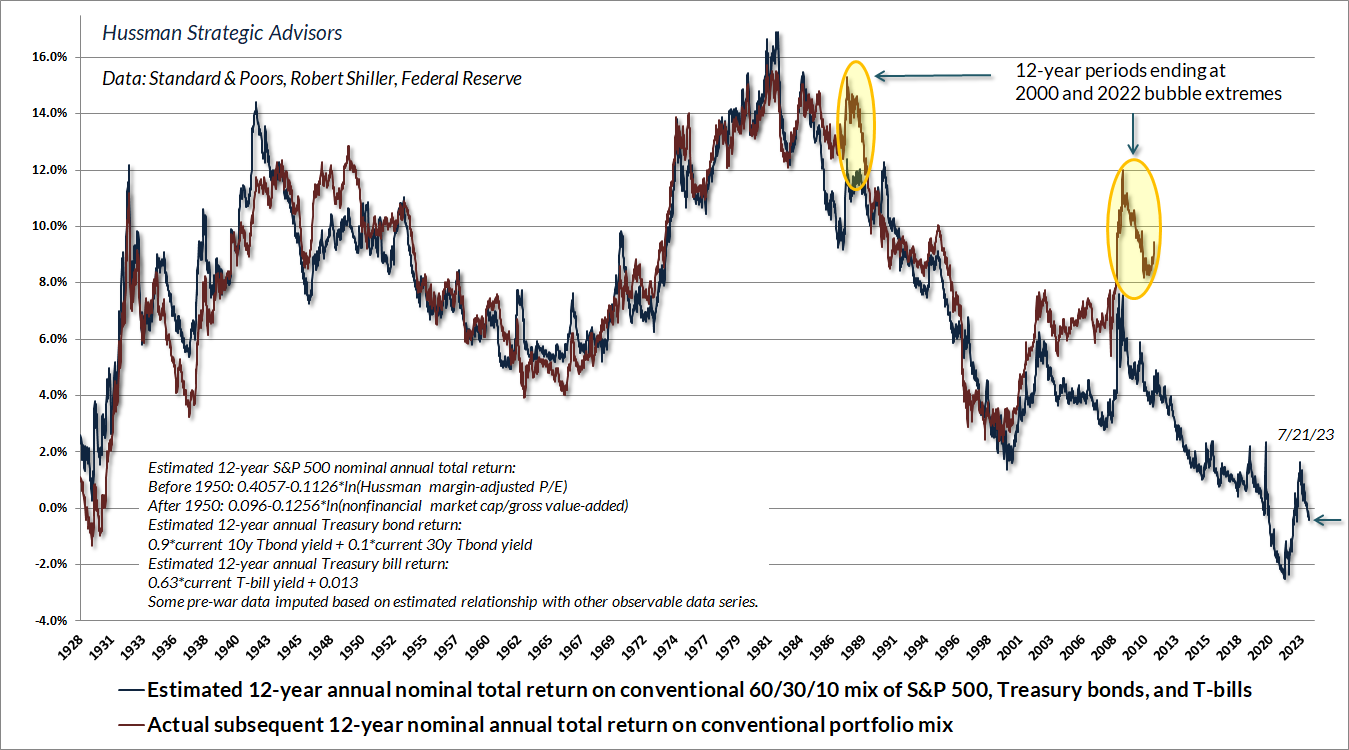
The chart below shows our estimate of likely 12-year average annual nominal total returns for a conventional “passive” portfolio allocation invested 60% in the S&P 500, 30% in Treasury bonds, and 10% in Treasury bills. The red line shows actual subsequent 12-year total returns for this allocation.
At present, our estimate of 12-year returns for a conventional passive portfolio stands at -0.4%, below the estimate based on data from the 1929 market peak, and indeed, below every estimate in history prior to July 2020. For more than a decade, zero interest rate policy encouraged investors to drive securities to valuation extremes that now imply more than a decade of zero long-term returns as well. Now comes the hard part.
Market internals – speculation versus risk-aversion
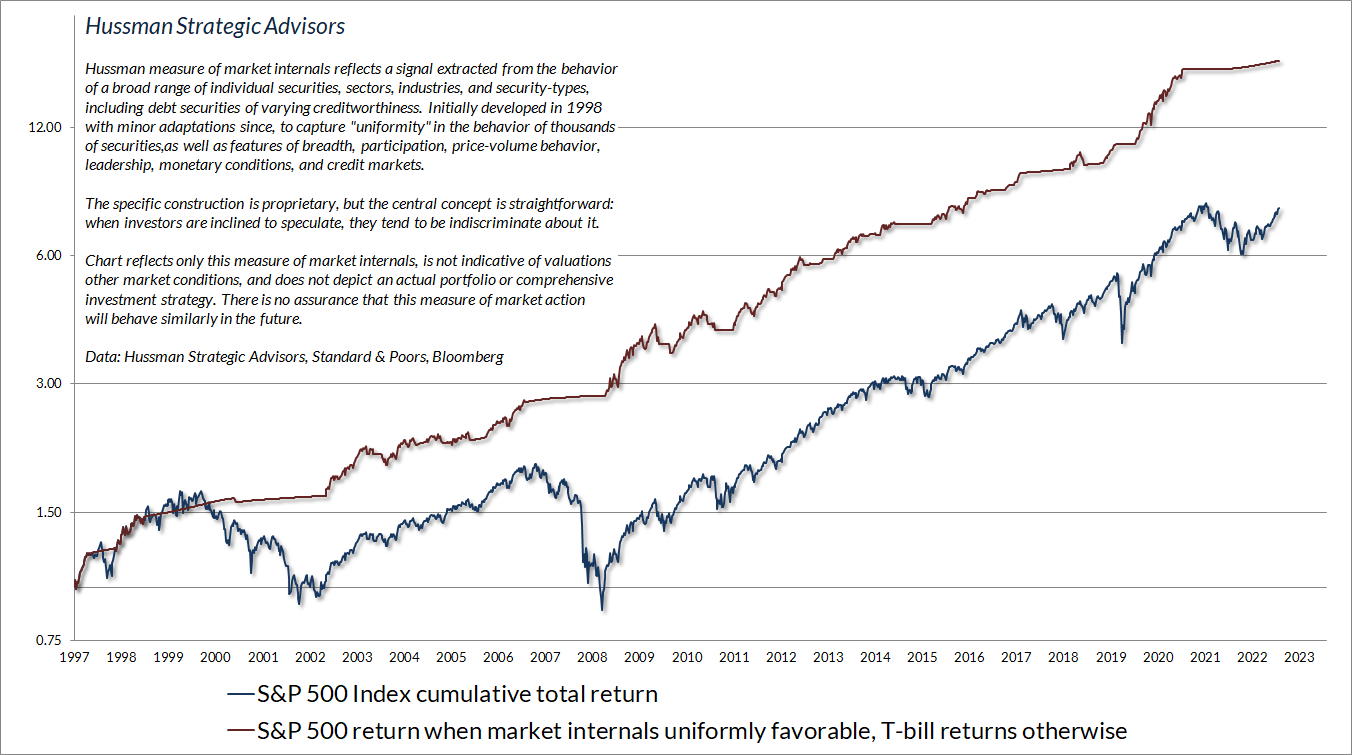
Depending on market conditions, stocks can have ‘investment merit,’ ‘speculative merit,’ both, or neither. In our own discipline, we gauge ‘investment merit’ by valuation – the relationship between the price of a security and the long-term stream of expected cash flows that we expect that security to deliver over time. We gauge ‘speculative merit’ based on the uniformity or divergence of market internals. When investors are inclined to speculate, they tend to be indiscriminate about it. Since 1998, our most reliable gauge of speculation versus risk-aversion has been based on the signal we extract from the market action of thousands of individual securities, industries, sectors, and security-types, including debt securities of varying creditworthiness.
– John P. Hussman, Ph.D., Return-Free Risk, January 14, 2022
Investors often assume that extreme valuations imply that stock prices should fall, and that if stock prices don’t fall, the valuation measures must be incorrect. That’s not how valuations work. Valuations are informative about long-term returns and the extent of potential losses over the complete market cycle. Emphatically, however, valuations have very little to say about market direction over shorter segments of the market cycle. Think about it. If rich valuations were sufficient to drive stock prices lower, it would be impossible for stocks to reach valuations like we observed in 1929, or 2000, or early 2022, or today. The only way we got here – the only way we could have got here – was for stock prices to continue to advance through every lesser extreme.
Find any period in history where fundamentals grew and market valuations increased, and you’ll also find that total returns were high during that period, regardless of how rich starting valuations might have been. It’s just arithmetic. Likewise, find any period in history where market returns were materially higher than they “should” have been, given the level starting valuations, and you’ll almost always find that the period ended at extreme valuations. 1929, 2000, early 2022, and today are among the best examples.
So, in addition to valuations, which inform us about long-term returns and full-cycle risks, we consider the uniformity or divergence of market internals, to infer whether investors are inclined toward speculation or toward risk-aversion. The chart below presents the cumulative total return of the S&P 500 in periods where our main gauge of market internals has been favorable, accruing Treasury bill interest otherwise. The chart is historical, does not represent any investment portfolio, does not reflect valuations or other features of our investment approach, and is not an assurance of future outcomes.
Adapting to experimental monetary policy
In previous market cycles across history, there were “limits” to speculation that could be identified based on various syndromes of “overvalued, overbought, overbullish” conditions. There is a single reason for the “permabear” reputation I acquired in the recent bubble: zero interest rates encouraged speculation beyond previously reliable “limits” – during periods of favorable market internals. The proper response was to abandon our bearish response to these “limits” – during periods of favorable market internals. We made that adaptation to our investment discipline in late-2017.
Still, avoiding a bearish outlook when market internals are favorable is not the same as adopting a constructive outlook during those periods. In late-2021 we extended our ability to respond constructively to favorable internals even when valuations are extreme. That was a difficult decision for value-conscious investors like us, but the adaptation includes sufficient position limits and safety nets to align with what Benjamin Graham might describe as “intelligent speculation.” There are still conditions that encourage a neutral stance despite favorable internals, but those are in the minority.
These adaptations have several consequences:
- They preserve the elements of our discipline that enabled us to admirably navigate decades of complete market cycles prior to the Fed’s foray into quantitative easing and zero-interest rate policies. Nobody would even know my name if not for the repeated successes that preceded this yield-seeking bubble;
- They lean our discipline toward a constructive outlook during periods of favorable internals, regardless of valuations – though with position limits and safety nets – which will be important should the Federal Reserve resume zero-interest rate policies in the future;
- They restore our strategic flexibility – even in the unlikely scenario that valuations remain permanently elevated and never approach their historical norms again;
- They preserve our ability to defend against collapses in conditions that have historically presented that risk. Once the combination of rich valuations and unfavorable internals opens up a “trap door,” every element of our discipline – including overextended conditions – can suddenly have powerful implications.
Overextended conditions – the risks of “more cowbell”
Our investment discipline doesn’t rest on forecasts, or projections, or market calls. Valuations certainly inform our view about long-term returns, and market internals certainly inform our view about investor psychology, but our focus is on measures we can objectively gauge in the present. Our discipline is to align our investment outlook with prevailing market conditions – most importantly, the combination of observable valuations and observable market internals, reflecting the behavior of thousands of stocks, industries, sectors, and security types, including debt securities of varying creditworthiness.
Provided that market internals are deteriorating or divergent, various syndromes of overextension, such as ‘overvalued, overbought, overbullish’ conditions, can also be enormously useful. Our key adaptation in recent years was adding that “Provided” phrase. In other cycles across history, that phrase wasn’t necessary. Once the market became sufficiently overextended, it would croak on its own accord.
We’ve adapted in recent years by prioritizing the condition of market internals ahead of those overextended “limits.” Even if this bubble never ends, I expect we’ll be fine – though I would expect to concentrate our risk-taking during periods that market internals are uniformly favorable. The problem, at present, is that despite speculative highs in the S&P 500 and Nasdaq indices, our gauges of internals reflect persistent divergence here. The preponderance of warning flags we observe here are occurring in the context of the most extreme valuations in history, coupled with market internals that are already divergent.
– John P. Hussman, Ph.D., Motherlode, November 20, 2021
There are very few conditions in which we have any specific expectations for near-term market action. The exceptions are when the market is strenuously overextended in a “trap door” situation combining rich valuations with unfavorable internals, or when the market is strenuously compressed following a material improvement in valuations.
Over the past four decades, I’ve developed scores of interesting “syndromes” and relationships, many that I’ve discussed in these market comments. A subset of these capture features of “overextension” and “compression” that occur at major market extremes.
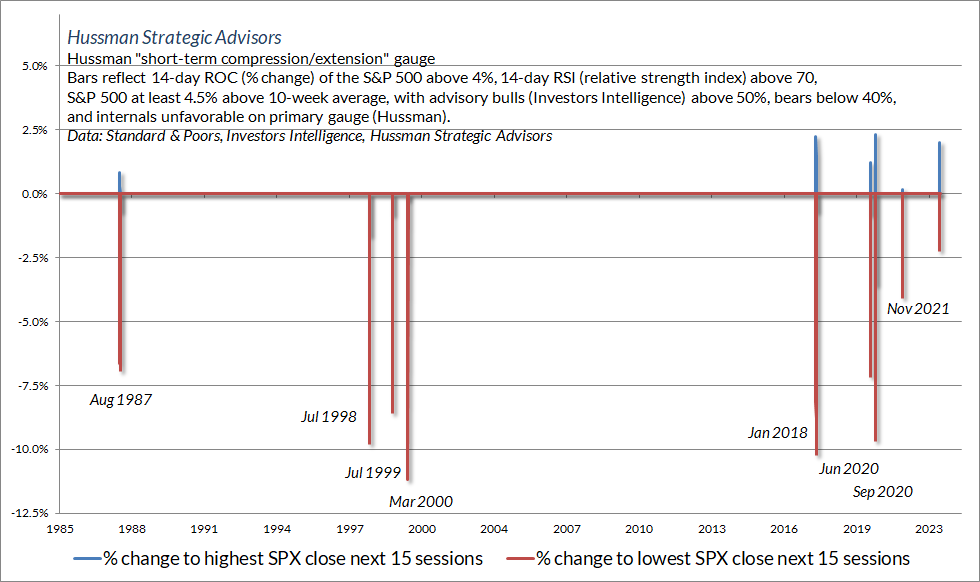
The chart below shows one such syndrome that emerged in mid-April as the S&P 500 advanced above 4400, and again last week, which I consider part of the same overextended advance. The criteria are intended to capture a certain “relentlessness” of speculation that often precedes abrupt market losses. This particular syndrome is among several that I monitor to identify speculative “blowoffs.”
In this case, “relentlessness” is defined by periods when the S&P 500 is at least 4.5% above its 50-day average, with a relative strength index (RSI) above 70 – indicating a preponderance of advancing days relative to declining days in recent weeks, a 14-day rate of change (ROC) greater than 4% in the S&P 500, and at least a mildly bullish tilt in advisory sentiment, based on Investors Intelligence data. Periods like this look briefly parabolic, as investors increasingly buy every dip, in fear of missing out.
I got a fever – and the only prescription – is more cowbell.
– Christopher Walken, More Cowbell, Saturday Night Live
The criteria also include unfavorable market internals, which addresses the single thing that was truly “different” about zero-interest rate policy: the psychological discomfort of zero interest rates encouraged investors to speculate beyond any previously reliable historical “limit.” As long as market internals were favorable, one had to suspend a bearish outlook, at least temporarily. In contrast, deterioration or divergence in market internals creates a trap door, and both overvaluation and overextended conditions can suddenly matter with a vengeance.
The bars show the largest advance and deepest decline in the S&P 500 over the 15 trading days following each instance. Not a forecast – just a regularity.
The criteria in the chart below require a slightly less extreme level of overextension – though we’re beyond those at present – and measures outcomes over the 40 trading days that follow. Across history, and even since the onset of quantitative easing in 2008, the combination of unfavorable market internals and extreme overextension tends to be resolved by a steep and abrupt market decline that can be described as an “air pocket” or “free fall.” If you’ve studied market cycles across history, several of these dates should stand out: 1973, 1987, 1998, 2000, 2007, 2021.
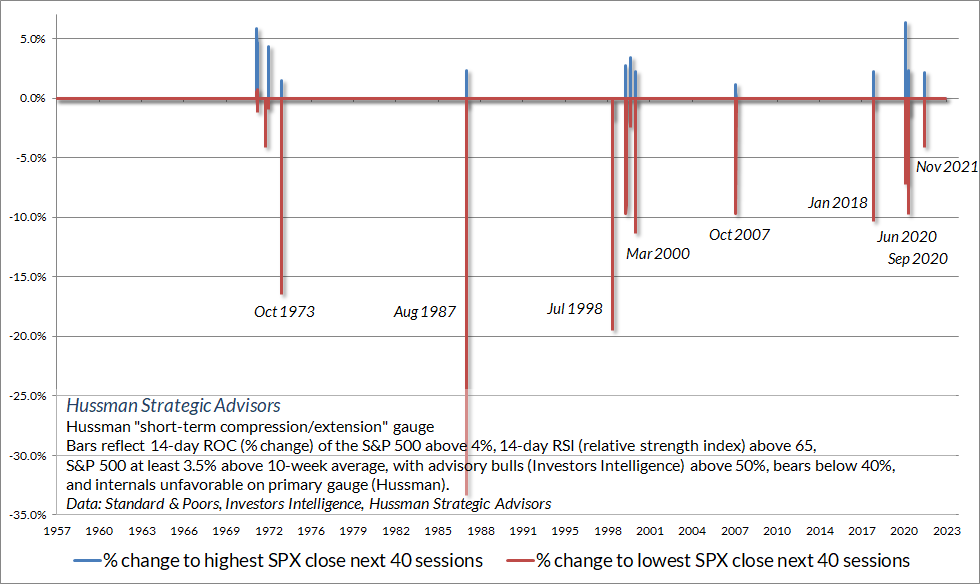
Notice that the market losses that resolve extreme overextension are not just short-term events. Combinations of rich valuations, unfavorable internals, and extreme overextension like these often occur at or near important cyclical market peaks. The potential for a near-term “air pocket” or “free fall” isn’t a forecast so much as a regularity that should not be ruled out. Likewise, with valuations again higher than at any point in history prior to December 2020, with the exception of several weeks surrounding the 1929 peak, the potential for a much steeper follow-through should be taken seriously. Even passive investors should examine their exposures carefully, and rebalance their portfolios to reflect their actual level of risk tolerance.
Seriousness is flagged by the language that you use. I’ve always tried to make a big difference, but the difference is often wasted because people don’t remember what you sounded like when you were serious. The difference I’m trying to make is just the routine ‘the market is expensive,’ and the significant. The significant is three bubbles. This is serious.
– Jeremy Grantham, GMO, Livewire Markets Interview, May 2021
You’ll notice that none of the foregoing discussion is focused on recession probabilities, employment, inflation, or earnings expectations. The reason is that the consequences of steep overvaluation, unfavorable internals, and extreme overextension seem to be largely indifferent to these considerations. There’s often no identifiable “catalyst” associated with various market peaks, air pockets, and free-falls. Catalysts tend to emerge later, if at all. To some extent, the initial losses are more behavioral than economic – extreme overextension simply tends to become exhausted, followed by concerted attempts by speculators to exit at still-elevated levels.
How little, it will perhaps be agreed, was either original or otherwise remarkable about this history. Prices driven up on the expectation that they would go up, the expectation realized by the resulting purchases. Then the inevitable reversal of these expectations because of some seemingly damaging event or development or perhaps merely because the supply of intellectually vulnerable buyers was exhausted. Whatever the reason (and it is unimportant), the absolute certainty is that this world ends not with a whimper but with a bang.
And so on to the moment of mass disillusion and the crash. This last, it will now be sufficiently evident, never comes gently. It is always accompanied by a desperate and largely unsuccessful effort to get out. The least important questions are the ones most emphasized. What triggered the crash?
This is not very important, for it is in the nature of a speculative boom that almost anything can collapse it. Any serious shock to confidence can cause sales by those speculators who have always hoped to get out before the final collapse, but after all possible gains from rising prices have been reaped. Their pessimism will infect those simpler souls who had thought the market might go up forever but who now will change their minds and sell.
– John Kenneth Galbraith on the 1929 collapse
Keep Me Informed
Please enter your email address to be notified of new content, including market commentary and special updates.
Thank you for your interest in the Hussman Funds.
100% Spam-free. No list sharing. No solicitations. Opt-out anytime with one click.
By submitting this form, you consent to receive news and commentary, at no cost, from Hussman Strategic Advisors, News & Commentary, Cincinnati OH, 45246. https://www.hussmanfunds.com. You can revoke your consent to receive emails at any time by clicking the unsubscribe link at the bottom of every email. Emails are serviced by Constant Contact.
The foregoing comments represent the general investment analysis and economic views of the Advisor, and are provided solely for the purpose of information, instruction and discourse.
Prospectuses for the Hussman Strategic Growth Fund, the Hussman Strategic Total Return Fund, the Hussman Strategic International Fund, and the Hussman Strategic Allocation Fund, as well as Fund reports and other information, are available by clicking “The Funds” menu button from any page of this website.
Estimates of prospective return and risk for equities, bonds, and other financial markets are forward-looking statements based the analysis and reasonable beliefs of Hussman Strategic Advisors. They are not a guarantee of future performance, and are not indicative of the prospective returns of any of the Hussman Funds. Actual returns may differ substantially from the estimates provided. Estimates of prospective long-term returns for the S&P 500 reflect our standard valuation methodology, focusing on the relationship between current market prices and earnings, dividends and other fundamentals, adjusted for variability over the economic cycle. Further details relating to MarketCap/GVA (the ratio of nonfinancial market capitalization to gross-value added, including estimated foreign revenues) and our Margin-Adjusted P/E (MAPE) can be found in the Market Comment Archive under the Knowledge Center tab of this website. MarketCap/GVA: Hussman 05/18/15. MAPE: Hussman 05/05/14, Hussman 09/04/17.

