

The Secret Life of Fed Pivots


John P. Hussman, Ph.D.
President, Hussman Investment Trust
December 2023
Speculative bubbles collapse. I don’t know how to make that point simpler, but somehow it needs to be said. Still, attention to investor psychology – speculation versus risk-aversion – can help enormously. A market crash is nothing more than low risk-premium meeting risk-aversion. Indeed, when investors become risk-averse, they treat safe liquidity as a desirable asset rather than an inferior one, so creating more of the stuff does nothing to support stocks. That’s how the market could collapse in 2000-2002 and 2007-2009 despite aggressive and persistent Fed easing.
Pure speculative psychology is the only thing standing between a hypervalued market that continues to advance and a hypervalued market that drops like a rock. Our best gauge of that psychology – the uniformity of market internals – remains divergent enough to keep market conditions in a trap-door situation.
When investors are inclined to speculate, they tend to be indiscriminate about it, so we gauge that psychology based on the uniformity or divergence of market internals across thousands of stocks, industries, sectors, and security types, including debt securities of varying creditworthiness.
Since late-2017, we’ve refrained from adopting or amplifying a bearish outlook when we observe that uniformity. We’ve also become open to moderately constructive stances – though still with safety nets and tail-risk hedges – regardless of the level valuations, provided that market internals indicate that investors have the speculative bit in their teeth. All of this is what Ben Graham might have described as ‘intelligent speculation, kept within minor limits.’
At present, our measures of market internals remain sufficiently divergent to hold us to a strongly defensive stance. Indeed, the main headwind for hedged equity strategies in recent weeks has been the divergence between the broad market and capitalization-weighted indices dominated by overvalued large-cap glamour stocks. I expect that this bubble will end terribly, and the damage will take more than a decade to undo.
I know that many of you believe that the current episode of speculative enthusiasm will persist forever –that the Fed will make it persist. We’ve already established that market returns are likely to be flat or poor even if the market achieves what Irving Fisher disastrously projected as a ‘permanently high plateau’ in 1929, and valuations remain forever above extremes never seen before last year. Investors should also consider what might happen if valuations merely touch their historical norms – even 20 years from today – and growth in fundamentals matches that of the past 20 years. The simple arithmetic implies that the S&P 500 would actually lose value on a total return basis.”
– John P. Hussman, Ph.D., November 8, 2021, When Bubble Meets Trouble
More than two years have passed since these comments were published in 2021, and aside from a great deal of interim volatility, strikingly little has changed. It’s worth noting that despite the recent market advance, our own investment discipline, and even Treasury bills, have outpaced the S&P 500 and Nasdaq 100 during this period, with less volatility.
In my view, the downside resolution of the recent bubble remains in its early stages, and the advance that we’ve observed, particularly in recent weeks, reflects a nearly frantic expression of pent-up “fear of missing out” on a Fed pivot that investors hope will extend the bubble.
As I noted two years ago, nothing in our discipline requires valuations to return to their historical norms. Nor does anything in our discipline rule out a resumption of speculative psychology. A shift to uniformly favorable market internals would encourage us to adopt a neutral or moderately constructive outlook, regardless of valuations – though certainly with safety nets and tail-risk hedges.
Presently, valuations are just shy of the most extreme levels in history, and would easily be the richest valuations at which a potential “Fed pivot” has ever occurred. Our key gauge of market internals remains unfavorable, a fact that, as we’ll see, has typically taken precedence over weaker “trend following” measures such as moving averages. Meanwhile, bond yields are back to levels that we view as inadequate, and that now rely on continued disinflation at a pace that we believe is unsupported by the data. On the positive side, conditions for precious metals shares have improved further, and investors continue to enjoy risk-free rates near 5.4%, providing a great deal of optionality in the face of current uncertainties.
A few charts will update the current condition of the financial markets, from the standpoint of our value-conscious, historically-informed, full-cycle investment discipline.
The chart below shows our most reliable valuation measure, based on its correlation with actual subsequent S&P 500 total returns in market cycles across history. MarketCap/GVA reflects the ratio of nonfinancial market capitalization to corporate gross value-added, including estimated foreign revenues. The current level exceeds both the 1929 and 2000 market extremes, and indeed every level of market valuation observed in U.S. history prior to January 2021.
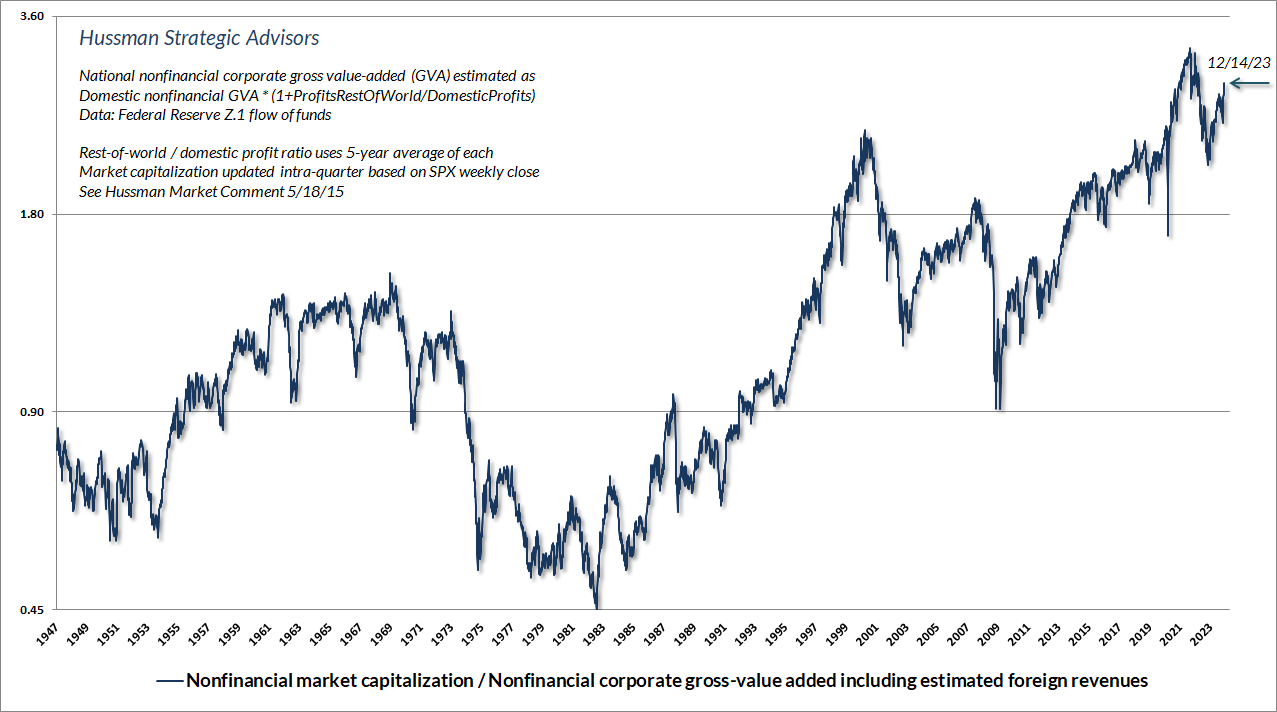
On this point, it’s useful to observe that if the Federal Reserve does indeed “pivot” to rate cuts in the coming months, it would occur at the most extreme valuation of any Fed pivot in history. The chart below shows each such “pivot” in data since the 1950’s, where a pivot is defined as the initial rate cut following at least one increase in the Federal Funds rate. Since Fed policy was historically conducted by setting money supply targets and allowing interest rates to vary, rather than setting explicit rate targets, a rate change is defined as a shift in the effective Fed funds rate in excess of 0.2%. Below, each pivot is plotted on three dimensions: the level of MarketCap/GVA at the time of the pivot, the subsequent 12-month total return of the S&P 500, and the deepest loss in the S&P 500 over the subsequent 30-month period.
The yearning affection that investors hold for Fed pivots is quietly driven by the fact that nearly all the pivots occurred when the S&P 500 already stood at historically normal or depressed levels of valuation. The associated market returns were typically a function of two factors: favorable valuations, coupled with an improvement in market internals. It’s those factors – the central elements of our investment discipline – that actually correlate with favorable market outcomes. In contrast, the horrible market outcomes following the 1973, 2007 and 2001 pivots were associated with the combination of elevated or extreme valuations without a sustained improvement in internals. The “intermediate” case was 2019, when the market responded well despite steep valuations, because market internals had measurably improved.
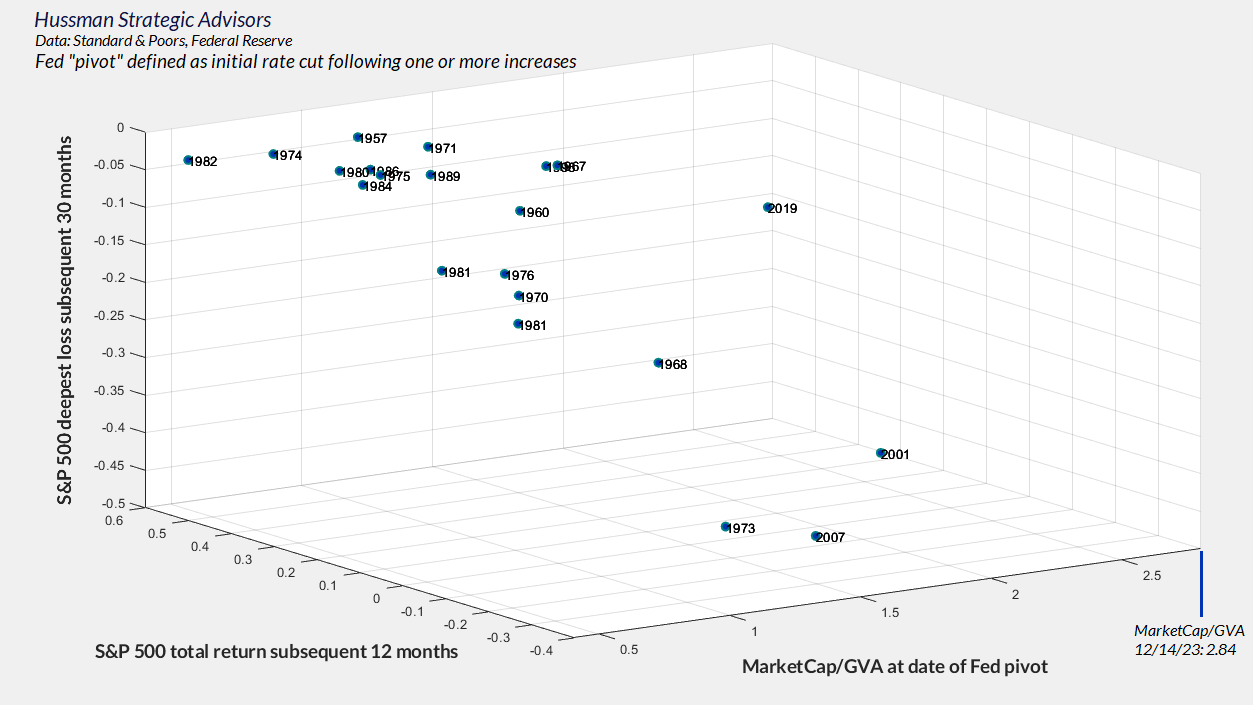
Notice the cluster of happy outcomes to the upper left. Outstanding 12-month returns, shallow 30-month drawdowns. Why? Nearly all of those “happy” pivots occurred with the ratio of MarketCap/GVA below 1.20. Compare that with the current multiple, at 2.84. Favorable valuation is one of the secrets of a happy Fed pivot. Likewise, across history and even during the Federal Reserve’s deranged monetary experiment since 2008, Fed easing has been beneficial for stocks only when market internals have been uniformly favorable. For a historical chart and further discussion, see the section titled “Gauging the state of the system” in October’s comment.
Quantitative easing (QE) and zero interest rate policy (ZIRP) certainly provoked speculation beyond historically reliable “limits,” but it did not change this fact: easy money does nothing for stocks unless investors treat safe liquidity as an “inferior” asset instead of a desirable one. During the 2000-2002 collapse, the S&P 500 lost half its value, the Nasdaq 100 lost more than 80%, and the Fed eased aggressively and persistently the whole way down. The same was true of the 55% collapse of the S&P 500 during the global financial crisis of 2007-2009.
A market collapse is nothing but risk-aversion meeting a market that’s not priced for risk. Monetary easing is helpful only when investors are inclined to speculate, or when valuations are low enough to support adequate long-term returns and sustained expansion in multiples.
As noted in the 2021 quote that opens this comment, we adapted our investment discipline years ago, becoming content to gauge valuations and market internals without imposing previously reliable “limits” to speculation. Yes, emphatically, this time was different. But the only thing that made this time “different” in the face of QE and ZIRP was that speculative limits became unreliable, provided investors were inclined to speculate (which we infer from internals).
It’s worth noting that the entire total return of the S&P 500 since late-2008 has accrued in periods when our gauge of market internals has been favorable. That doesn’t mean the market can’t advance when internals are unfavorable – it just means that the market tends to surrender those gains. It’s equally worth noting that periods of extreme valuations have invariably been followed by steep full-cycle losses and very long, interesting trips to nowhere. We’ve abandoned our reliance on speculative limits, but the combination of valuations and market internals remains central to our discipline. When neither is favorable, a “trap door” opens. That combination doesn’t require a market collapse, but it does permit one, because it brings risk-aversion into a market that’s not priced for risk. As I wrote at the 2000 bubble peak, “This is a lesson best learned before a crash rather than after one.”
Bond yields and benchmarks
In my view, the expectations for coming rate cuts rely heavily on the expectation that core inflation will continue to retreat without interruption. That may turn out to be true, but by our estimates, the markets have more than priced in that outcome already.
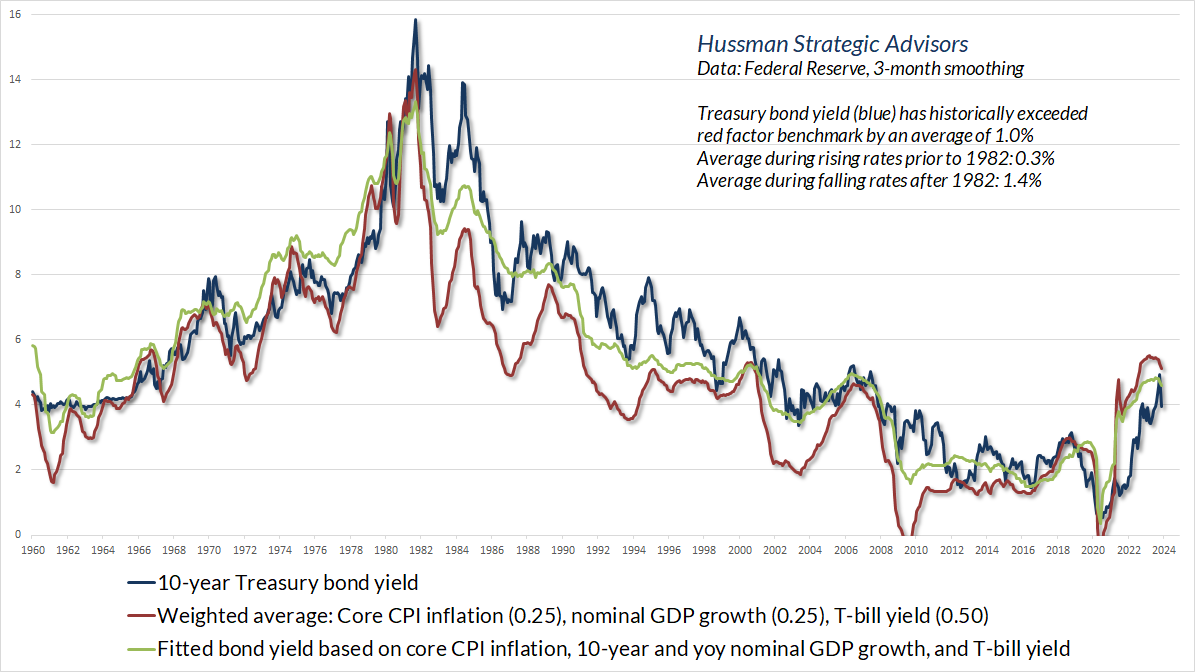
Consider the 10-year Treasury yield. Historically, the entire total return of Treasury bonds, over-and-above Treasury bill returns, has accrued when the 10-year Treasury yield has exceeded the weighted average of core CPI inflation (0.25), nominal GDP growth (0.25), and the 3-month T-bill yield (0.5). The chart below shows the yield of the 10-year Treasury bond compared with this and a slightly broader benchmark. When bond yields have been below one or both of these benchmarks, bonds have lagged T-bills, on average. At present, the yield has dropped back to levels that I’d characterize as acceptable but moderately inadequate. The recent decline in bond yields has already priced a further retreat of over 1% in core inflation, nominal GDP growth, and short-term interest rates. While we may in fact see that improvement, the bond market, in my view, already relies on it.
The same is true for expectations regarding the Federal funds rate. By our estimates, the broad data are consistent with a relatively unchanged Fed funds rate in the coming year, in contrast to expectations of multiple rate cuts. There’s enough uncertainty in the economic outlook that we wouldn’t rule out Fed easing, particularly in response to emerging recession. Still, our baseline expectation is more muted than the enthusiasm we observe across Wall Street.
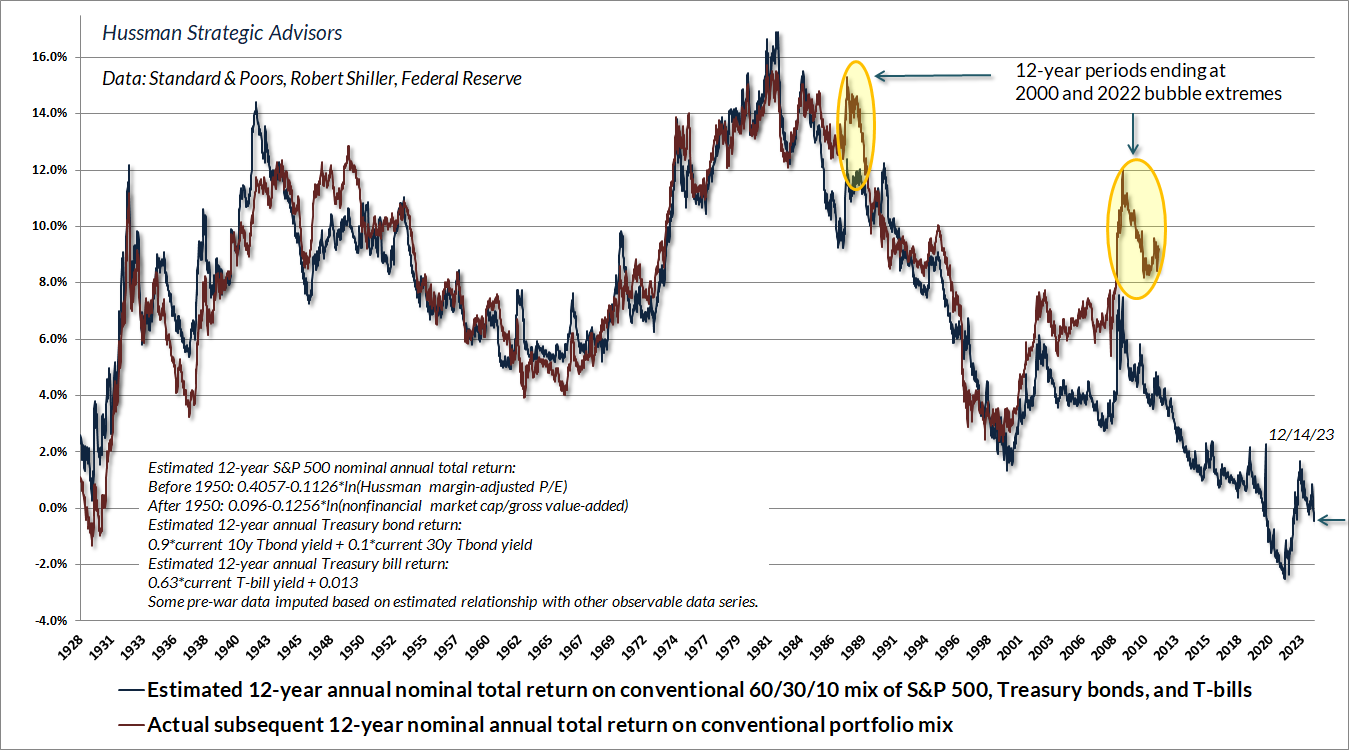
Reflecting a combination of steep equity market valuations and inadequate bond yields, we currently estimate negative prospective 12-year total returns for a conventional passive portfolio mix invested 60% in the S&P 500, 30% in Treasury bonds, and 10% in Treasury bills. As usual, investment outcomes over shorter segments of the market cycle will largely depend on the uniformity or divergence of market internals, but from present valuations, investors should not be surprised if conventional, passive investment portfolios continue on a long, interesting trip to nowhere.
Arithmetic is the adversary of rich valuations
As I detailed in The Structural Drivers of Investment Returns, once we know the starting valuation of the market and dividend yield of the S&P 500, the arithmetic of returns dictates that there are really only two factors that will determine future investment returns: a) the growth rate g of whatever fundamental we’ve chosen, and b) the valuation multiple V at the end of our investment horizon T. That’s true for any fundamental we choose. It’s just arithmetic.
Average annual total return = (1+g) x (V_future / V_today)^(1/T) – 1 + average dividend yield
The more predictability there is around those two factors – long-term growth and ending valuations – the more reliable the valuation measure. That’s exactly why it’s preferable to use fundamentals with smooth and predictable long-term growth rates, and to use a denominator that’s representative and proportional to the very, very, very long-term stream of cash flows that companies will deliver to investors over time.
Arithmetic is the greatest long-term adversary of rich valuations. Consider, for example, that nominal GDP, corporate gross value-added, and S&P 500 revenues have all grown by only about 4.5% annually over the past 10, 20, and 30 years. This includes all the technological innovation of the “new economy” in recent decades. For S&P 500 revenues, it also includes the cumulative benefit of stock buybacks. While earnings have grown faster than 4.5%, primarily due to depressed post-GFC wage growth and low interest costs born of a decade of zero-interest rate policy, elevated profit margins must now be sustained forever in order for earnings growth to keep pace with revenue growth. Meanwhile, the S&P 500 price/revenue ratio is presently at 2.6, higher than any multiple observed in U.S. history prior to September 2020. Finally, the dividend yield of the S&P 500 is presently just 1.5% even though dividends are close to the highest fraction of revenues in history.
The easy part, but the hard reality, is arithmetic. Assuming that today’s extreme price/revenue ratio maintains a “permanently high plateau” (the same proposition Irving Fisher infamously offered at the 1929 peak), a continued 4.5% growth rate in revenues would be accompanied by the same 4.5% growth rate in prices. Add a 1.5% dividend yield, and a permanently high plateau would be expected to produce 6% annual long-term total returns for the S&P 500.
The problem is that the historical norm of the S&P 500 price/revenue ratio has been not 2.6, but only about 1.0. The ratio got down to 1.16 at the 2002 market low, 0.66 at the 2009 low, and a still elevated 1.59 at the low of the pandemic selloff in early 2020. Let’s assume that a decade from now, the ratio stands no lower than that 2020 trough of 1.59. In that event, continued 4.5% revenue growth coupled with a 1.5% average dividend yield implies average annual 10-year S&P 500 total returns of just (1.045)*(1.59/2.60)^(1/10)-1+0.015 = 1.0% annually for a decade. Should the price/revenue ratio touch its historical norm of 1.0, the estimated 10-year outcome would be a loss of about -3.5% annually.
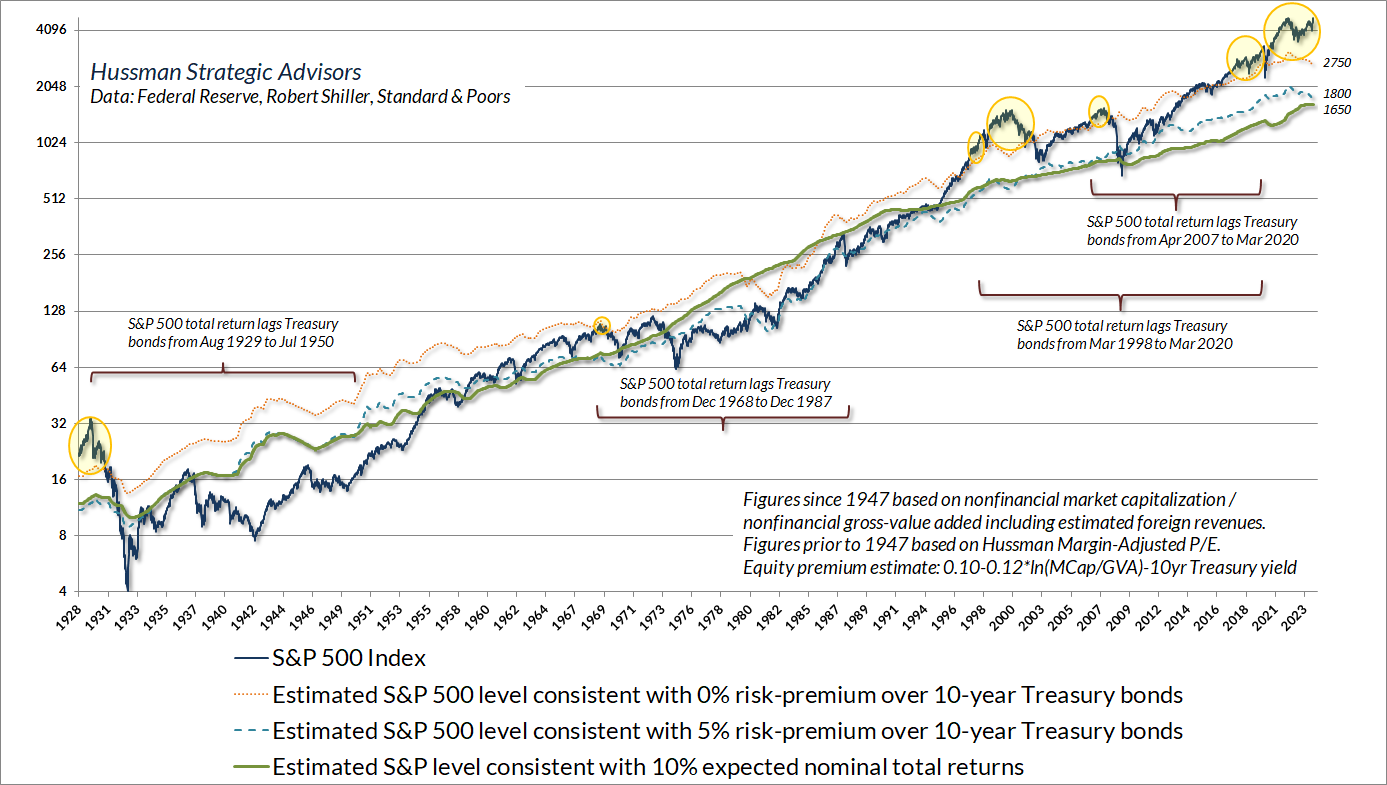
That basic arithmetic is why elevated valuations tend to produce “long, interesting trips to nowhere” for investors. Amid the excitement of Fed pivots and record highs, it may be lost on investors that the S&P 500 lagged Treasury bonds from August 1929 to July 1950, December 1968 to December 1987, and March 1998 to March 2020. That’s 62 years out of a 91-year period, all from valuation levels less extreme than we observe at present.
These long, interesting trips to nowhere can be measured from varying starting points, but the defining feature is that they begin at points of elevated valuations and end at points, often well over a decade later, of depressed valuations. Relative to risk-free Treasury bills, for example, the S&P 500 lagged T-bills from 1929 to 1947, 1966 to 1985, and 2000 to 2013. That’s 50 years out of an 84-year period. Lagging T-bills. Still, it should not be lost on investors that most of this underperformance is compressed into a few years following extreme valuations. It’s the initial collapses from extreme valuations like today’s that do the most damage.
At present, we estimate that a decline to the 1650 level on the S&P 500 (a 65% loss) would be needed to restore historically run-of-the-mill S&P 500 expected returns of 10% annually. A level of 1800 (a 62% loss) would bring our estimates of expected returns to a typical 5% risk-premium over and above current 10-year Treasury yields. A decline to about 2750 on the S&P 500 (a 42% loss) would bring our estimates of 10-year S&P 500 total returns merely in line with the prevailing 4% yield on 10-year Treasury bonds. None of these figures are forecasts, but they do represent historically consistent estimates of the potential market losses that would be needed to restore pedestrian levels of long-term expected return. I realize that estimating potential market losses of 42-65% may seem preposterous, but as I wrote in March 2000, “If you understand values and market history, you know we’re not joking.”
Emphatically, extreme valuations do not, in themselves, imply near-term market losses. If rich valuations were enough to drive the market lower, it would be impossible for the market to have reached the extremes we observed in 1929, 2000, and today. Reaching these levels, by definition, required investors to ignore lesser valuation extremes for years. That’s why market internals are important – particularly in a Fed-induced bubble that dissolved previously reliable “limits” to speculation.
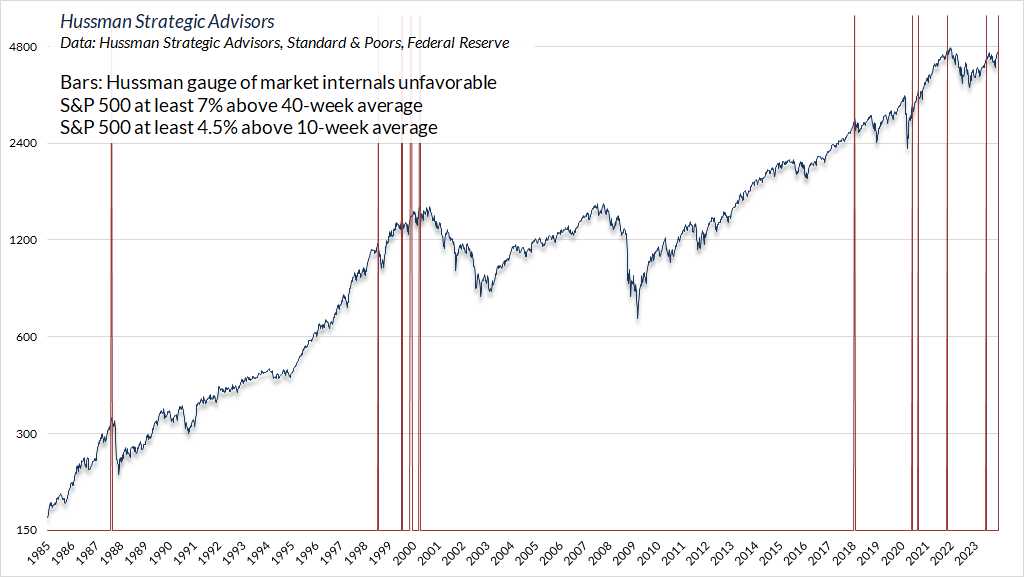
While we remain flexible to a possible shift in the uniformity of internals, our key gauge remains unfavorable, despite a market advance during the past 7 weeks that has driven the S&P 500 from its lower Bollinger bands (two standard deviations below its 20-period average) through its upper bands, at their daily, weekly, and even monthly resolutions.
Given that the S&P 500 is also clearly above popular “trend following” measures such as the 40-week and 10-week averages, it’s a fair question to ask whether we’ve ever seen similar strength in the S&P 500 while our gauge of market internals has remained unfavorable. The answer is yes.
The chart below shows previous instances when the S&P 500 has been at least 7% above its 40-week average, and at least 4.5% above its 10-week average, as it is presently, with our gauge of market internals still unfavorable. These instances typically occurred immediately preceding steep market losses, such as those in 1987, 1998, 2000, and 2022; moderate losses such as 2018 and the decline into the recent October low; and forgettable losses, such as two distinct declines in excess of 6% in 2020, which were later followed by a favorable shift in internals. Suffice it to say that we can’t rule out a favorable shift in this instance, but more often than not, divergences between market internals and more popular “trend following” measures have tended to be resolved in favor of broad internals.
In summary, our most reliable stock market valuation measures are presently between 2.6 and 2.8 times the long-term norms that we associate with historically run-of-the-mill S&P 500 total returns of 10% annually. Nothing in our discipline requires a retreat in valuations to those norms, but we do estimate potential full-cycle market losses of between 42% and 65%; the smaller figure simply to bring estimated S&P 500 total returns the same level as the yield on 10-year Treasury bonds, and the larger figure to restore historically run-of-the-mill expected returns of about 10% annually. We view bond yields as acceptable but also somewhat inadequate, relying on a clear and continued retreat in inflation, nominal growth, and T-bill yields in order to justify their present levels. We cannot rule out an improvement in market internals, nor a “pivot” to lower interest rates, but at present, both of these would be occurring at the highest levels of valuation in history, suggesting that the follow-through may not be particularly durable even if they occur.
The yearning affection that investors hold for Fed pivots is quietly driven by the fact that nearly all the pivots occurred when the S&P 500 already stood at historically normal or depressed levels of valuation. The associated market returns were typically a function of two factors: favorable valuations, coupled with an improvement in market internals. It’s those factors – the central elements of our investment discipline – that actually correlate with favorable market outcomes.”
Keep Me Informed
Please enter your email address to be notified of new content, including market commentary and special updates.
Thank you for your interest in the Hussman Funds.
100% Spam-free. No list sharing. No solicitations. Opt-out anytime with one click.
By submitting this form, you consent to receive news and commentary, at no cost, from Hussman Strategic Advisors, News & Commentary, Cincinnati OH, 45246. https://www.hussmanfunds.com. You can revoke your consent to receive emails at any time by clicking the unsubscribe link at the bottom of every email. Emails are serviced by Constant Contact.
The foregoing comments represent the general investment analysis and economic views of the Advisor, and are provided solely for the purpose of information, instruction and discourse.
Prospectuses for the Hussman Strategic Growth Fund, the Hussman Strategic Total Return Fund, and the Hussman Strategic Allocation Fund, as well as Fund reports and other information, are available by clicking “The Funds” menu button from any page of this website.
Estimates of prospective return and risk for equities, bonds, and other financial markets are forward-looking statements based the analysis and reasonable beliefs of Hussman Strategic Advisors. They are not a guarantee of future performance, and are not indicative of the prospective returns of any of the Hussman Funds. Actual returns may differ substantially from the estimates provided. Estimates of prospective long-term returns for the S&P 500 reflect our standard valuation methodology, focusing on the relationship between current market prices and earnings, dividends and other fundamentals, adjusted for variability over the economic cycle. Further details relating to MarketCap/GVA (the ratio of nonfinancial market capitalization to gross-value added, including estimated foreign revenues) and our Margin-Adjusted P/E (MAPE) can be found in the Market Comment Archive under the Knowledge Center tab of this website. MarketCap/GVA: Hussman 05/18/15. MAPE: Hussman 05/05/14, Hussman 09/04/17.