

This Is Where You Start Bear Markets From


John P. Hussman, Ph.D.
President, Hussman Investment Trust
May 2024
Today is in the top percent on the Shiller P/E of all time, and when you start from this level, you have a very hard time going up materially. You’ve done it once or twice, but you’ve only done it for a while: in the last gasp of 1929; in the last gasp of 1999; and notably and most impressively in Japan, where maybe for two and a half years you kept going. And in each case, they ended incredibly badly. So, the price you paid for bucking that kind of law was a very high price.
In general, if you want to make a lot of money, and you want to have a long bull market, you need high unemployment, depressed profit margins, and depressed P/Es. It’s beautiful double-counting. Multiplying depressed earnings by a low P/E is really double counting. Multiplying peak earnings by a high P/E, which is what we’re doing today, is also double jeopardy the other way. And the gap between peak P/E times peak profits all the way to trough P/E times trough profits, that’s a big run. That’s the kind of thing we saw ending up in 1974 and 1982, and to some extent in 2009. Yes, it was somewhat higher in 2009 than 1982, but the discount rate, interest rate, everything else had shifted, and it was down an awful lot from its peak.
But it feels good at the top of the spike, always feels terrific. And people always torture the logic to think, like in 1929, that it’s a “new high plateau.” 1929 – in the most predictive model that I have come across, which is run by Hussman – the only one that is about the same is 2021, and a little bit higher, both of them, than today. These are not good times to start a 10-year bull market, and yet, one or two bulls are saying whoopee, this is the beginning of a great bull market.
We have totally full employment, totally wonderful profit margins. All the things you would not want to start a bull market from. This is where you start bear markets from. Great bull markets start with exactly the opposite. But it always feels wonderful. Peak profit margins, getting there takes years, and it feels nice. And so you’ve got a great track record. You can’t get to peak margins without leaving a terrific track record. You’ve got the peak P/E, so you feel wonderful, the stock market has gone up and up and up and up. So everyone feels great, and that’s how you get to a market peak. You feel great about everything. Of course, almost by definition.
When do you start going down? You still feel great. You just don’t feel quite as great as you felt the day before. That’s why it’s so damn hard, at both ends.
Jeremy Grantham, GMO, The Insightful Investor, March 19, 2024
As of last week, the total return of the S&P 500 was even with 3-month Treasury bill returns since the valuation peak of January 2022, more than two years ago. In our view, investors continue to “grasp at the suds of yesterday’s bubble,” ignoring extreme valuations, lopsided bullish sentiment, emerging pressure on profit margins, economic conditions at the border of recession (though the evidence is not yet decisive) and most important for near-term outcomes, unfavorable market internals.
An improvement in the uniformity of market internals would not improve our expectations for long-term returns, nor would it reduce the risk of severe market losses over the completion of this cycle. Still, improved internals would encourage a more neutral or even constructive near-term outlook (albeit with position limits and safety nets). For now, rich valuations, unfavorable market internals, and other elements of our discipline hold us to a defensive outlook.
Regardless of how much we might comment on underlying market conditions, particularly valuations, remember the condition of market internals drives much of our investment outlook at each point in time – particularly with the adaptations we adopted in 2021. Valuations are like potential energy, and it’s important to know when you’re sitting on a powder keg. But investor psychology, which we infer from market internals, is the main catalyst that suppresses or releases that potential energy.
The chart below shows our most reliable valuation measure, based on its correlation with actual subsequent S&P 500 total returns across a century of market cycles: the ratio of nonfinancial market capitalization to corporate gross value-added, including estimated foreign revenues.
Notice that the current extreme is just shy of those observed in August 1929 and January 2022. The current level is about three times the historical norm. We’ve seen this sort of valuation extreme before, but as Jeremy Grantham observed, “you’ve only seen it once or twice.”
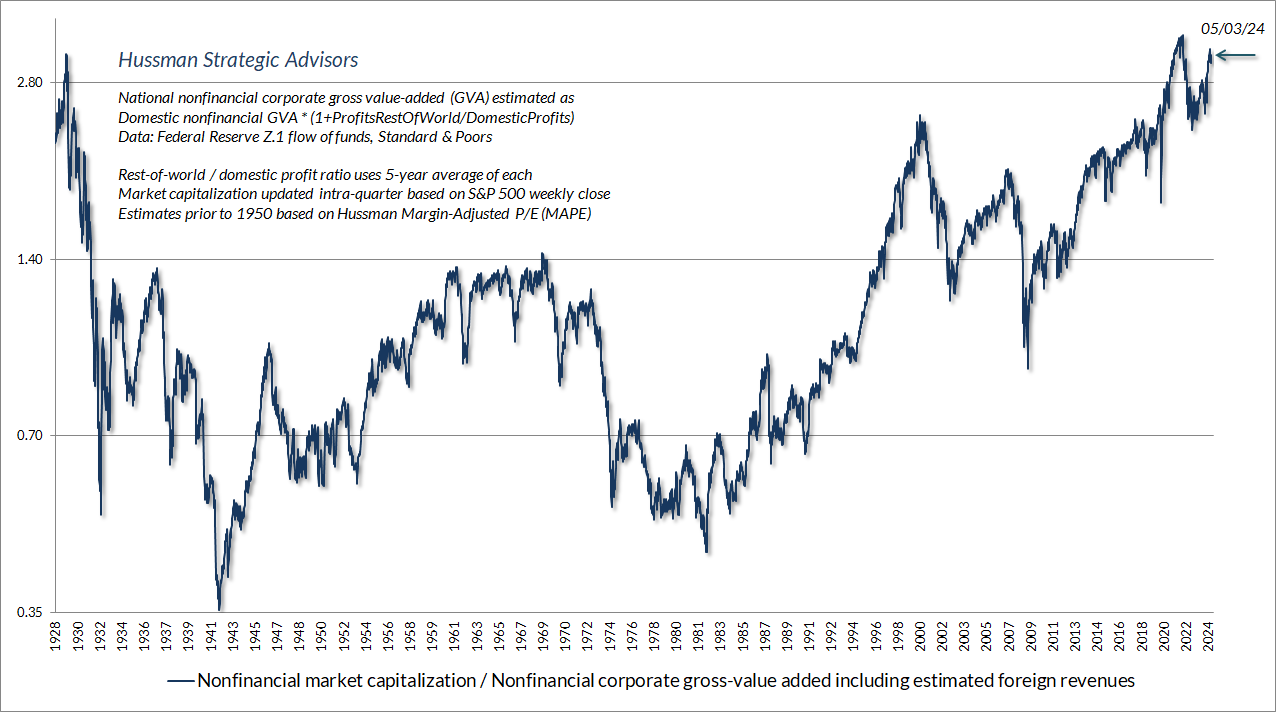
Investors seem to hear “1929” and immediately dismiss the speaker, because they associate that extreme with a subsequent Depression and an 89% market collapse. But remember that an 89% collapse is actually two back-to-back two-thirds losses. After the 1929 peak, the first 2/3 loss simply took the market to historically run-of-the-mill valuation norms. Bank failures, ineffective policy, and economic disarray then erased 2/3 of what was left. I don’t expect the second bit, I don’t think investors should rule out the first, but in practice, we don’t rely on either.
During the latter stage of the bull market culminating in 1929, the public acquired a completely different attitude towards the investment merits of common stocks… Why did the investing public turn its attention from dividends, from asset values, and from average earnings to transfer it almost exclusively to the earnings trend, i.e. to the changes in earnings expected in the future? The answer was, first, that the records of the past were proving an undependable guide to investment; and, second, that the rewards offered by the future had become irresistibly alluring.
Along with this idea as to what constituted the basis for common-stock selection emerged a companion theory that common stocks represented the most profitable and therefore the most desirable media for long-term investment. This gospel was based on a certain amount of research, showing that diversified lists of common stocks had regularly increased in value over stated intervals of time for many years past.
These statements sound innocent and plausible. Yet they concealed two theoretical weaknesses that could and did result in untold mischief. The first of these defects was that they abolished the fundamental distinctions between investment and speculation. The second was that they ignored the price of a stock in determining whether or not it was a desirable purchase.
The notion that the desirability of a common stock was entirely independent of its price seems incredibly absurd. Yet the new-era theory led directly to this thesis… An alluring corollary of this principle was that making money in the stock market was now the easiest thing in the world. It was only necessary to buy ‘good’ stocks, regardless of price, and then to let nature take her upward course. The results of such a doctrine could not fail to be tragic.
– Benjamin Graham & David L. Dodd, Security Analysis, 1934
Investors lose their discipline at market peaks. They become convinced that valuations are irrelevant. They become convinced that investment returns are somehow independent of the price one pays. As a rule, the more extreme valuations become, the longer it has taken to get to those extremes, the longer value investors appear to have been “proven” wrong, and the more evidence there seems to be that passive investing is a “sure thing.” Attending to market internals can certainly improve the situation, but in the end, there’s really no distinction between:
- the observation that market valuations are at record highs, and
- the opinion that value-conscious investing is obsolete and passive investing is for winners.
Reality sets in later. The arithmetic is straightforward. Over the past 10, 20, and 30 years, both nonfinancial corporate revenues and nominal GDP have grown at an average annual rate of about 4.5%, which includes the impact of the recent bout of inflation. Meanwhile, the dividend yield of the S&P 500 currently stands at 1.4%. Assuming that valuations remain at a “permanently high plateau,” prices would grow at the same annual pace as fundamentals. Add the dividend yield, and estimated long-term S&P 500 total returns – assuming permanently elevated valuations – come to about 5.9% annually.
Now allow MarketCap/GVA to retreat from its current extreme of 3.2 over the coming decade, but no lower than the level of 1.7 we observed in early 2020. In that case, the estimated total return includes not only growth in fundamentals and dividend income, but also the annualized impact of the change in valuations:
Estimated 10-year S&P 500 total return: 1.045*(1.7/3.2)^(1/10) – 1 + 0.014 = -0.5% annually
Now assume that MarketCap/GVA instead retreats to its historical norm of 0.98. Historically, that level has been consistent with run-of-the-mill subsequent S&P 500 total returns averaging 10% annually. Valuations regularly fell below that historical norm (followed by high subsequent market returns) in much of U.S. market history before 1995. As I noted at the time, the S&P 500 also dropped to undervalued levels in October 2008. In contrast, recent market returns have relied on valuations pushing to record highs. Suppose that valuations a decade from today instead reach that norm of 0.98:
Estimated 10-year S&P 500 total return: 1.045*(0.98/3.2)^(1/10) – 1 + 0.014 = -5.8% annually
Such seemingly preposterous long-term return estimates, like those I proposed in 2000 and 2007, are largely a reflection of basic arithmetic. In the short run, stock prices will go wherever investor psychology will take them. Yet, be it a speculative bubble or a risk-averse panic, stocks continue to be claims on a stream of future cash flows, and long-term returns are still determined by the prices investors pay.
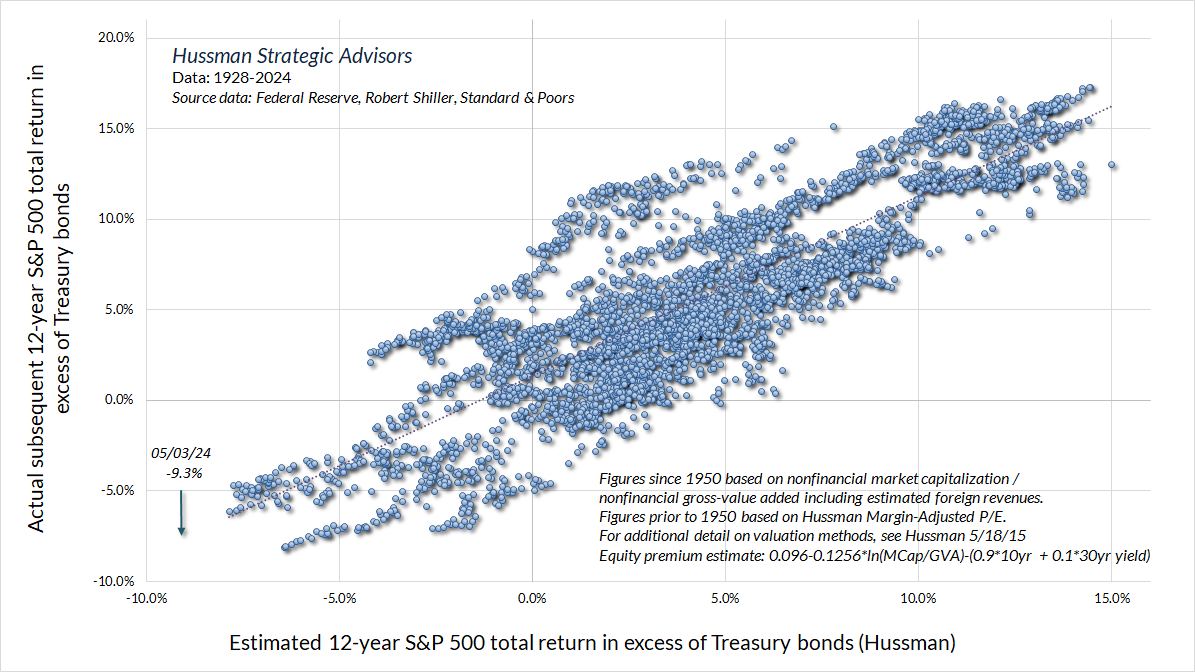
Given that Treasury bonds currently yield about 4.5%, it should not be surprising that our estimates of the likely 10-12 year “equity risk premium” (S&P 500 total returns in excess of Treasury returns) stand at the lowest levels in history. The chart below shows our 12-year projection in data since 1928. Notably, there’s no complex data mining here. The projected S&P 500 total return is just linear in (log) valuations.
We presently estimate that the S&P 500 is likely to lag Treasury bond returns by a record -9.3% annually over the coming 12-year period. That’s worse than the August 1929 low of -6.4%. Worse than the 2000 low of -7.9%, a point when I was also projecting negative 10-year S&P 500 total returns and an -83% loss in technology stocks (the tech-heavy Nasdaq 100 went on to lose an improbably precise -83%).
It almost strains credibility to share estimates like this. For that reason, I always add – emphatically – that nothing in our discipline relies on a retreat in valuations to their historical norms. In practice, our investment outlook reflects the combination valuations, market internals, and other factors that we observe at each point in time, and our outlook will change as those conditions change. No forecasts are required.
Be it a speculative bubble or a risk-averse panic, stocks continue to be claims on a stream of future cash flows, and long-term returns are still determined by the prices investors pay.
Show us a financially reasonable and more reliable estimate of the likely equity risk-premium, and we would happily use it. Why wouldn’t we? The problem is that we haven’t found any alternative estimation approach, not the Fed Model, not Shiller-Black-Jirav, not Damodaran, nothing, better correlated with actual, subsequent S&P 500 total returns than the methods we use.
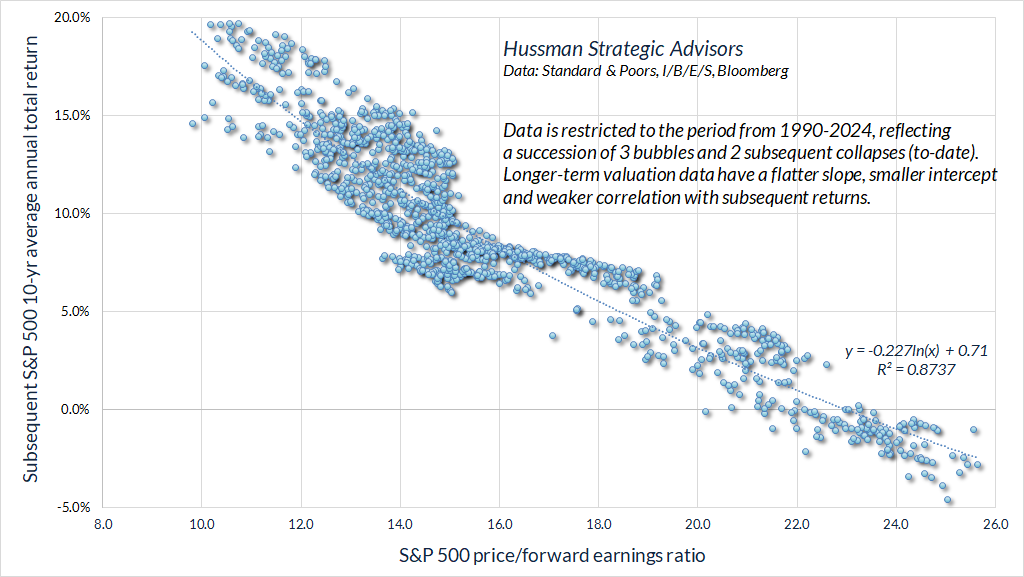
Still, given risk that investors might otherwise dispense with valuation measures entirely, here’s the most “bullish” alternative to our own valuation measures. It requires one to take current profit margins as permanent, to assume that the bubble valuations of recent decades are the “new normal,” and that all future market losses will be recovered quickly as a result of aggressive monetary policy responses. It also requires one to ignore historical data prior to 1990, because it relies on the high intercept, front-loaded returns, and skewed slope that comes from restricting the data set to the bubble period (for more on this, see the section titled “You may not like this part” in The Structural Drivers of Investment Returns).
Just so we’re clear, I don’t embrace these assumptions. As Jeremy Grantham observed, current market prices reflect a combination of elevated price/earnings (P/E) ratios multiplied by earnings that rely on elevated profit margins. This combination has proved, across history, to be a tragic sort of “double jeopardy” (see Top Dollar for Top Dollar for more on this principle). Still, if you’re looking for the “optimistic case” for market valuations, the chart below is it. It shows the ratio of the S&P 500 to analyst estimates of year-ahead “forward” operating earnings, strictly in data since 1990. This is as bullish a view as I can offer. Unfortunately, with the S&P 500 price/forward earnings currently above 20, it still implies estimated 10-year S&P 500 total returns in the low single digits, implying a slightly negative 10-year risk premium relative to Treasury bonds. I suspect this projection is optimistic, but there it is.
As for other “but what about” arguments, our March comment, Universal Capitulation and No Margin of Safety, offers a deep-dive into the drivers of profit margins in recent decades. The fact is that the profit margins of U.S. nonfinancial corporations, before interest and taxes, have hovered around the same level for 75 years. The main impact of tax reductions occurred by the 1980’s. Despite various changes in statutory tax rates, the actual amount of taxes paid as a share of corporate revenues hasn’t changed in 40 years.
In recent decades, depressed labor costs following the global financial crisis boosted profits for several years after, but labor costs mainly drive cyclical fluctuations in profit margins and been normalizing in recent years; massive government subsidies and household dissaving provided a temporary boost to corporate profit margins following the pandemic, but these are being phased out.
It turns out that the strongest driver of progressively rising profit margins in recent years isn’t productivity, or technology, or tax reductions, or labor costs, or even government subsidies. The main driver has been progressively falling interest costs. Interest rates have already reversed, but margins don’t yet reflect that because corporations locked in record low rates during 2020-2021. The wall of refinancing lies directly ahead.
Again, current stock prices are the product of elevated P/E ratios, multiplied by record earnings that rely on record profit margins. Investors are paying top dollar for top dollar, yet even if investors take margins and multiples at face value, they still imply likely 10-year S&P 500 total returns in the low single digits.
But what about inflation? Well, probably the first thing to remember is that high inflation typically benefits stocks only after valuations have been crushed. That’s been true not just internationally, but also in the United States. Recall that the Consumer Price Index tripled from 1968-1982, yet the S&P 500 index fell from 108 to 102. Valuations are far worse today than in 1968. A several-fold increase in the CPI would be required for the positive impact of inflation on nominal fundamentals to dominate the negative impact of extreme valuations.
The fact is that while stocks have been good inflation hedges over time, the best inflation-associated returns for the S&P 500 have emerged when the rate of inflation has been trending lower, typically only after valuations have been decimated. Equally important, for our own discipline, is that regardless of whether inflation is high and advancing, low and declining, or any combination in-between, the strongest S&P 500 total returns have emerged in periods when market internals have been uniformly favorable on our measures. The weakest S&P 500 total returns have emerged when internals were ragged and divergent.
The chart below shows the cumulative total return of the S&P 500 in periods when the rate of core CPI inflation has been anywhere above the Federal Reserve’s 2% annual target and our gauge of market internals has been unfavorable. Stocks are rarely a useful “inflation hedge” when investors are risk averse, as gauged by divergent market internals.
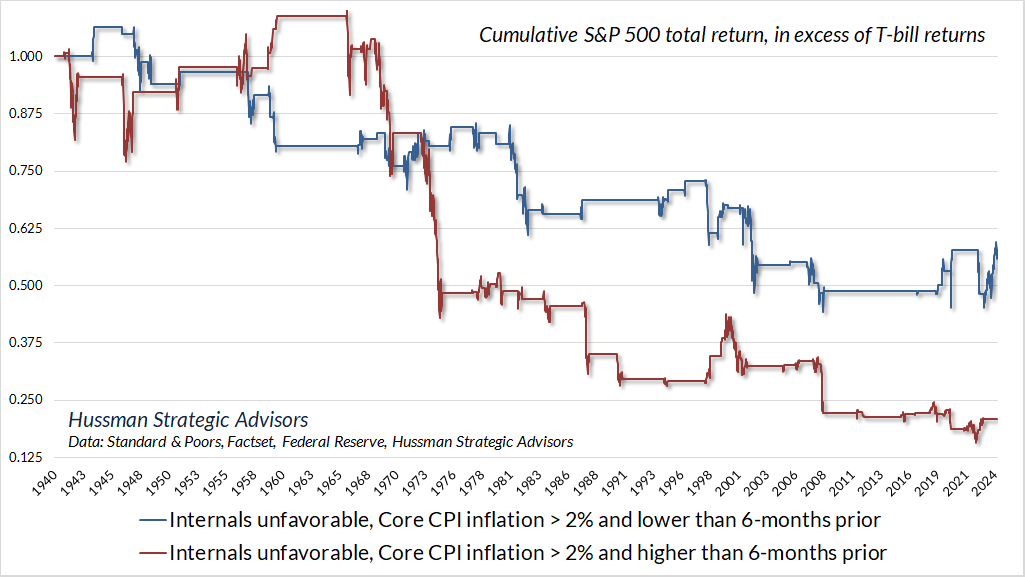
From the standpoint of our investment discipline, we expect inflation-related market gains to emerge during periods of favorable internals. When our gauges of market internals have been unfavorable, it hasn’t really mattered whether inflation was rising or falling, stocks lost value relative to T-bills either way, on average. For us, it’s the current, observable, measurable status of market internals, not speculation or forecasts of future inflation, that matters most.
Market internals remain unfavorable
For decades, I’ve noted that extreme valuations do not necessarily imply near-term market losses. The only way valuations can ever reach levels as extreme as 1929, 2000, 2021 and today is by blowing through lesser valuation extremes for years. This leads to the dangerous tendency to abandon valuations as uninformative and useless. That’s a mistake.
Valuations matter profoundly when estimating long-term market returns and likely full-cycle market losses. Yet market returns over shorter segments of the cycle are mainly driven by investor psychology – specifically, whether investors are inclined toward speculation versus risk-aversion.
Valuations are like potential energy, and it’s important to know when you’re sitting on a powder keg. But investor psychology, which we infer from market internals, is the main catalyst that suppresses or releases that potential energy.
When investors are inclined to speculate, they tend to be indiscriminate about it. When speculation becomes highly selective, it’s typically an indication of subtle or emerging risk-aversion. For that reason, we gauge investor psychology toward speculation and risk-aversion based on the uniformity and divergence of market action across thousands of individual stocks, industries, sectors, and security-types, including debt securities of varying creditworthiness.
I introduced our main gauge of “market internals” to our discipline in 1998, during the most speculative portion of the tech bubble, with minor adaptations since. As I noted in 2021, for example, we adopted a slightly more “permissive” threshold in our gauge of market internals when interest rates are near zero and certain measures of risk-aversion are well-behaved. Given that we use market internals to gauge speculative psychology, a more permissive threshold captures the idea that tossing deranged Fed policy into the mix boosts the implications of a given improvement in market internals.
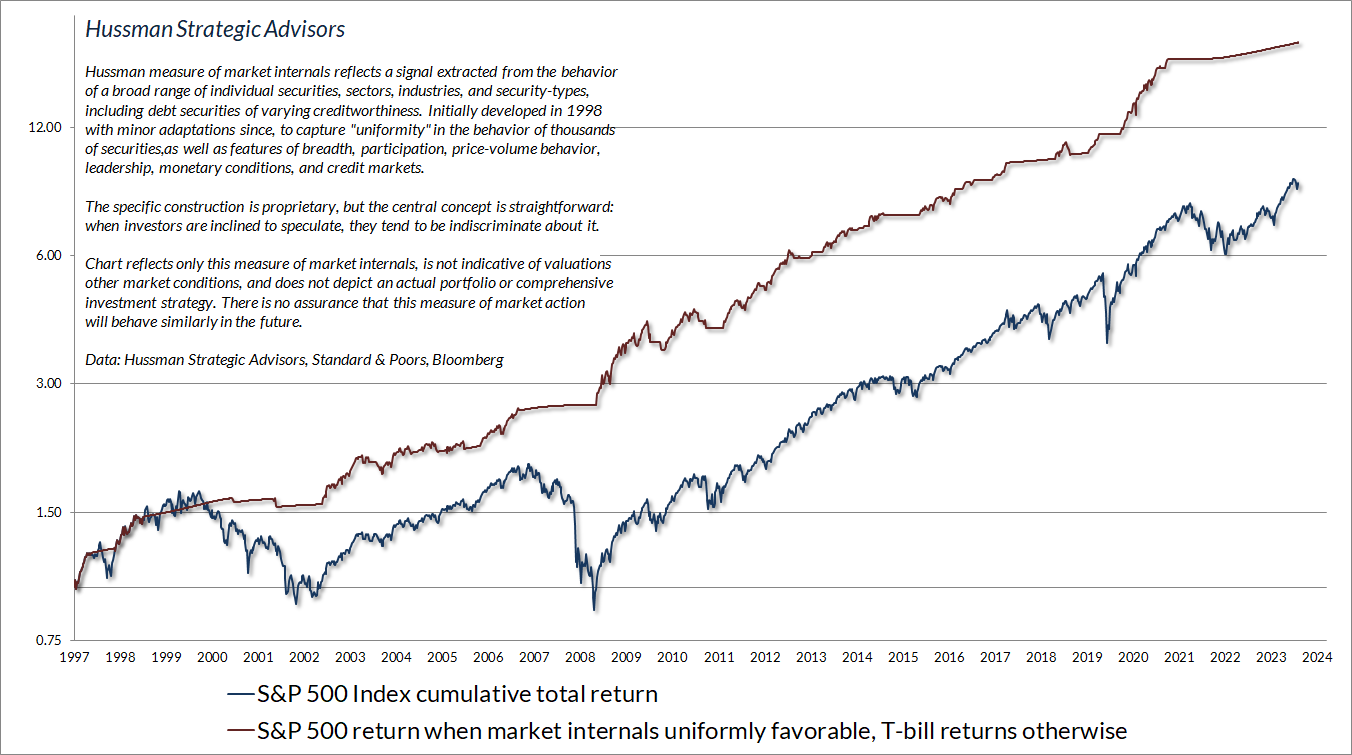
The chart below presents the cumulative total return of the S&P 500 in periods where our main gauge of market internals has been favorable, accruing Treasury bill interest otherwise. The chart is historical, does not represent any investment portfolio, does not reflect valuations or other features of our investment approach, and is not an assurance of future outcomes.
Don’t fight the …
Investors are often encouraged to distill market analysis into simple notions like “Don’t fight the trend” and “Don’t fight the Fed.” As it happens, unless investors demonstrate a broad inclination to speculate, both of those notions have typically produced losses.
The chart below shows periods since 1940 when our primary gauge of market internals has been unfavorable, despite: a favorable “trend” as measured by the S&P 500 above its 40-week average, expected monetary easing as measured by a 2-year Treasury yield no more than 0.25% above the prevailing Fed funds rate, and the absence of “compressed” market conditions, measured by at least 30% of individual stocks above their own respective 40-week averages.
The blue line shows the cumulative total return of the S&P 500, over-and-above T-bill returns, during these periods. Despite favorable trend and monetary conditions, the S&P 500 regularly lost ground. The blue line hit its recent low point last October. Since then, despite persistently unfavorable internals, we’ve experienced a rather frustrating market advance in recent months. My sense is that this has created a certain impatience and fear of missing out among investors.
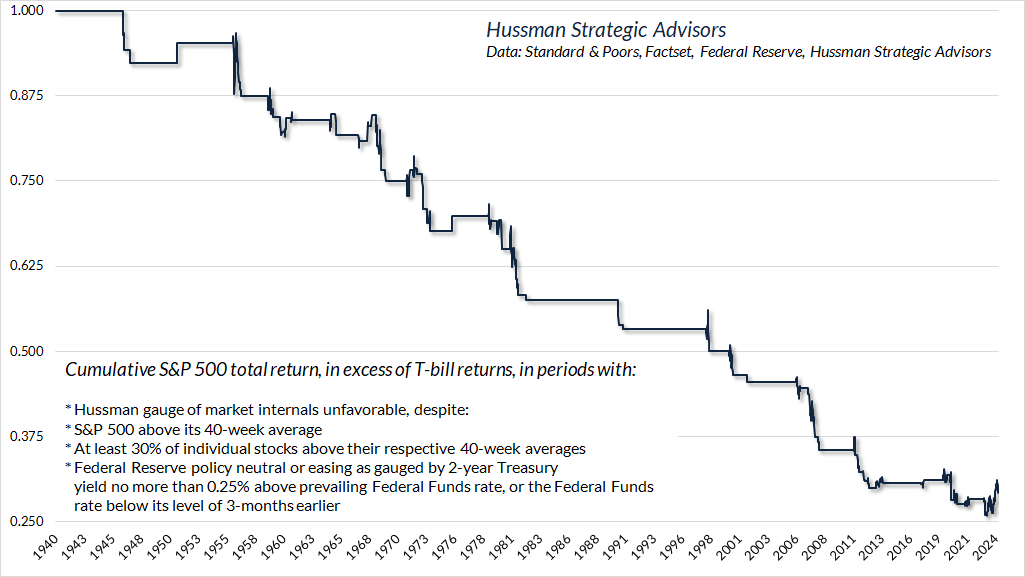
As I noted last month, our approach to that impatience has been to examine every aspect of our work – testing literally hundreds of modifications that might “force” a favorable shift here, without degrading the reliability of internals over the recent cycle and across history. We haven’t found even one that would do so. That’s probably because it’s ill-advised to force a constructive position amid market extremes, divergent internals, and narrow speculation in large-cap glamour stocks. Indeed, for reasons I detailed last month, placing additional weight on the behavior of the largest capitalization stocks clearly weakens the historical reliability of internals. Whether the S&P 500 retreats, or internals recruit improved uniformity, I trust the two will be in sync soon enough.
As for monetary policy, the chart below provides added perspective on the notion of “Don’t fight the Fed.” Each line shows the cumulative total return of the S&P 500 isolated to a given combination of monetary policy and market internals. Notice that regardless of the stance of monetary policy, the cumulative positive returns are captured by periods of favorable internals. Monetary easing is not required, and it is not enough. Investors seem to forget that the Federal Reserve eased persistently and aggressively throughout the 2000-2002 and 2007-2009 collapses, and that Fed easing during recessions is often accompanied by steep declines.
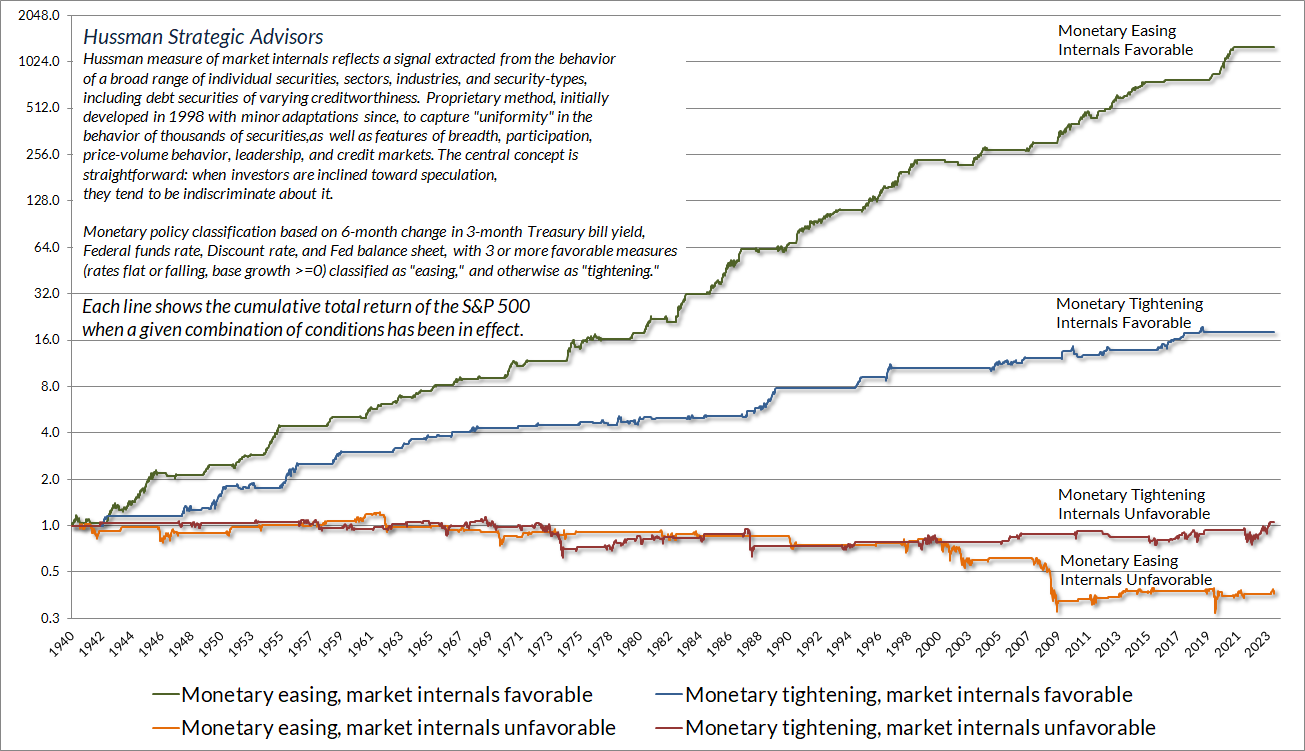
Data: Hussman Strategic Advisors, Federal Reserve, Standard & Poors
The worst market losses tend to occur when the Fed is easing yet investors remain risk-averse, as gauged by internals. It’s only when risk-aversion comes off that monetary easing supports stocks. There’s a reason for that. When investors are risk-averse, they treat safe, low-interest liquidity as a desirable asset, so creating more of the stuff doesn’t promote speculation. In contrast, when investor psychology shifts toward speculation – which we gauge based on the uniformity of internals – they treat safe, low-interest liquidity as an inferior asset, and try to get rid of it, passing it off from one investor to the next.
The speculative episode of the past decade has increased the emphasis we place on internals. My openly admitted error in the face of zero interest rate policies was to believe that speculation still had a limit, as it historically had, even when investors were forced to pass around 18-36% of GDP in zero-interest hot potatoes. We’ve adapted to that, prioritizing internals so that we are never bearish, and typically constructive, when internals are favorable – regardless of valuations, and regardless of overextended “limits.” But remember – monetary easing in itself is not enough. It was the zero-interest aspect of Fed liquidity, combined with favorable internals and speculative psychology, that gave QE its oomph.
Prioritizing market internals, partially in 2017 and more fully in 2021, addresses the main challenges we had during the recent bubble. It also preserves the elements of our discipline that allowed us to admirably navigate decades of previous market cycles, bubbles, and collapses, and that we’ve validated across a century of historical data.
It was the zero-interest aspect of Fed liquidity, combined with favorable internals and speculative psychology, that gave QE its oomph.
Whether a favorable shift in our gauge of internals follows a material retreat in valuations, or is instead driven by a market advance that recruits fresh uniformity across a broader set of stocks, industries, sectors, and security-types, I have no doubt that we’ll observe a favorable shift soon enough. It’s at that time, without abandoning our discipline, that our outlook will shift. As usual, no forecasts are required.
Bond yields, gold, and economic growth
One place where inflation considerations matter more is in the analysis of bonds. Historically, the entire total return of 10-year Treasury bonds, over and above T-bill returns, has accrued in periods when the yield on bonds has been greater than the weighted average of T-bill yields (0.5), year-over-year nominal GDP growth (0.25), and core CPI inflation (0.25). The chart below shows the yield on 10-year Treasury bonds relative to simple benchmarks, based on this sort of comparison. In our view, the current 4.5% yield on 10-year Treasuries appears acceptable but slightly inadequate. We’ve been inclined to extend our bond maturities on recent yield spikes, but a fully adequate yield would presently be closer to 5.1%.
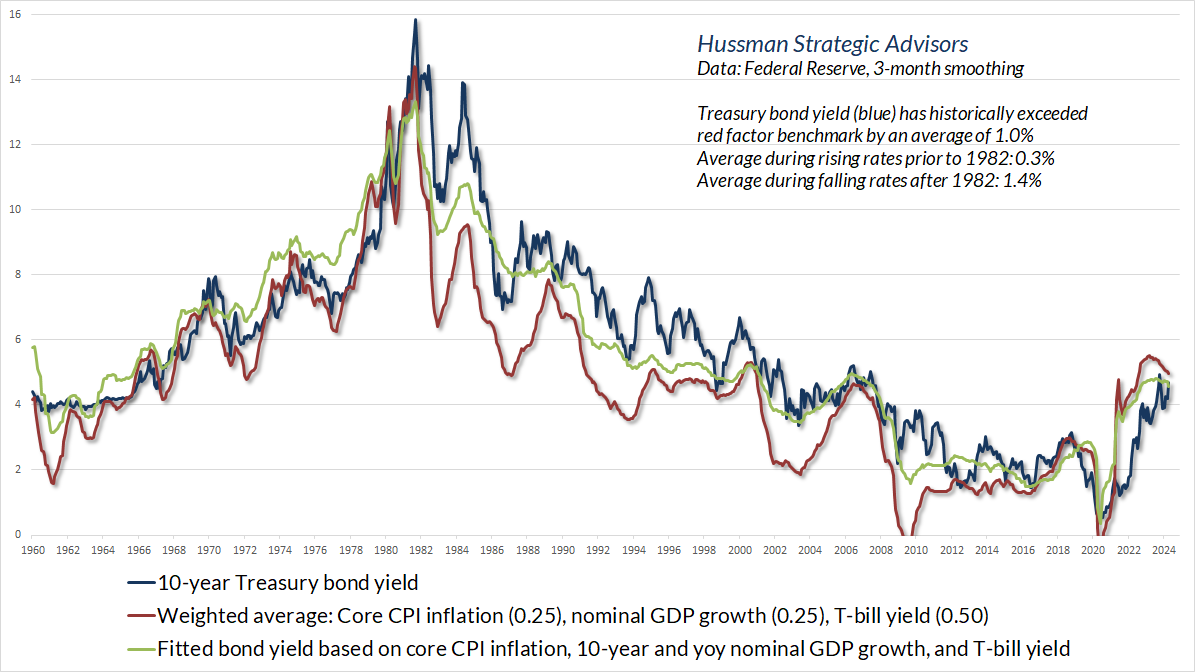
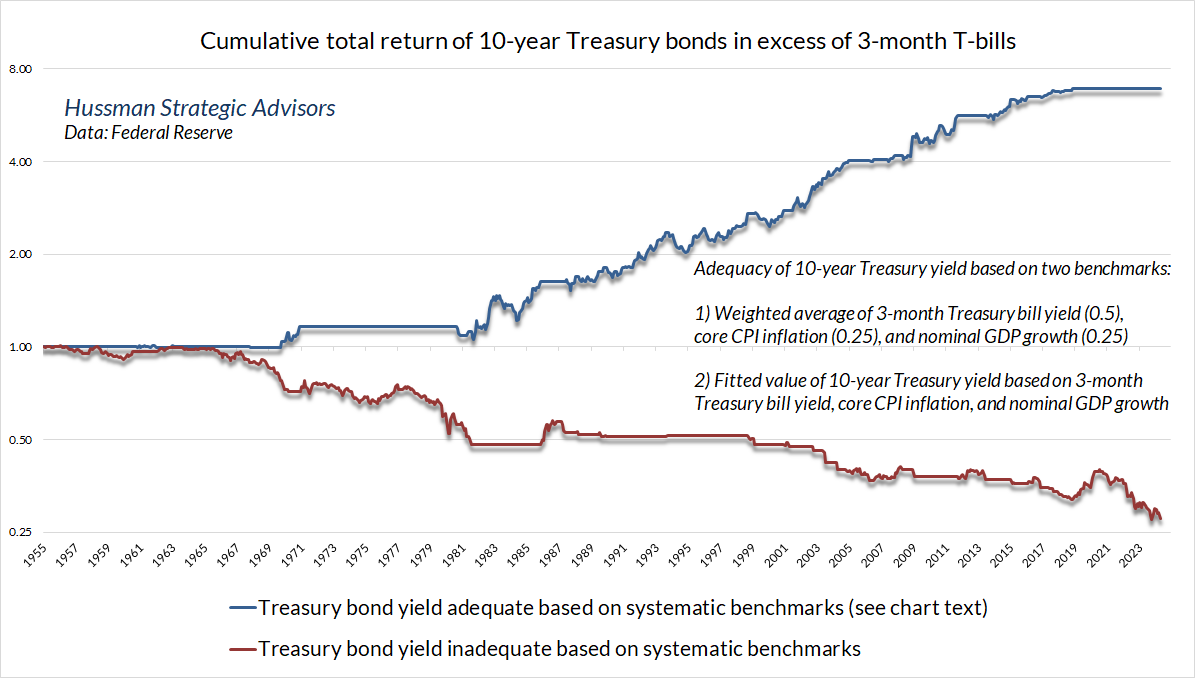
The chart below shows the cumulative total return of 10-year Treasury bonds, over-and-above T-bill returns, depending on whether bond yields were adequate or inadequate based on these benchmarks.
On a related note, it’s worth mentioning that despite the bluster about the Federal Funds rate being dangerously high, the rate is actually still below the level that systematic benchmarks would suggest, based on prevailing economic conditions.
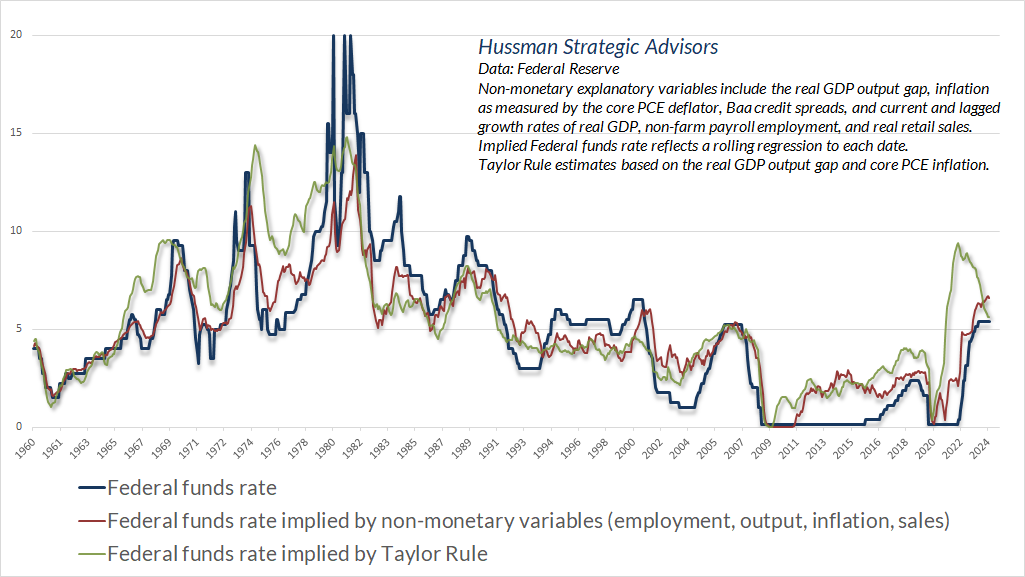
For our part, we don’t have any strong opinions about the desirability of modest hikes or cuts in the Federal Funds rate, other than to note that the present level is in the ballpark of what systematic policy would suggest. While it’s important to emphasize again that nothing in our own discipline relies on forecasts, the chart below is interesting enough to share – it presents our statistical estimates of the year-ahead Federal Funds rate. We don’t rely on these estimates, but it’s worth allowing for the possibility, barring an outright recession, that the rate may not be significantly different even a year from now.

Meanwhile, as I demonstrated in a series of charts in Money, Banking and Markets – Connecting the Dots, the relationship between recession and declining core inflation is surprisingly weak. In my view, the knee-jerk enthusiasm that investors place on every small blip in employment and unemployment, as a gauge of inflation risk and likely Fed policy, is misplaced. I don’t think I’m alone in that view.
It would have to be meaningful and get our attention and lead us to think that the labor market was really significantly weakening for us to want to react to it. A couple of tenths in the unemployment rate would probably not do that.”
– Jerome Powell, Federal Reserve Chair, May 1, 2024
A quick note on gold and precious metals shares. I’ve noted before that except when the rate of inflation is both high and rising, the behavior of precious metals stocks is strongly affected by whether Treasury yields are rising or falling (compared, for example, with their level 6 months earlier). Indeed, the entire total return of the XAU in recent decades has accrued in periods when the 10-year Treasury yield has been falling. Economic weakness, such as a weak purchasing managers index, can also be helpful. Presently, those conditions are right on the fence, though I’ve considered valuations reasonable for some time in this sector. Our own view has been constructive in recent months, though more restrained, at the moment, than earlier this year.
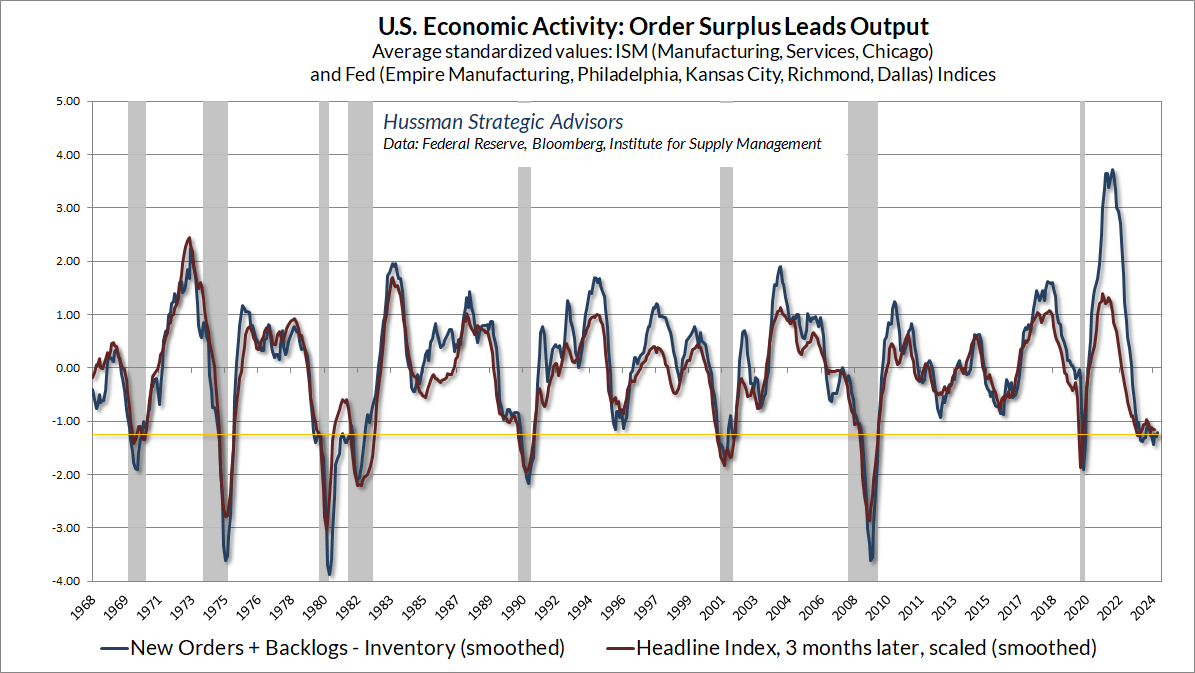
On the economic front, forward-looking measures remain at levels that have historically defined the border between expansion and new recession, but we have no particularly strong views here. We would need to see greater deterioration across a broad range of leading measures to expect a recession with confidence, and we don’t see that yet. For example, the chart below shows our “order surplus” gauge (new orders, plus backlogs, minus inventories, standardized), based on the consensus of national and regional Fed and Purchasing Managers Surveys. It’s certainly not a recession model in and of itself, but it does illustrate the “hovering” near typical recession thresholds that’s common across a wide range of measures we monitor. For now, we have no forecasts, and fortunately, no forecasts are required.
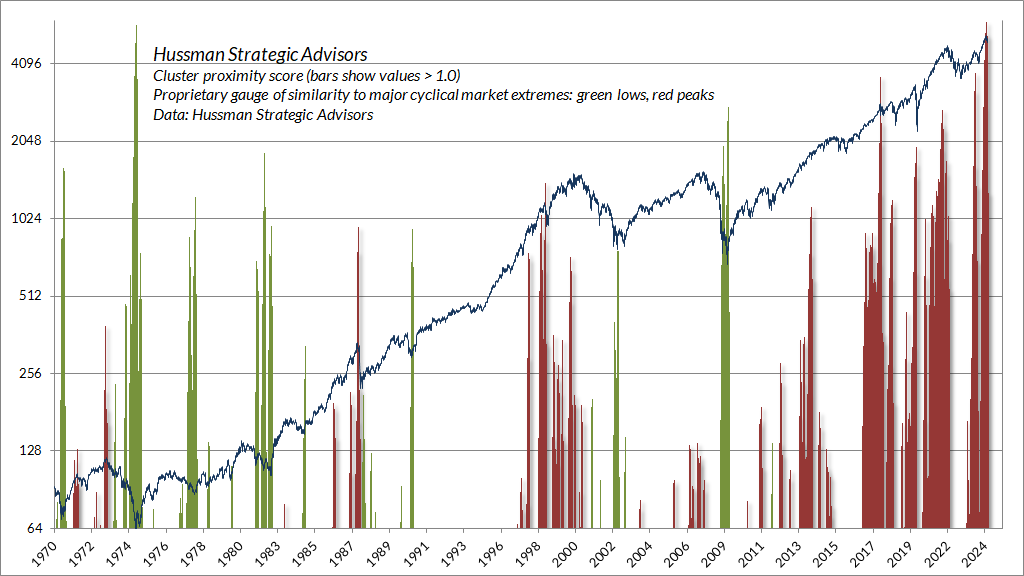
Finally, I observed several weeks ago that, based on dozens of measures that include valuations, internals, overextension syndromes, and numerous technical, fundamental, and cyclical gauges we’ve developed over time, current market conditions “cluster” among the worst 0.1% instances in history – more similar to major market peaks and dissimilar to major market lows than 99.9% of all post-war periods.
The chart below shows one of the numerous gauges we maintain in addition to those that typically appear in these comments. Our “cluster proximity score” is basically a measure of how close current conditions are to those that have typically characterized bull market peaks or bear market troughs. Emphatically, it is not an investment strategy or timing tool – the CPS can become quite favorable even in periods of unfavorable internals, as it did as the market plunged toward the 1972 and 1982 lows. Likewise, the CPS can become quite unfavorable even in periods of favorable internals, as it sometimes has in recent years. Still, when the key elements of our discipline align with the CPS, it’s best to pay attention.
Statistically, the current set of market conditions looks more “like” a major bull market peak than any point in the past century, with the possible exception of the 1929 peak. That’s no assurance that the market will plunge, nor that it can’t advance further. Still, given the combination of extreme valuations, unfavorable market internals, and dozens of other factors that cluster among the most “top-like” in history, we’re just fine with a risk-averse, even bearish outlook.
To be intentionally defensive means that whatever we might miss here is an intentional miss. Even during the recent bubble, the preponderance of market gains occurred in periods of favorable valuations, favorable internals, or both. We’ve made our adaptations in this bubble, and we’re comfortable maintaining our discipline, in the knowledge that even the most extreme market conditions are impermanent. As Jeremy Grantham recently observed, “This is where you start bear markets from.”
Keep Me Informed
Please enter your email address to be notified of new content, including market commentary and special updates.
Thank you for your interest in the Hussman Funds.
100% Spam-free. No list sharing. No solicitations. Opt-out anytime with one click.
By submitting this form, you consent to receive news and commentary, at no cost, from Hussman Strategic Advisors, News & Commentary, Cincinnati OH, 45246. https://www.hussmanfunds.com. You can revoke your consent to receive emails at any time by clicking the unsubscribe link at the bottom of every email. Emails are serviced by Constant Contact.
The foregoing comments represent the general investment analysis and economic views of the Advisor, and are provided solely for the purpose of information, instruction and discourse.
Prospectuses for the Hussman Strategic Growth Fund, the Hussman Strategic Total Return Fund, and the Hussman Strategic Allocation Fund, as well as Fund reports and other information, are available by clicking “The Funds” menu button from any page of this website.
Estimates of prospective return and risk for equities, bonds, and other financial markets are forward-looking statements based the analysis and reasonable beliefs of Hussman Strategic Advisors. They are not a guarantee of future performance, and are not indicative of the prospective returns of any of the Hussman Funds. Actual returns may differ substantially from the estimates provided. Estimates of prospective long-term returns for the S&P 500 reflect our standard valuation methodology, focusing on the relationship between current market prices and earnings, dividends and other fundamentals, adjusted for variability over the economic cycle. Further details relating to MarketCap/GVA (the ratio of nonfinancial market capitalization to gross-value added, including estimated foreign revenues) and our Margin-Adjusted P/E (MAPE) can be found in the Market Comment Archive under the Knowledge Center tab of this website. MarketCap/GVA: Hussman 05/18/15. MAPE: Hussman 05/05/14, Hussman 09/04/17.