
The Bubble Term


John P. Hussman, Ph.D.
President, Hussman Investment Trust
August 2025
I can show, really precisely, that there are two warranted prices for a share. The one I prefer is based on such fundamentals as earnings and growth rates, but the bubble is rational in a certain sense. The expectation of growth produces the growth, which confirms the expectation; people will buy it because it went up. But once you are convinced that it is not growing anymore, nobody wants to hold a stock because it is overvalued. Everybody wants to get out and it collapses, beyond the fundamentals.”
Franco Modigliani, Nobel Laureate, March 30, 2000, New York Times
Across more than four decades of navigating market cycles, sharing weekly or monthly market commentaries the entire time, I’ve had multiple opportunities to write about speculative bubbles and their subsequent collapse, in real time.
Neither the market collapse that followed the peak of the tech bubble in 2000, nor the crisis that followed the mortgage bubble in 2007, were particularly unusual in terms of the losses that followed those extremes. The notable thing, from the standpoint of our investment discipline, is that both were obedient. History has rarely afforded bubbles a life span of more than a decade, and neither the tech bubble nor the mortgage bubble that followed it were exceptions. People who dismiss everything I say with “permabear” don’t seem to realize that the reputation earned by navigating decades of full cycles well – prior to the current bubble – is the reason investors know my name in the first place.
In that context, it’s nice that despite maintaining a clearly negative market outlook here, our discipline is behaving as intended. Even amid an advance in the S&P 500, we’ve done just fine since we adopted our September 2024 hedging implementation. We’ve had regular opportunities to vary the intensity of our investment stance even amid the most extreme market conditions, leaving us much less reliant on market direction. For more on that hedging implementation, see Asking a Better Question, Subsets and Sensibility, and the section titled “The Martian” in The Turtle and the Pendulum.
We do prefer a certain amount of market fluctuation to a diagonal advance in a hypervalued bubble, as we’ve seen in recent months. Yet even as I discuss what I view as the third great speculative bubble in U.S. history – beyond both 1929 and 2000 – it’s important to recognize that nothing in our investment discipline relies on a market collapse, a reversion to historically normal valuations, an erosion of profit margins, a narrowing of fiscal deficits, an end to reckless Fed interventions, or even any particular forecast or scenario. I absolutely expect this bubble to end in tears. But if it doesn’t: We. Don’t. Care. Because nothing in our discipline forces us to care.
A bubble is a mathematical object
The defining feature of a bubble is inconsistency between expected returns based on price behavior and expected returns based on valuations. If investors pay $150 today for a security that will deliver a single $100 payment a decade from now, but they also fully understand that they’ll lose 4% annually on the deal, without extrapolating past gains into the future, then we might say the security is overvalued, and we might question why investors would accept that trade, but we can’t call it a bubble.
But if investors pay $150 today for that security, because they look back in the rear-view mirror, decide that it ‘always goes up’ over time, and convince themselves that expected future returns are always positive, then you’ve got a bubble. Discounting the future $100 cash flow of the security using any positive expected return would produce a price less than $100. So the positive returns expected by investors are inconsistent with the returns that would equate price with discounted cash flows. The size of the bubble is the fraction of the market price that represents expectational ‘hot air.’
– John P. Hussman, Ph.D., How to Spot a Bubble, March 15, 2021
The word “bubble” gets tossed around quite a bit. Usually, it comes in the form of verbal arguments about whether prices have advanced to a point that’s “too high” in some sense.
We can do much better than that. A bubble is a mathematical object.
As I’ve observed in other speculative episodes over past four decades, bubbles are generated when investors drive valuations higher without simultaneously adjusting their expectations for future returns lower. That is, investors extrapolate past returns based on price behavior, even though the resulting expectations about future returns are inconsistent with the returns that would equate price with discounted cash flows.
Suppose you buy a stock and hold it for one year, expecting to earn some return, call it k%. Over the year, you also receive a “cash flow” – in this case a dividend, or buyout proceeds, or whatever the security throws off, and the price is of course reduced by that amount on the date the stock goes ex-dividend.
In your head, you expect the price to obey an equation that looks something like:
Price = (1+k) x Last Price – Cash Flow
But here’s the thing. Mathy people may recognize that the solution to an equation like this actually has two pieces. One is called a “particular solution,” and in this case, we can write it as a “fundamental value”:
F = All future cash flows, discounted to present value at the expected long-term return k
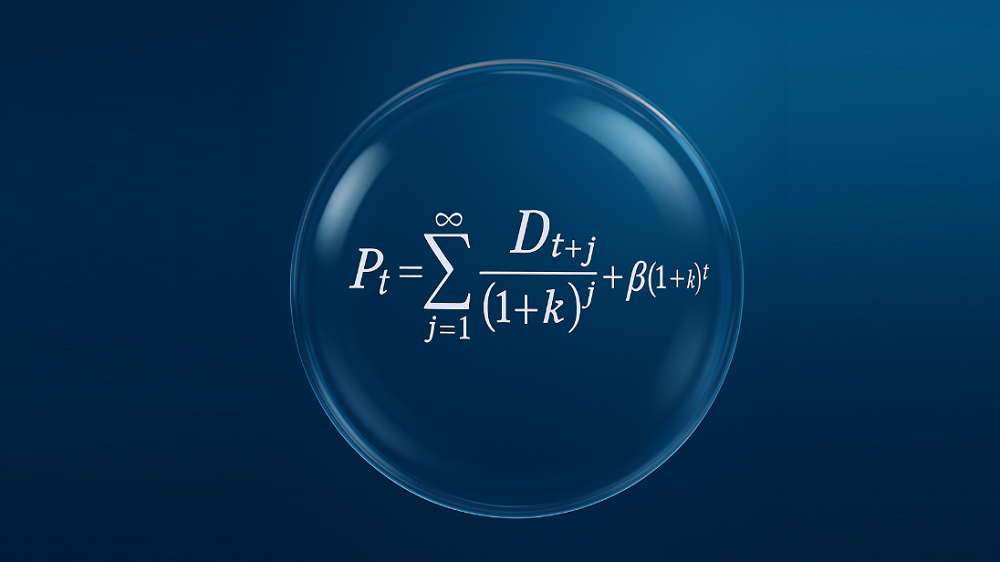
The other part is what’s called a “homogeneous solution,” and we can write it as a “bubble term” that looks something like:
B = (1+k) Last B
So what we actually get is:
Price = Fundamental Value + Bubble Term
That’s what Modigliani meant when he wrote “I can show, really precisely, that there are two warranted prices for a share.”
Now, economists typically assume that investors are wise enough to rule out infinite bubbles (technically, called a “transversality condition”). When investors fail to do that, bad things happen. At the March 2000 peak, Modigliani’s mathy discussion beautifully foreshadowed what was about to happen in the real world: “once you are convinced that it is not growing anymore, nobody wants to hold a stock because it is overvalued. Everybody wants to get out and it collapses, beyond the fundamentals.” That, in a nutshell, is how the Nasdaq 100 could go on to lose 83% of its value by October 2002.
See, the problem is this. Unless the Bubble Term is able to become exponentially larger forever – it shows up as a growing gap between the long-term return that investors expect in their heads, and the long-term return that investors can actually expect based on the future cash flows that will ultimately be delivered into their hands.
In my April 2000 discussion of this problem, I wrote, “The only question is how long it takes for the gap between price and fundamentals to become intolerably wide. As we’ve seen, it can take a long time. But once the bubble psychology breaks, that gap can close with sickeningly great speed. As we noted last month, the plunge in the Nasdaq may be muted from 83% to just 65% or so, given several years for revenues to catch up.”
As it turned out, the tech-heavy Nasdaq 100 went on to lose an implausibly precise 83% by October 2002.
On Wall Street, urgent stupidity has one terminal symptom, and it is the belief that money is free. Investors have turned the market into a carnival, where everybody ‘knows’ that the new rides are the good rides, and the old rides just don’t work. Where the carnival barkers seem to hand out free money just for showing up. Unfortunately, this business is not that kind – it has always been true that in every pyramid, in every easy-money sure-thing, the first ones to get out are the only ones to get out. We’ve seen two-tiered markets before: most prominently in 1929, 1968-69, and 1972. Even at those pre-crash extremes, the S&P never sold above 20 times record earnings. The market clearly faces problems at a multiple of 32. Technology stocks will ultimately fare worse. Over time, price/revenue ratios come back in line. Currently, that would require an 83% plunge in tech stocks (recall the 1969-70 tech massacre). If you understand values and market history, you know we’re not joking.
– John P. Hussman, Ph.D., Hussman Investment Research & Insight, March 7, 2000
Gauging the Bubble Term
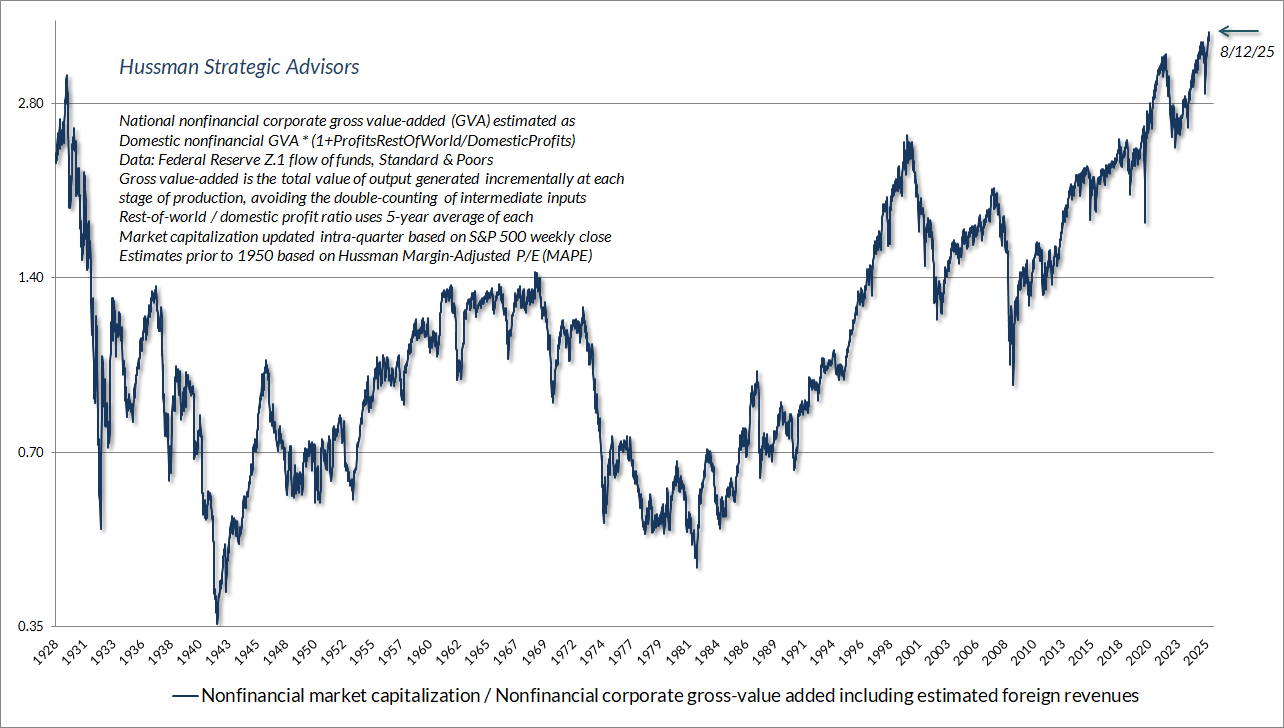
The chart below shows our most reliable gauge of market valuations in data since 1928: the ratio of nonfinancial market capitalization to gross value-added (MarketCap/GVA). Gross value-added is the sum of corporate revenues generated incrementally at each stage of production, so MarketCap/GVA might be reasonably be viewed as an economy-wide, apples-to-apples price/revenue multiple for U.S. nonfinancial corporations.
The current level of valuations is the highest in U.S. history, easily exceeding both the 1929 and 2000 extremes. While the S&P 500 has advanced just over 5% since February, when the previous record was set, we’ve done just fine. Again, we definitely prefer market fluctuation to a diagonal, hypervalued advance, but nothing in our discipline relies on a collapse.
Now, one might argue that profit margins are at record highs, and that we’re now in a “new era” economy where these elevated profit margins will be permanent. In the next section, I’ll discuss why that argument may not be wise, but for true believers, it’s enough to note that even if we assume that current record profit margins are permanent, valuations still rival the most extreme levels in history.
You can see this in the chart below. The red line shows the ratio of the S&P 500 to analyst estimates of year-ahead “forward operating earnings.” This “forward P/E” is often preferred by Wall Street because it ignores bad stuff like “nonrecurring” losses. This earnings measure isn’t even defined under Generally Accepted Accounting Principles (GAAP), and because it only came into use in the 1980’s, there’s no history for forward operating earnings before that time.
Fortunately, it turns out that we can easily proxy the S&P 500 forward P/E with the Shiller cyclically-adjusted P/E (CAPE). The relationship isn’t one-to-one, since the forward multiple is generally far lower than the CAPE, which is based on trailing 10-year earnings. But the current level of the CAPE does capture the elevated profit margins of the past decade. So if you believe that profit margins will remain at record levels forever, this is the valuation measure that you may want to use. That’s fine. We don’t rely on this choice either.
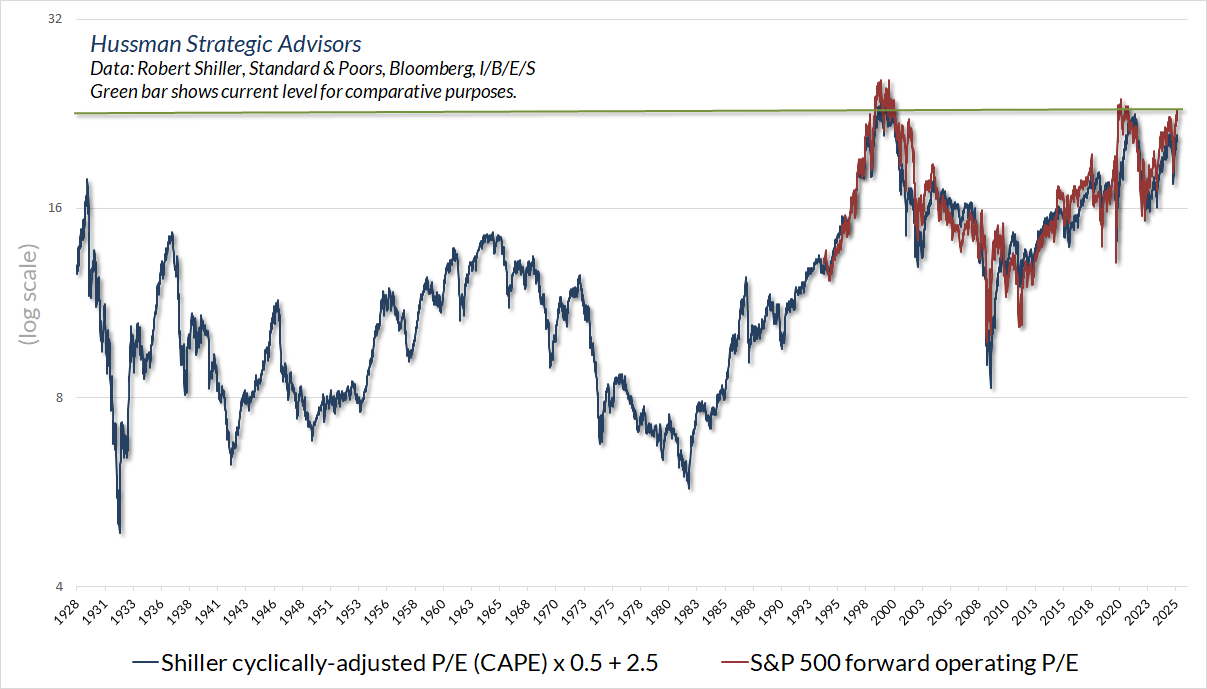
As for GAAP earnings, the S&P 500 currently trades at 29 times record trailing earnings. At the 2000 peak, that multiple reached 32. So again, extreme valuations aren’t an artifact of using any single measure. Some are more reliable than others, because their denominators tend to be more representative of subsequent cash flows (which is why we prefer MarketCap/GVA), but even if one assumes that current extreme profit margins will be permanent, the current situation rivals the most hypervalued extremes in history.
The future returns in investors heads
A reliable valuation gauge is nothing but shorthand for a proper discounted cash flow analysis. As I’ve detailed across decades of market commentaries, the valuation gauges we use are faithful to that requirement. So, valuations offer beautiful intuition about the growing gap between the future returns in investors heads, and the future returns that one would project based on discounted cash flows.
What returns do investors have in their heads here? Based on the 2025 Natixis Survey of investors with more than $100,000 in assets, investors expect returns of “10.7% above inflation over the long term.” And while financial advisers suggest that investors should temper their expectations about after-inflation returns, these same advisers “suggest that a more attainable target would be around 8.3%.”
That 8.3% figure is even more disturbing than the returns that investors expect. Assuming a 2% inflation rate, it means that even financial advisers, who presumably should know better, are assuming normal, average, historically run-of-the-mill future returns of just over 10% annually, despite the highest valuations in history. They aren’t making any adjustment at all.
Now recall our defining feature for how a speculative bubble works:
Bubbles are generated when investors drive valuations higher without simultaneously adjusting expectations for future returns lower. In other words, the defining feature of a bubble is inconsistency between expected returns based on price behavior and expected returns based on valuations. The “Bubble Term” measures the gap between the two.
Unless the Bubble Term is able to become exponentially larger forever – it shows up as a growing gap between the long-term return that investors expect in their heads, and the long-term return that investors can actually expect based on the future cash flows that will ultimately be delivered into their hands.
Mathematically, that means that prices have to continually grow faster than fundamentals, in order to juice total returns by the “extra” amount that isn’t delivered by future cash flows. As a result, sustaining the bubble requires valuation multiples to increase forever, without any upper bound. The reason the current bubble feels so good to investors is that, up until the present moment, valuation multiples have done exactly that.
The chart below shows precisely what this looks like in real-world data. The blue line in the chart below shows the estimated 12-year S&P 500 total return that we project based on our most reliable valuation gauge – MarketCap/GVA. We get somewhat less extreme loss projections from less reliable measures, but the overall profile is much the same. The red line shows actual subsequent 12-year S&P 500 average annual nominal returns across a century of market cycles.
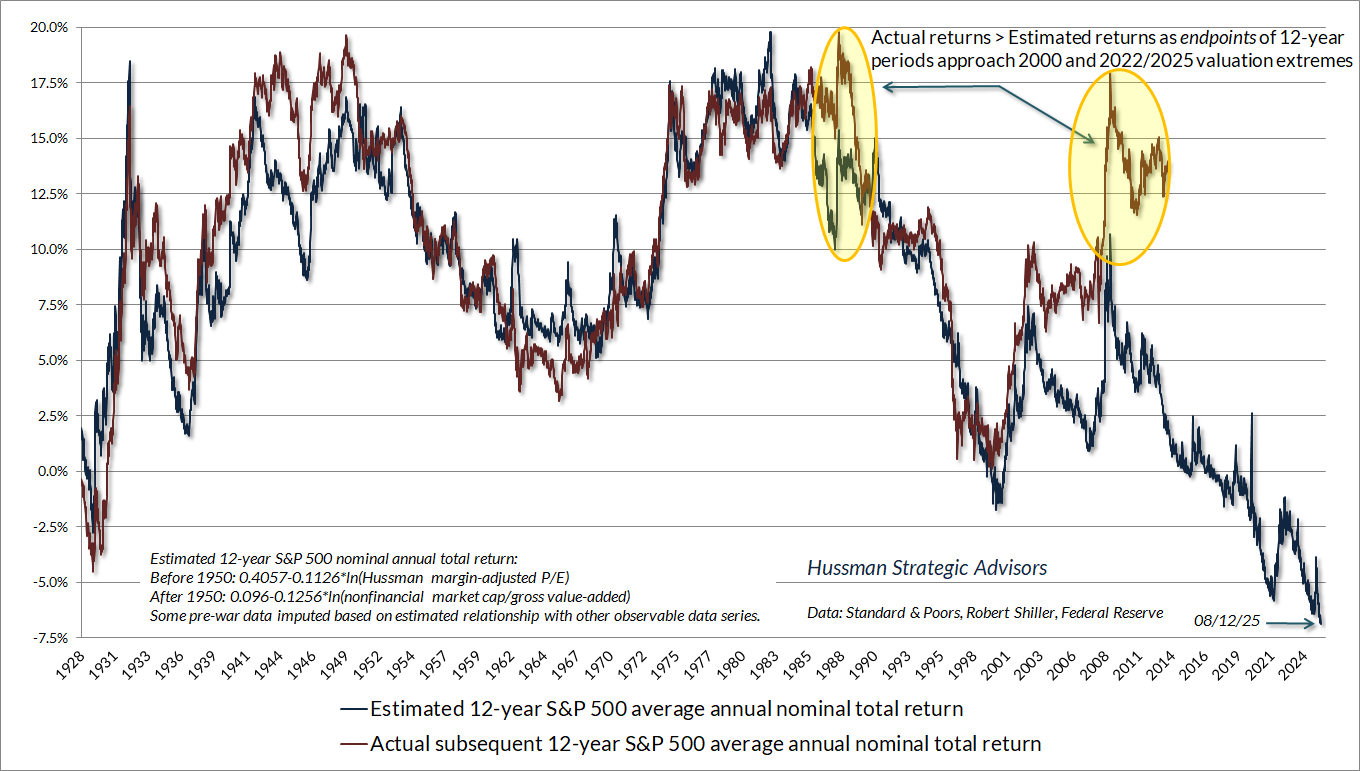
Notice, as usual, that anytime the end of the 12-year horizon lands at bubble valuations (as the 1998-2000 horizon did, and recent 12-year horizons have), actual returns over those 12-year horizons will be substantially above the returns that one would have estimated at the beginning of those horizons.
That’s just arithmetic. The actual total return of the S&P 500 for any given holding period has three pieces: the annual growth in fundamentals F, the annualized change in valuations (Price/F) during the holding period, and the average dividend yield during that period.
Over the past 10, 20 and 30 years, nominal GDP, S&P 500 revenues, and corporate gross value added have grown by only about 4.5% annually. Suppose that growth continues. The current S&P 500 dividend yield is only about 1.2%. So if valuations can remain at current extremes forever, the expected return arithmetic says 4.5% + 1.2% = 5.7% nominal.
If valuations decline to some lower level over a period of T years, the effect is to reduce total returns during that T-year horizon by (future V / current V)^(1/T)-1. For example, a decline in MarketCap/GVA from the current extreme of 3.7 to a level no lower than the 2000 peak of 2.5, would lower 10-year total returns by (2.5/3.7)^(1/10)-1 = -3.8%. The resulting 10-year nominal total return estimate then becomes 5.7%-3.8% = 1.9% annually, and even less in real terms assuming inflation is positive. That’s not a theory, it’s just arithmetic. The only issue is whether investors assume the bubble will be permanent.
Now suppose there’s a sort of compromise, where investors eventually become willing to lower their return expectations – so that valuations don’t need to keep setting fresh highs forever, but without the need for valuations to collapse. Here’s the problem: in order to permanently maintain the valuation extremes that are already in place, investors would have to reduce the long-term return expectations in their heads all the way down to the long-term expectations that would equate price with discounted cash flows.
Currently, that means that investors would need to be comfortable holding stocks indefinitely, at the highest valuation levels in U.S. history, while fully understanding that they imply long-term returns in the ballpark of only 5.7%. That’s a bitter pill to swallow, and that’s why bubbles crash. In order to restore historically run-of-the-mill expected returns, valuations would need to retreat toward their own run-of-the-mill norms. The blue line in the chart above shows the estimated 12-year S&P 500 total return that would be consistent with that outcome. That estimated return is now more negative than at any point in market history.
In 2000, an investor might have looked back on the spectacular returns of the S&P 500 over the previous 10-18 years, close to 20% annually, imagining that those returns could be extrapolated into the future. Yet as I wrote at the time, our own projections of decade-ahead S&P 500 total returns were negative, based on measurable, observable extremes in our most reliable valuation measures. Those estimates ultimately proved to be correct. The gap between positive backward-looking returns and negative forward-looking returns in 2000 was a reflection of a Bubble Term. The same sort of gap exists today.
What’s taken so long?
There are two factors that have conspired to extend this bubble even beyond those that ended in 1929 and 2000. They’ve gone hand in hand, in to some extent have been self-reinforcing.
First, it’s clear that years of zero-interest policy from the Federal Reserve fueled psychology among investors that “there is no alternative” (TINA) but to speculate. As the Fed took interest-bearing Treasury securities out of the market and onto its own balance sheet, it replaced those securities with zero-interest Fed liabilities (currency, bank reserves, and funds on reverse-repo) that someone had to hold at every moment in time. Since 1950, the amount of Fed liabilities had never exceeded 10% of GDP. From 2008 to 2022, the Fed took that percentage from just under 6% of GDP to a wild-eyed, deranged 32% of GDP by early 2022. The Fed has gradually tapered that back to about 22% today.
Someone in the economy is holding those Fed liabilities (mainly banks and money market funds), though the interest rate on Fed liabilities is no longer zero. Before 2008, interest rates stayed above zero naturally, because the Fed limited its liabilities, so banks would pay money to each other (the “Fed Funds” rate) to get the reserves. These days, the economy is so flooded with Fed liabilities that the Fed needs to hold up interest rates artificially – by directly paying interest to banks, in order to keep short-term rates above zero.
Specifically, the Fed is currently paying 4.4% annually to banks on $3.3 trillion in reserves, and implicitly pays the same interest rate to money-market funds on about $350 billion in “reverse-repos” (down from $2.3 trillion in 2022). It does so by spending all the interest it receives on its holdings, and booking a liability called “earnings remittances due to the Treasury” (currently about $240 billion) that the Fed plans to repay out of future interest it recieves on its asset holdings. There’s also about $2.4 trillion of currency in circulation, which you’ll find in your wallet with “Federal Reserve Note” printed at the top.
All of this is the stuff that talking heads on TV call “cash on the sidelines,” imagining that at any moment, some buyer will somehow put it “into” the stock market without a seller taking it right back “out.” They believe this because nobody has explained to them how equilibrium works. That “cash” will, and must, continue to be held by someone, as cash, until and unless the Fed retires it by shrinking its balance sheet, at which time investors, in aggregate, will hold Treasury securities instead.
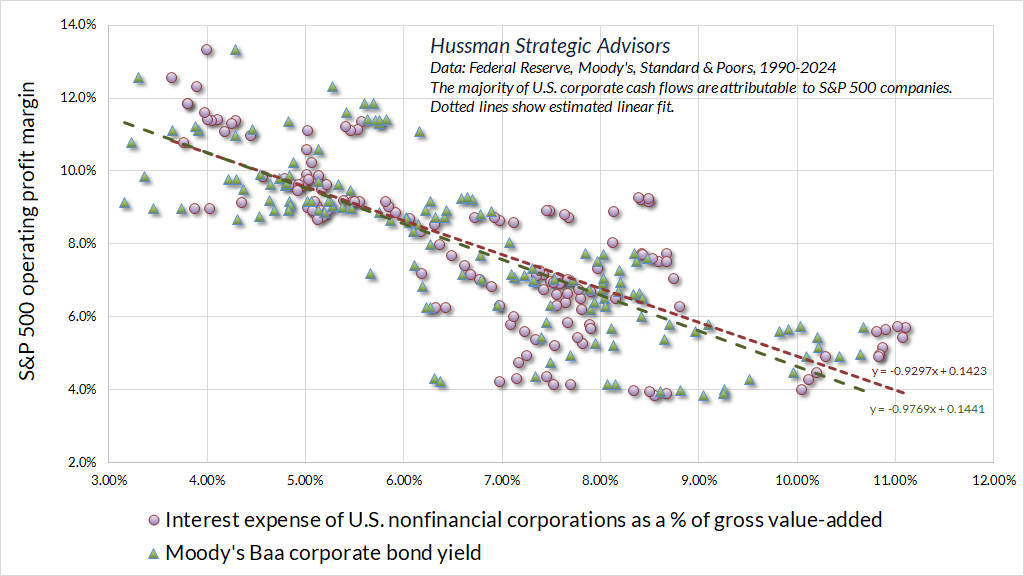
So one of the factors that extended this particular bubble was zero-interest policy. It did two things. First, it encouraged investors to drive stock prices higher (implicitly driving future long-term stock market returns lower, to levels better aligned with the near-zero returns on bonds). But given that the total debt of U.S. nonfinancial corporations is nearly the size of their annual gross-value added (revenues), every 1% drop in corporate interest rates reduced debt servicing costs, and propped up profit margins by that same 1%. Moreover, corporations were able to refinance that debt at the interest rate lows of 2020 and 2021, which is only now just beginning to be refinanced at higher rates.
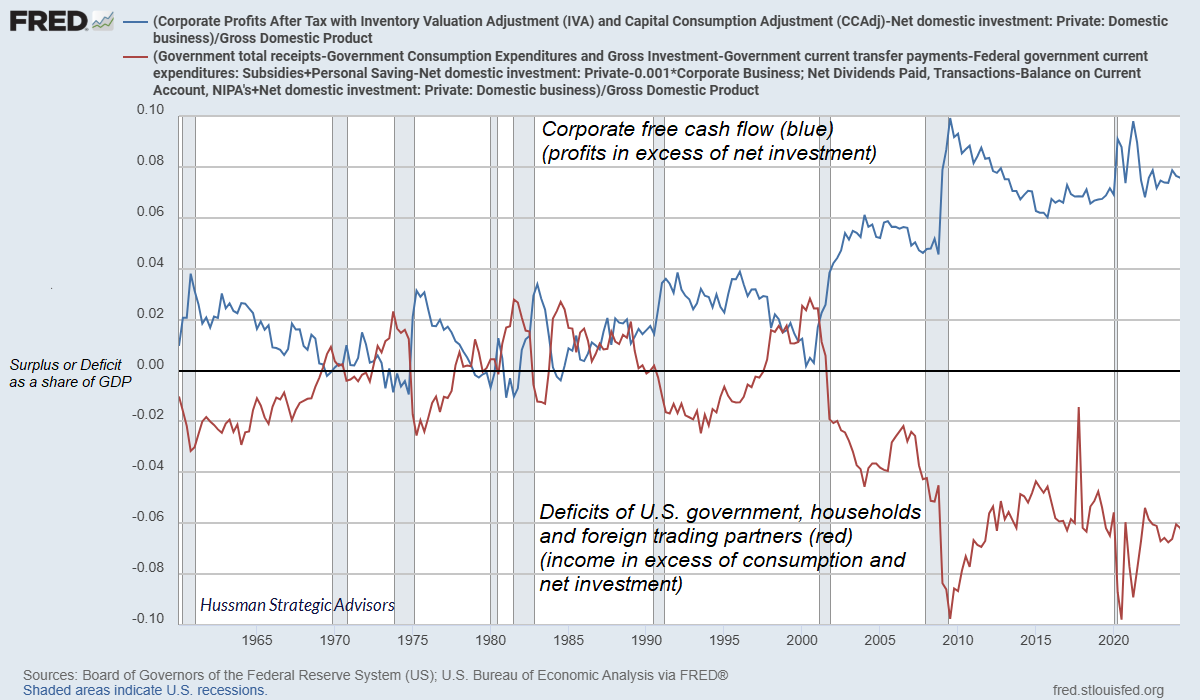
Now look at fiscal policy. As I’ve noted before – equilibrium again – anytime one sector runs a deficit (consumption and net investment over-and-above income), some other sector must run a surplus (income over-and-above consumption and net investment). That’s not a theory. It’s just an accounting identity. That accounting identity has played out in real time in ways that investors don’t seem to fully recognize.
Specifically, as government deficits exploded in recent years – particularly resulting from a combination of tax cuts and pandemic spending – corporate free cash flows also exploded. They had to. This wasn’t because of some new-era productivity boom. It was because of equilibrium. It’s just an accounting identity. But it creates a situation where perpetually extreme corporate earnings now rely on perpetually extreme government deficits. They are mirror images of each other.
All of this came together as a huge “free-money” extravaganza. As government deficits expanded over the past decade, the Fed bought the debt securities issued by the Treasury and replaced them with zero-interest cash. The effect was double-barreled: the government deficits and zero-interest rate policies boosted corporate profits, and raised the valuation multiples that investors were willing to pay for those profits – which lowers future returns, whether investors understand that consequence or not.
Although interest rates are no longer at zero, the massive corporate debt refinancing in 2020-2021 has delayed the impact of the “liftoff” from zero rates. The current bubble extreme rests at the very top of that house of cards. Put simply, investors now rely on an ever-expanding Bubble Term that was driven by “free money” monetary and fiscal policies that will not only have to persist – but will have to expand without limit in order to sustain that Bubble Term.
As government deficits expanded over the past decade, the Fed bought the debt securities issued by the Treasury and replaced them with zero-interest cash. The effect was double-barreled: the government deficits and zero-interest rate policies boosted corporate profits, and raised the valuation multiples that investors were willing to pay for those profits – which lowers future returns, whether investors understand that consequence or not.
It’s important to constantly emphasize that nothing in our discipline requires a market collapse, mean-reversion in valuations, a retreat in profit margins, or an end to deranged monetary interventions or fiscal free-for-alls. Our discipline is to align our investment stance in response to measurable, observable market conditions – primarily valuations and market internals – as they change over time. Our September 2024 hedging implementation added a fresh degree of freedom, allowing us to vary our investment stance even amid the most extreme market conditions. We do benefit from market fluctuation, but in my view, little beyond that is necessary. No forecasts or scenarios are required.
Still, from the standpoint of valuations, a century of market history, the economics of equilibrium, and just plain arithmetic, my own take is simple: I expect this bubble to end in tears.
Geek’s Note
For readers and former students who want to trace the math explicitly, we can use a constant growth assumption to simplify the analysis. Suppose our security throws off deliverable cash flows \(D_t\) into the hands of investors. We can define the whole setup like this:
- Deliverable cash flows grow at rate \(g\): \(D_t = D_0(1+g)^t\), so \(D_{t+1} = D_1(1+g)^t\) with \(D_1 \equiv D_0(1+g)\).
- Let \(k_h\) be the expected return in investors heads, which they enforce through their own speculative behavior.
- Then: \( P_t = (1+k_h)P_{t-1} – D_t\), or equivalently, \( (1+k_h)P_{t} = P_{t+1} + D_{t+1}\) (with \(k_h>g\)).
The general solution for the market price includes both a “fundamental” discounted cash flow term and a bubble term that grows exponentially
The general solution is the sum of the particular (fundamental) solution and the homogeneous (bubble) solution:
\[
F_t(k_h) = \sum_{j=1}^{\infty} \frac{D_{t+j}}{(1+k_h)^{\,j}}
= \frac{D_{t+1}}{k_h – g}
\]
\[
P_t = F_t(k_h) + \beta(1+k_h)^t,\ \ \beta>0.
\]
Define the “fundamental” rate of return as the return that equates the observed price with discounted cash flows
Define \(k_{f,t}\) as the discount rate, at time \(t \), that would justify the prevailing market price \(P_t\) on the basis of future cash flows alone (without relying on an infinitely expanding bubble). In other words, \(k_{f,t}\) is the future long-term return that investors can expect if they pay the market price at time \(t \) and then receive deliverable cash flows \(D \) into the infinite future. This works out to be just the growth rate g plus the prevailing dividend yield:
\[
P_t = F_t(k_{f,t}) = \frac{D_{t+1}}{k_{f,t} – g}
\quad\Longrightarrow\quad
k_{f,t} = g + \frac{D_{t+1}}{P_t}.
\]
A bubble term, in contrast, requires investors to pay real money today for a dollar that will be received infinity from now, with no cash flows underneath. Economists generally assume that investors are wise enough not to rely on an infinite chain of “greater fools,” who are willing – one after another – to do that. The condition that rules that out is called a “transversality condition”:
\[
\lim_{T\to\infty}\frac{P_{t+T}}{(1+k)^T}=0.
\]
This condition forces the bubble term to zero, and is equivalent to setting \(k_h = k_f\) so investors price the security strictly on the basis of future discounted cash flows. In contrast, if the return that investors expect in their heads \(k_h\) is greater \(k_f\), and their speculative behavior reinforces and validates that expectation, you’ve got a bubble on your hands.
In order to sustain the higher rate of return in investors’ heads \(k_h > k_f\), bubble valuations would need to increase without limit
Using the decomposition for \(P_t\),
\[
\frac{P_t}{D_{t+1}}
= \frac{1}{k_h – g} + \frac{\beta}{D_1}\left(\frac{1+k_h}{1+g}\right)^{t}.
\]
Since \(k_h>g \Rightarrow \tfrac{1+k_h}{1+g} > 1\), and because \(\beta>0\),
\[
\frac{P_t}{D_{t+1}} \xrightarrow[t\to\infty]{} \infty.
\]
The intuition here is straightforward. Cash flows discounted at \(k_h\) contribute only the constant term \(\tfrac{1}{k_h-g}\) to the valuation multiple. In order to generate the return \(k_h\) in investors heads, the bubble has to supplement deliverable cash flows with ever-larger speculative gains, forcing valuation multiples to grow without bound. Not just prices, but valuation multiples.
The only way to avoid that without a collapse is for investors to lower their long-term return expectations \(k_h\) all the way down to \(k_{f,t}\). In that case, the bubble term immediately vanishes, because the moment investors lower their expectations, \(P_t = F_t(k_{f,t})\) and the new homogeneous component becomes zero. Unfortunately, this means that behaviorally, despite this huge lowering of expectations, investors have to be willing to hold valuations — to use Irving Fisher’s famously disastrous 1929 phrase — at a “permanently high plateau,” while accepting the permanently depressed long-term returns that these elevated valuations imply. The repeated collapse of speculative bubbles across history suggests that this may be too much to expect.
Keep Me Informed
Please enter your email address to be notified of new content, including market commentary and special updates.
Thank you for your interest in the Hussman Funds.
100% Spam-free. No list sharing. No solicitations. Opt-out anytime with one click.
By submitting this form, you consent to receive news and commentary, at no cost, from Hussman Strategic Advisors, News & Commentary, Cincinnati OH, 45246. https://www.hussmanfunds.com. You can revoke your consent to receive emails at any time by clicking the unsubscribe link at the bottom of every email. Emails are serviced by Constant Contact.
The foregoing comments represent the general investment analysis and economic views of the Advisor, and are provided solely for the purpose of information, instruction and discourse.
Prospectuses for the Hussman Strategic Market Cycle Fund, the Hussman Strategic Total Return Fund, and the Hussman Strategic Allocation Fund, as well as Fund reports and other information, are available by clicking Prospectus & Reports under “The Funds” menu button on any page of this website.
The S&P 500 Index is a commonly recognized, capitalization-weighted index of 500 widely-held equity securities, designed to measure broad U.S. equity performance. The Bloomberg U.S. Aggregate Bond Index is made up of the Bloomberg U.S. Government/Corporate Bond Index, Mortgage-Backed Securities Index, and Asset-Backed Securities Index, including securities that are of investment grade quality or better, have at least one year to maturity, and have an outstanding par value of at least $100 million. The Bloomberg US EQ:FI 60:40 Index is designed to measure cross-asset market performance in the U.S. The index rebalances monthly to 60% equities and 40% fixed income. The equity and fixed income allocation is represented by Bloomberg U.S. Large Cap Index and Bloomberg U.S. Aggregate Index. You cannot invest directly in an index.
Estimates of prospective return and risk for equities, bonds, and other financial markets are forward-looking statements based the analysis and reasonable beliefs of Hussman Strategic Advisors. They are not a guarantee of future performance, and are not indicative of the prospective returns of any of the Hussman Funds. Actual returns may differ substantially from the estimates provided. Estimates of prospective long-term returns for the S&P 500 reflect our standard valuation methodology, focusing on the relationship between current market prices and earnings, dividends and other fundamentals, adjusted for variability over the economic cycle. Further details relating to MarketCap/GVA (the ratio of nonfinancial market capitalization to gross-value added, including estimated foreign revenues) and our Margin-Adjusted P/E (MAPE) can be found in the Market Comment Archive under the Knowledge Center tab of this website. MarketCap/GVA: Hussman 05/18/15. MAPE: Hussman 05/05/14, Hussman 09/04/17.