

The Free Money Bubble


John P. Hussman, Ph.D.
President, Hussman Investment Trust
November 2026
We have been just going like a house afire, and we couldn’t see any reason why we shouldn’t keep right on burning. Our tastes were acquired on credit, and we wanted to keep on enjoying ‘em on credit. Everything was going into a gopher hole and you couldn’t see where you was going to get any of it back.
– Will Rogers, January 1931, in the midst of the Great Depression
I should begin this comment by observing it’s a bit delayed. Frankly, it’s been difficult to settle on a topic when we no longer care which direction the market is headed. Don’t get me wrong – I absolutely believe that the U.S. equity market is in a speculative bubble that will end in tears, ultimately losing perhaps 70% from current levels. Meanwhile, everything that we do in the current market environment must be done with a safety net.
Yet since our “roses and garbage” insight earlier this year, we’ve had a locally constructive tilt about 20% of the time, meaning that we tend, in those periods, to benefit from market advances even with a safety net in place. That’s been enough to do quite nicely since early-May (see our May comment More Roses Amid Garbage and Trap Doors), even while the S&P 500 has advanced and our average beta has been negative.
On this point, it’s very important to understand what our investment discipline is intended to do. Yes, our objective is absolutely to achieve strong “standalone” returns over time, particularly over complete market cycles. But even in a hyperextended bubble, our intent is to enhance the diversification and return/risk profile of investors who trust our value-conscious, historically-informed, risk-managed discipline.
It’s always been true, but painfully evident in recent years, that investors by-and-large have a limited understanding of the word “portfolio”. Specifically, they seem to treat portfolio construction as an effort to collect a group of investments that have high backward-looking standalone performance. But for any particular choice of risk-tolerance, that’s not the way you choose a portfolio. As I noted in June, it’s necessary to think about how portfolio components interact. That’s particularly true today, when many investment approaches are loaded on precisely the same narrow set of investment risks related to technology and artificial intelligence.
The essential feature of a useful alternative asset isn’t that it’s unusual or exotic, but that its returns aren’t tightly linked to the risks that already dominate the portfolio. The value of an alternative asset comes from the way it interacts with the other assets in the portfolio. The lower the correlation, particularly if the asset tends to hold value or advance when the rest of the portfolio is under pressure, the more the asset can improve the expected return/risk profile of the portfolio – even if the ‘standalone’ return on that asset may be low.
– John P. Hussman, Ph.D., Record Extremes, Alternative Investments, and the Hippo, June 2026
Suppose that investors allocate their assets between the market portfolio (e.g. the S&P 500) and risk-free cash equivalents, and have the opportunity to diversify into alternative asset A. If you do the math – and you can see exactly that math in the Geek’s Note of our March comment, Equilibrium and the Dentist in Poughkeepsie – you’ll find that investors looking to maximize expected return for some target level of risk will take an “active” position in security A if they believe it will provide them an “edge” – an expected return above what they would normally expect based on its sensitivity to market fluctuations.
This is true not only for an individual stock, but for any asset in the “alternative sleeve” of an investment portfolio. It holds even if the beta of the asset is negative and the market is advancing, except for portfolios carrying maximum risk, with 100% exposure to the market. The chart below shows what’s going on – it will be familiar to my former University of Michigan students – who made me proud by proving themselves fully capable of learning constrained optimization and Lagrange multipliers (you know what I’m talkin’ ‘bout, a hmm hmm hmm).
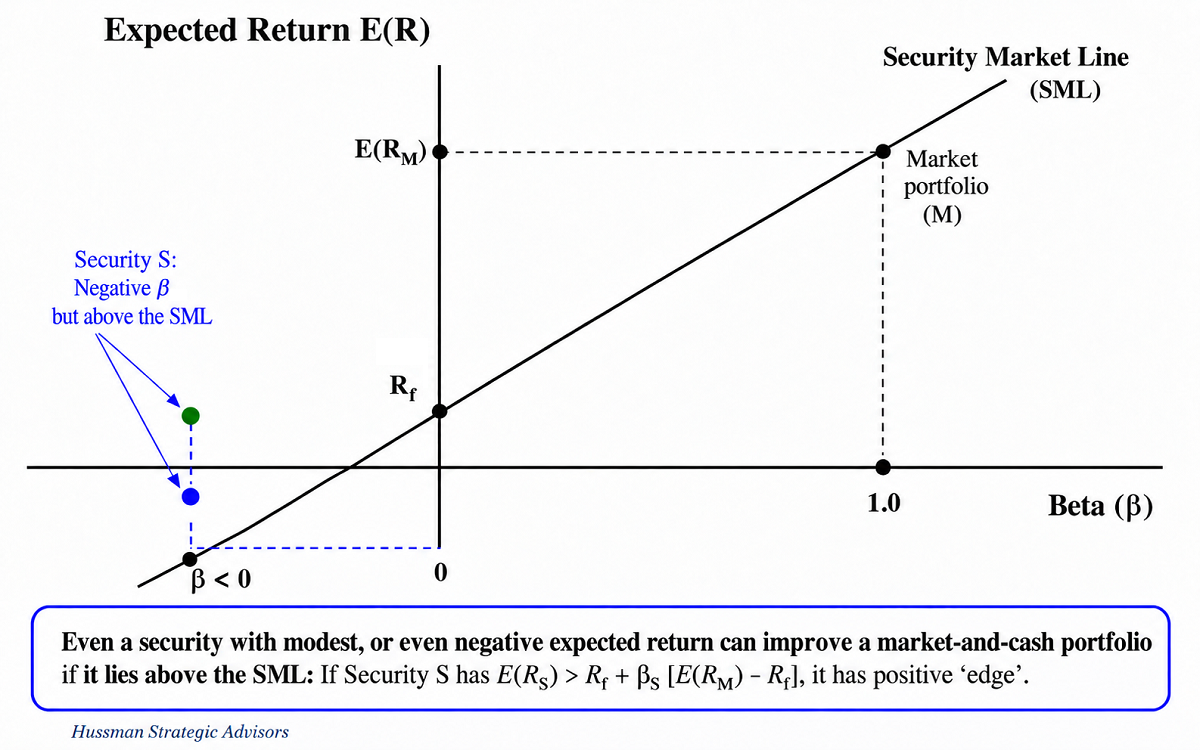
You can see real-world examples of this sort of optimization in the June comment. If one considers a 60%/40% allocation between the S&P 500 and cash equivalents (or Treasury bonds – doesn’t matter which) we find that our investment discipline picks up every bit of that cash or bond allocation in a portfolio optimization over the past 1, 3, 5, 7 and 10 years. For these periods, the lowest-risk asset allocation matching the return of a conventional 60%/40% portfolio allocation over each period typically directs between 33-42% to our discipline, and the remainder to the S&P 500.
The size of the departure from pure market/cash portfolios may be surprising, but what’s surprising to us is how few alternative investment strategies apart from our own get any weight at all. The reason is that many investment disciplines – even “conservative” or “target date” approaches – load on precisely the same narrow set of risks that dominate the market itself. If you want true diversification, your holdings shouldn’t all load on the same risk factor, and there should be some evidence to expect an “edge” – even if the market sensitivity is conservative, neutral, or even negative.
These observations go a long way to responding to the small but rather spicy little band of trolls who respond to every one of my investment-related and non-investment-related posts on social media with something along the lines of “Why aren’t you dead yet?”
Overall, yes, I continue to view the U.S. equity market as being in the late stage (if not the already-rolled-over stage) of a speculative bubble. More on that below. Still, while we view a safety net as obligatory here, we’ve already had multiple, if brief, periods when our investment stance has tilted constructive in recent months. I expect that to continue, bubble or bear market. The best way to understand all this in great detail is to read, or re-read our comments since February.
As a side note, I could have presented this greatly increased flexibility as being the result of some mathematical or analytical revelation. Certainly, we discovered that we were vastly underexploiting our September 2024 hedging implementation (see Asking a Better Question). But the essential insight earlier this year did not arrive through problem-solving or analytics, but through a kind of enlightenment – the wave recognizing that it is not different from the water – as Thich Nhat Hanh would say.
So yes, I’m quite aware that our market comments have been half dharma talk lately. The insight of nonduality keeps coming up again and again in our discussion of the financial markets. It adds something beyond what years of math, analytics, and all the data in the world could ever produce. Turns out that countless difficulties in our lives begin to dissolve – the moment we recognize the interdependent nature of things, examine causes and conditions; that this exists because that exists, release our attachment to dualistic concepts and rigid judgments, and look at things with a bit more compassion and a bit less discrimination.
The free-money bubble
The defining feature of a Ponzi scheme is that it persuades investors to pay for future cash flows that, at least in part, don’t actually exist, while creating the impression that those cash flows imply an attractive return on the price investors pay. That’s the magic of a Ponzi scheme – everything works fine as long as nobody questions that the future cash flows are a-comin’.
John P. Hussman, Ph.D., Causes and Conditions, April 2006
The greatest investment risk at the moment is the inclination to confuse the length of time a bubble has persisted with proof that a bubble does not exist.
It’s useful to look into the causes and conditions that have sustained this speculative episode for well over a decade. There are three main phases.
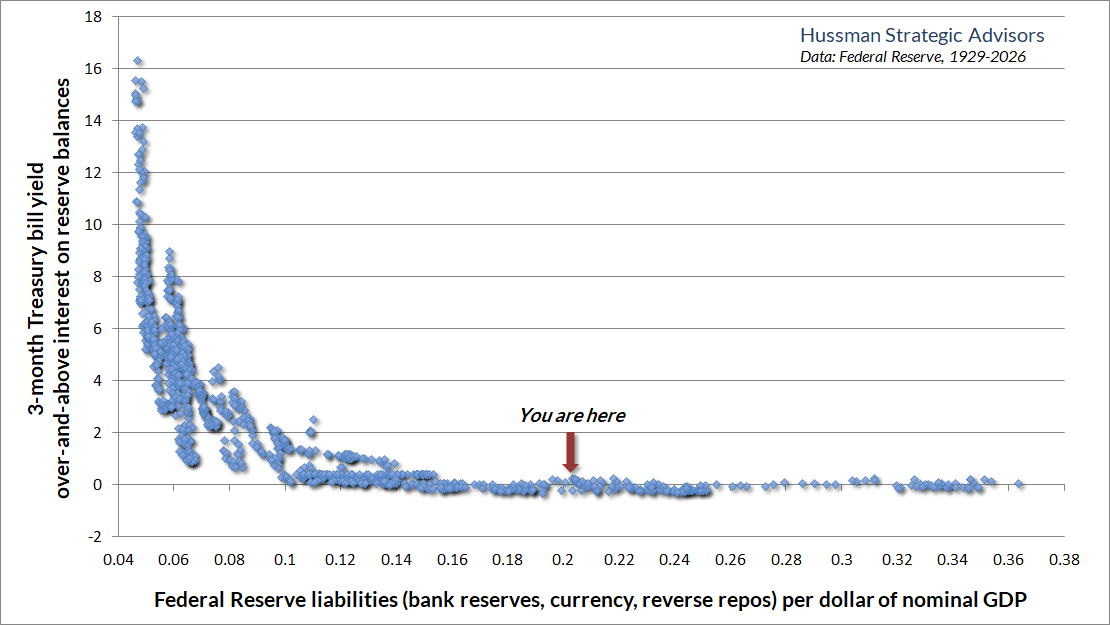
The first was deranged monetary policy (literally “outside the range of all historical experience”). Under Ben Bernanke, the Fed drove the quantity of zero-interest Federal Reserve liabilities from just 6% of GDP in 2008 (a level historically associated with T-bill rates of roughly 4-6%), beyond 10% of GDP (a level associated with T-bill rates between 0-2%), beyond 14% of GDP (at which point T-bill yields hit zero), all the way to 25% of GDP by the time his term as Fed Chair ended. The expansion continued – abetted by Janet Yellen and initially by Jerome Powell – until the quantity of zero-interest base money created by the Fed peaked at a recklessly unprecedented 36% of GDP in early 2022.
The Fed created these zero-interest liabilities through “open market purchases” of Treasury debt; taking interest-bearing Treasury securities out of the hands of investors – and replacing them with zero-interest cash (mostly held by investors indirectly, in the form of bank deposits). Somebody had to hold these zero-interest Fed liabilities, in the form of cash, at every moment in time. Cash doesn’t “turn into” something else when you use it. It just goes into someone else’s hands, someone else’s bank account. Nobody wanted the stuff, and the attempt of every successive holder to get rid of it drove U.S. equity valuations beyond even the 1929 and 2000 extremes. As the Wiggles song goes, “Hot potato, hot potato.”
The chart below is our version of what economists know as the “liquidity preference curve”, and illustrates how the level of short-term interest rates is determined by the quantity of zero or low-interest Fed liabilities that must be held by someone in the economy.
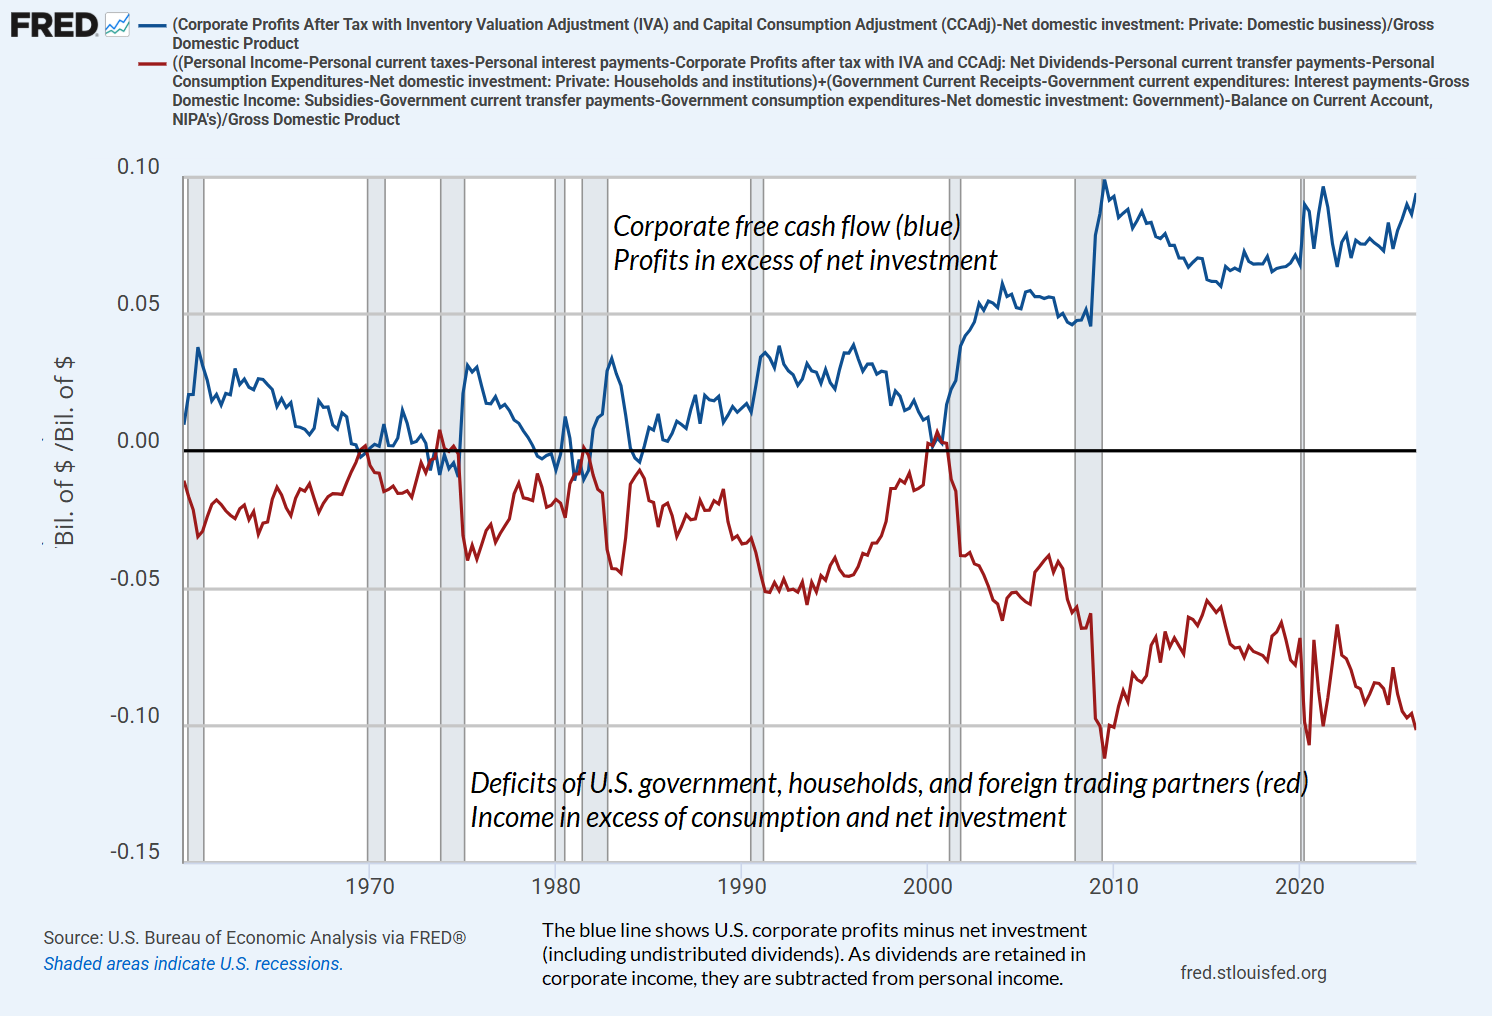
The second phase of the bubble emerged from record fiscal deficits in response to the pandemic. As I’ve detailed previously, the surpluses and deficits of all economic sectors (income over and above consumption and net investment) must add up to zero. This isn’t a theory, but an accounting identity. In practice, this means that to the extent that government, households, and foreign trading partners run a massive combined deficit, it must be true that an equivalent surplus will emerge in the corporate sector (and by extension, the 10% of U.S. households that collectively own about 87% of corporate equities). Moreover, it turns out that, in equilibrium, those new surpluses will be held precisely in the form of new liabilities that the deficit sectors issued (Treasury securities, household debt) to finance their shortfalls.
The multi-trillion deficits of the pandemic first directly subsidized corporate profits, largely through PPP subsidies, and then indirectly subsidized corporate profits as households ran down the saving that they accumulated early in the pandemic. The foreign sector actually runs a moderate surplus at present, so the imbalance between the U.S. corporate sector and the U.S. government and household sectors is actually larger than the gap on the chart below.
The central observation is that record corporate surpluses can persist precisely because government spending bridges the gap between the progressively declining share of GDP paid out as wages and salaries, and the nevertheless continuing spending needs of households on family expenses, health care, and retirement.
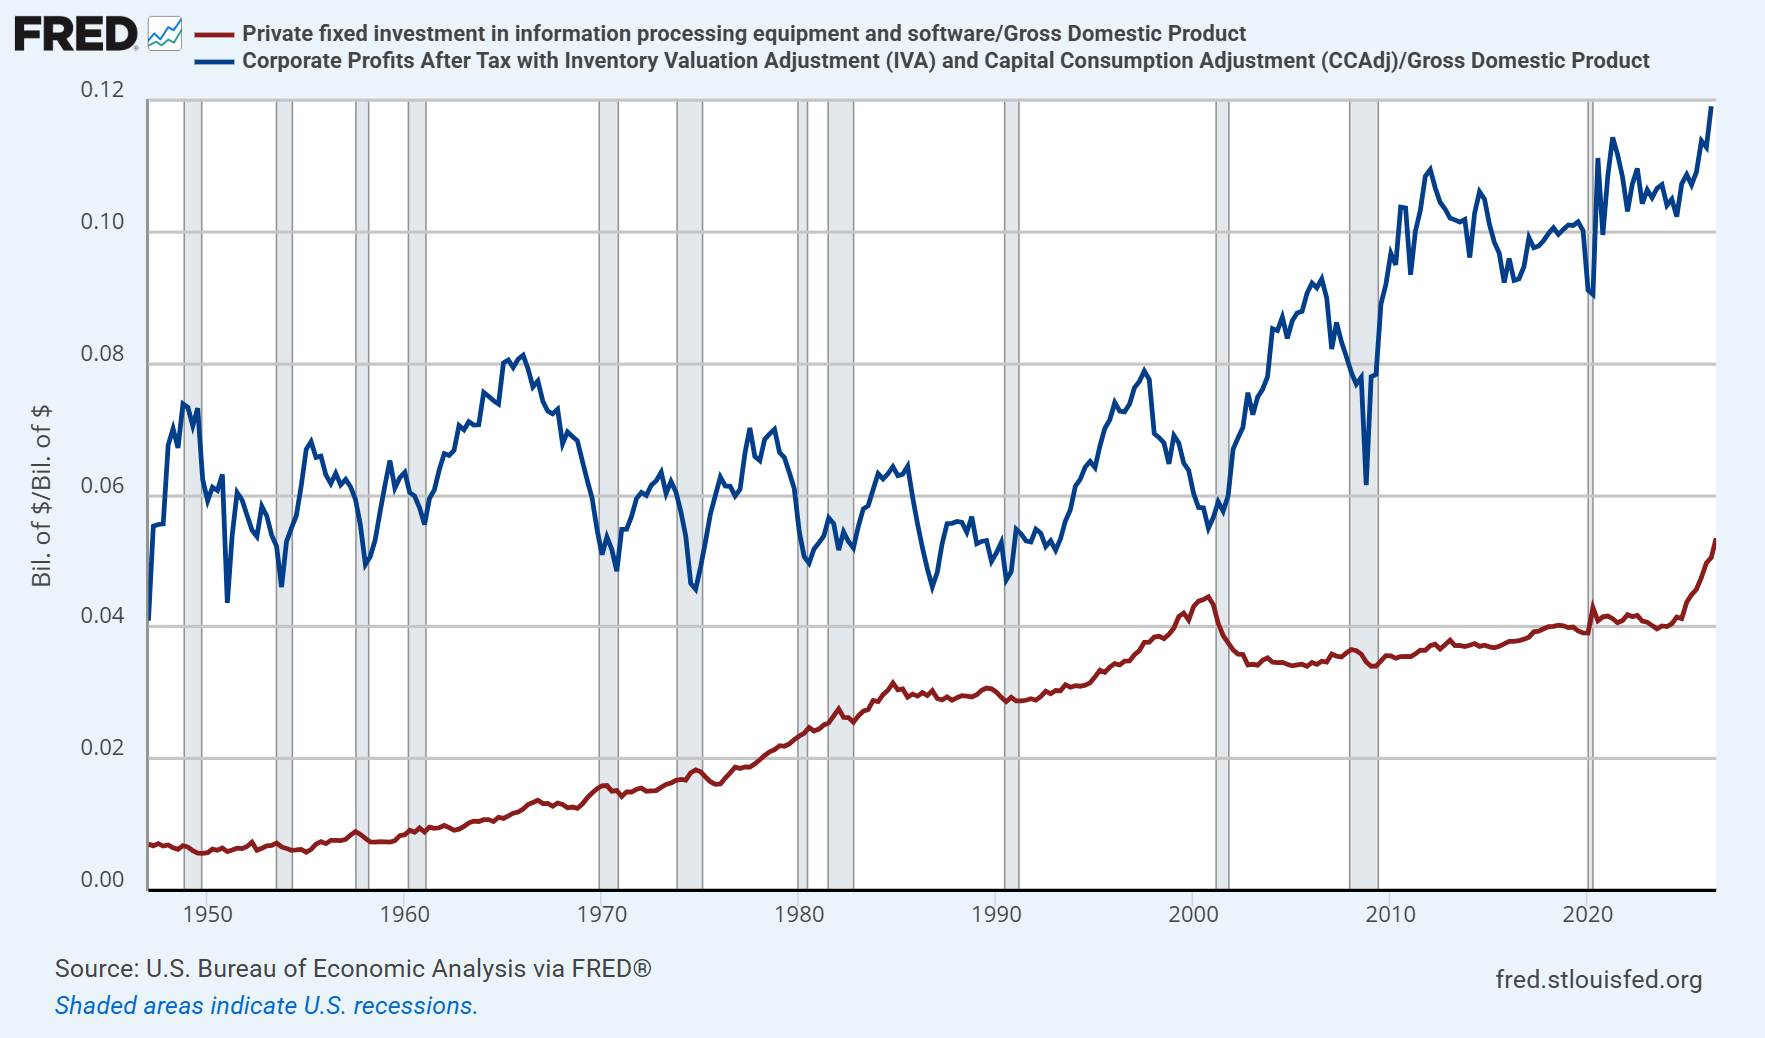
The third and most recent extension of the bubble has been driven by the near-frantic buildout of capacity in artificial intelligence. One of the interesting features of this period is that the surge in private fixed investment on information technology hasn’t been funded by a deep worsening of household and government deficits as a share of GDP, so we know immediately that corporate free cash flow (corporate profits less net investment) has also not surged as a share of GDP. The simple arithmetic is that if corporate investment is surging, but corporate free cash flow is stable, it must be that corporate profits have exploded to the same extent as investment. Put simply, the abrupt surge in economy-wide corporate profits we’ve seen since 2022 is directly linked to, and dependent on, the surge in AI investment.
On the subject of artificial intelligence, there’s no question that we’re witnessing a profound technological shift that will vastly impact every sector of the economy. The real question is the incidence of the benefits, and the incidence of the costs – who bears these?
Across history, the recurring pattern of investors and even businesses is to assume that the profits from innovation will accrue in the form of sustainable profits. That’s one of the reasons why bubbles go hand-in-hand with investment booms and new era thinking that gradually devolves into malinvestment, “swarm like” competition, and eventually speculative collapse. New technologies usually produce victors, but they also tend to leave a wasteland of overbuilt capacity. The result is that most the benefits from any new technology typically emerge as “consumer surplus” – increased supply, quality, user experience, and convenience that consumers enjoy, without businesses generating elevated profits.
The incidence of costs is also uncertain, but the central value proposition of AI, and the one that’s really driving this frantic investment buildout, is the promise of AI to disrupt the labor market – to reduce the need for, and cost of, human work. To the extent that U.S. population growth has slowed markedly over recent decades, this may not be a hard negative outcome. Yet to the extent that wage and salary income is already at a record low as a share of GDP, the natural result of reduced need for, and cost of, human work, is that people will not have incomes to afford output that might be increasingly produced using AI – unless prices decline to the same extent as wages do – again implying restrained profits.
In equilibrium, then, the only way that corporations actually stand to benefit, on balance, is if the deficits of government expand even further to bridge the gap. My impression is that’s not the direction that we will ultimately take. In my view, either the profits will be disappointing, or the dominance rents of mega-corporations will be properly treated by the tax system as returns that go far beyond normal compensation for productive innovation and risk-bearing, and instead reflect the private capture of publicly generated network effects and information content.
When we talk about profit margins, using the qualifier – ‘at the moment’ – is essential, because current profit margins are the artifact and mirror image of the deepest shortfalls across government and household sectors in history, coupled with a tax system that has not yet come to grips with nature of the unprecedented level of profits in the U.S. economy. These profits are not simply normal compensation for productive contribution and risk-bearing, but increasingly take the form of dominance rents – derived not simply from entrepreneurial innovation, but from the private capture of network effects and publicly created content (which includes not only user content on say, social media, but also uncompensated materials used in the training of AI models). Much of the potential profit of AI models, in particular, relies on exploiting the creativity and intellectual property of others, without providing any compensation.
Unlike the sort of ‘top hat and cane’ sort of monopoly we usually think of, which maximizes profit by limiting supply and elevating price, the profitability of ‘hyperscalers’ is a version of what economists call ‘natural monopoly’ – which benefits from declining marginal costs and profound economies of scale that create profits that are disproportionate to the inputs. Because it’s usually inefficient to duplicate expensive infrastructure, natural monopoly typically creates barriers to market entry by competitors (as we typically see in the utility industry). The exception is when investors are perfectly willing to throw money at a new technology, in which case we get the other extreme of duplicative and dangerously unproductive investment (as we saw in the tech bubble, then the mortgage bubble, and now in the AI space). It will take time, but this entire landscape – policy environment, ‘swarm like’ overinvestment (to use Schumpeter’s phrase), and lopsided profitability – will change. Count on it.
– John P. Hussman Ph.D., Mountain, Cliff, or Ocean, July 2026
On the question of how AI will be used, that’s still very much in our control, though recent challenges with “alignment” suggest that this control is slipping. The question of alignment is important enough that I published a special commentary on the subject: Dear Humanity – Can We Teach AI Compassion?
For most of us, the choice is simple: AI will think for us to the very same extent that we are willing to stop thinking for ourselves. The hopeful aspect here is that AI also offers a tremendous opportunity: for those of us who insist on continuing to use our intellect and discernment, to look deeply for ourselves, to and use every bit of our own effort and creativity, I expect that we’ll find AI to be a remarkable tool for extending and amplifying those capacities. In education, this is what we call “scaffolding” – we encourage the child to do as much as is absolutely possible for them to do on their own, and we offer enough support to bridge the gap that remains to reach what the child is truly capable of understanding and achieving. Lev Vygotsky called this gap the “zone of proximal development.”
By the way, If you want to read more about scaffolding, or if you’ve got friends with a special needs child or who work as educators, hop on over to one of our charitable projects: Scaffolds.org – you’ll find a deeply researched and evidence-based guide on autism I wrote called Presume Competence, and an online course we developed for the Maryland State Department of Education: Special Educator Training Modules. A very deep labor of love there, so I hope some of you will find these useful.
Returning to the financial markets, the upshot is simple. This long and hyperextended episode of speculation has endured for more than a decade because it rests on three pillars that have behaved as different versions of “free money” – first zero-interest rates and deranged Federal Reserve easing, then multi-trillion dollar pandemic deficits, and most recently a nearly frantic surge of unmitigated investment in AI capacity. I say “free money” here because none of this money is clearly attached to reliable future cash flows, except the cash flows generated by the spending itself.
It’s easy to mistake the sound of money being spent with the sound of wealth being created. But there’s a difference between prosperity that relies on money being spent, and prosperity that can be sustained because the underlying economic activity itself generates sufficient future wages and income to sustain production, spending, and consumption year after year.
Nothing in our own investment discipline relies on future market losses or economic disruptions, but my impression is that we shouldn’t rule out either. It’s not at all clear, and it’s difficult to map out an equilibrium – if one adheres to arithmetic – where household incomes are pressured lower by labor-saving technology and yet corporate profits expand faster than the economy itself, unless 1) either government deficits expand further as a share of GDP, or 2) corporations continually plow the profits they receive back into fresh net investment, so that the spending itself fuels those very profits – meaning that the profits won’t be distributable. Even the current level of profits relies on the current frantic pace of AI investment.
Valuation review
Finally, it’s important to touch on what is simultaneously the most relevant and irrelevant consideration for investors here, which is the hyperextended level of equity market valuations at which we find ourselves. This is profoundly relevant in the sense that, unless one expects record government and household deficits, coupled with frantic AI buildout, to persist forever, the unprecedented optimism of Wall Street for future profit margins and future growth is likely to be deeply disappointed over the coming decade.
For any given set of future cash flows, the higher the valuation investors pay today, the lower the long-term return investors can expect as those future cash flows are delivered into their hands over time. Presently, there’s a potential downside gap of about 70% between the current level of the S&P 500 and the level of valuations that’s actually consistent with historically run-of-the-mill expected returns of about 10% annually. The chart below updates the valuation measure we find best correlated with subsequent 10-12 year S&P 500 total returns across a century of market cycles. The peak in early October was about 4.3. The historical median is about 1.1.
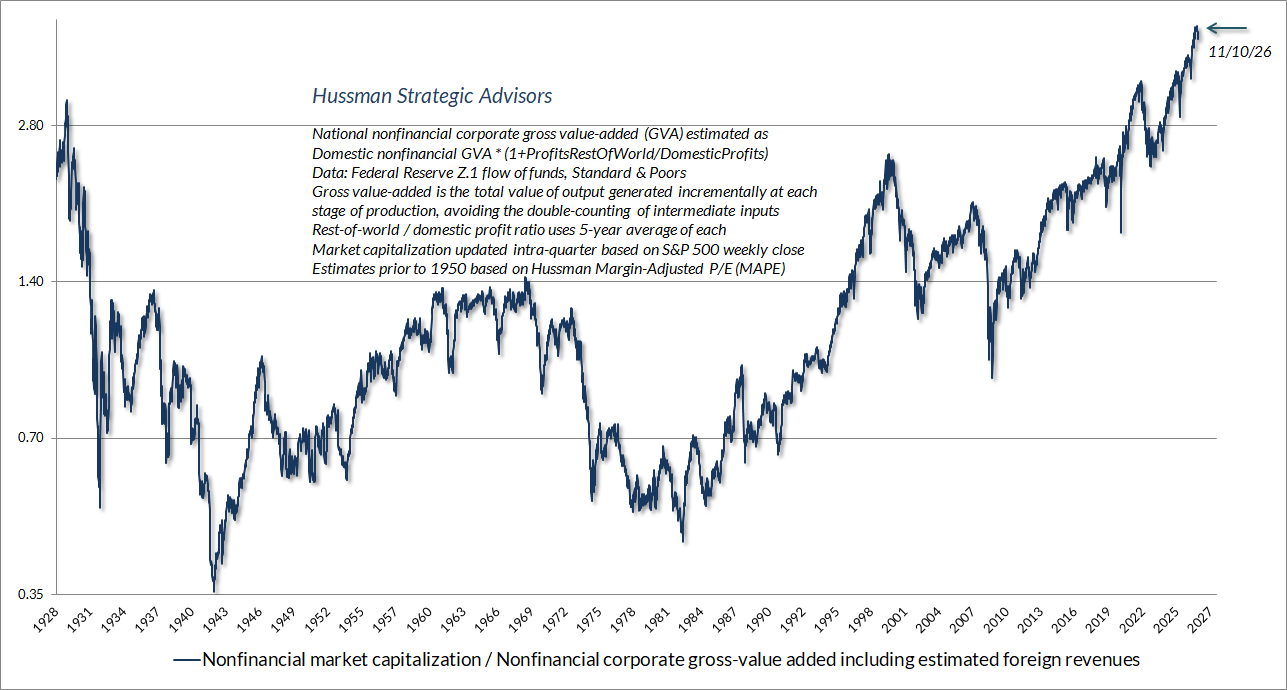
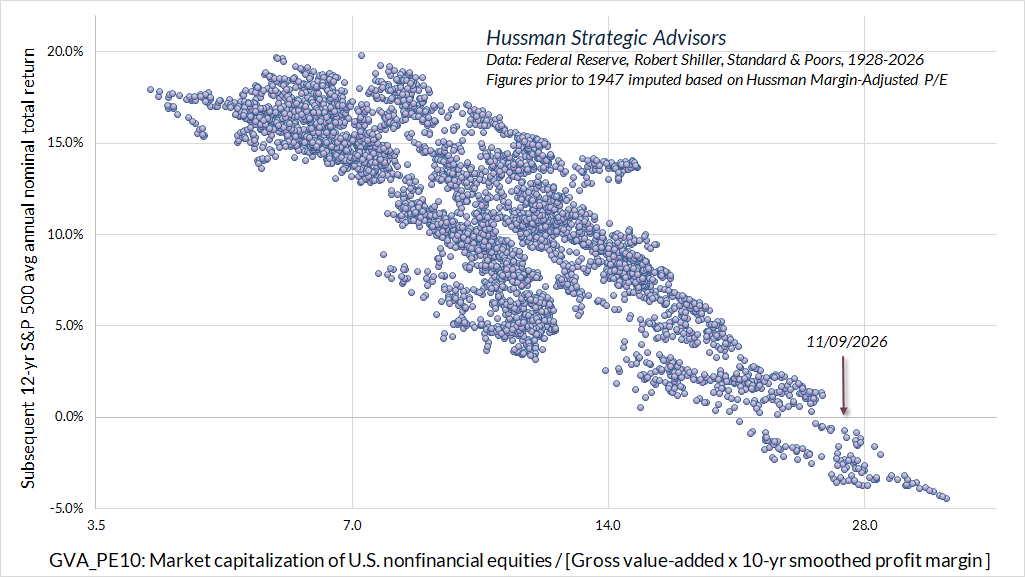
One can make the long-term outlook slightly less imposing by assuming that future profit margins will be permanently higher than they were over the past century. Without going all the way to the extreme assumption that the unprecedented margins of the past year will be sustained, we can give due consideration for the elevated level of profit margins by adjusting MarketCap/GVA by 10-year average nonfinancial profit margins. This gives us a MarketCap/GVA version of Robert Shiller’s Cyclically Adjusted P/E (CAPE). The chart below shows the mapping between this adjusted measure, which I’ve dubbed GVA_PE10, and actual subsequent S&P 500 12-year average annual nominal total returns. The current level is over 25, while the historical norm associated with subsequent 10% annual S&P 500 returns is less than 11. That’s the comparison that gives us a narrower baseline market risk estimate of a potential 55% loss from these levels over the completion of this market cycle.
While I’m convinced that these extremes remain deeply relevant for long-term investors, and the investment returns they can expect over the coming decade or more, valuations are often a nearly irrelevant consideration where short-term returns are involved. There, the only thing that matters is what’s in the heads of investors at any particular moment. Whatever investors believe, collectively, is exactly what investors will generate in the form of valuations and price behavior. It doesn’t matter whether any of it is true. Truth is something markets discover over time, and if the gaslights are blazing 24/7, it can take a while.
For us, extreme valuations imply that everything we do here must be done with a safety net. We don’t presume to know when disappointments will emerge, even though valuations presently require both a level of optimism and a departure from historical experience that we find not only speculative, but inconsistent with arithmetic. Nothing in our investment discipline requires a retreat in valuations, or relies on specific forecasts or scenarios. But somehow, we’re not willing to jump without a parachute just because everyone without one is yelling “So far, so good!”
The greatest investment risk at the moment is the inclination to confuse the length of time a bubble has persisted with proof that a bubble does not exist. This long and hyperextended episode of speculation has endured for more than a decade because it rests on three pillars that have behaved as different versions of ‘free money’ – first zero-interest rates and deranged Federal Reserve easing, then multi-trillion dollar pandemic deficits, and most recently a nearly frantic surge of unmitigated investment in AI capacity.
I say ‘free money’ here because none of this money is clearly attached to reliable future cash flows, except the cash flows generated by the spending itself. It’s easy to mistake the sound of money being spent with the sound of wealth being created. But there’s a difference between prosperity that relies on money being spent, and prosperity that can be sustained because the underlying economic activity itself generates sufficient future wages and income to sustain production, spending, and consumption year after year.
At the same time, our February insight on nonduality – that we had essentially been discriminating against the bubble – has had a real impact on the shorter-term investment “tilts” that we’re willing to adopt, provided that we do have safety nets in place. I’ll leave the details to the comment, How I Learned to Love the Bubble (Before it Bursts), and the follow-up discussions in other comments this year, but suffice it to say that we’re fully comfortable talking about potential 50-70% full-cycle downside risk, yet equally comfortable with shorter-horizon investment positions that periodically tilt constructive (with a safety net), based on the interaction between market behavior and measurable elements of investor psychology.
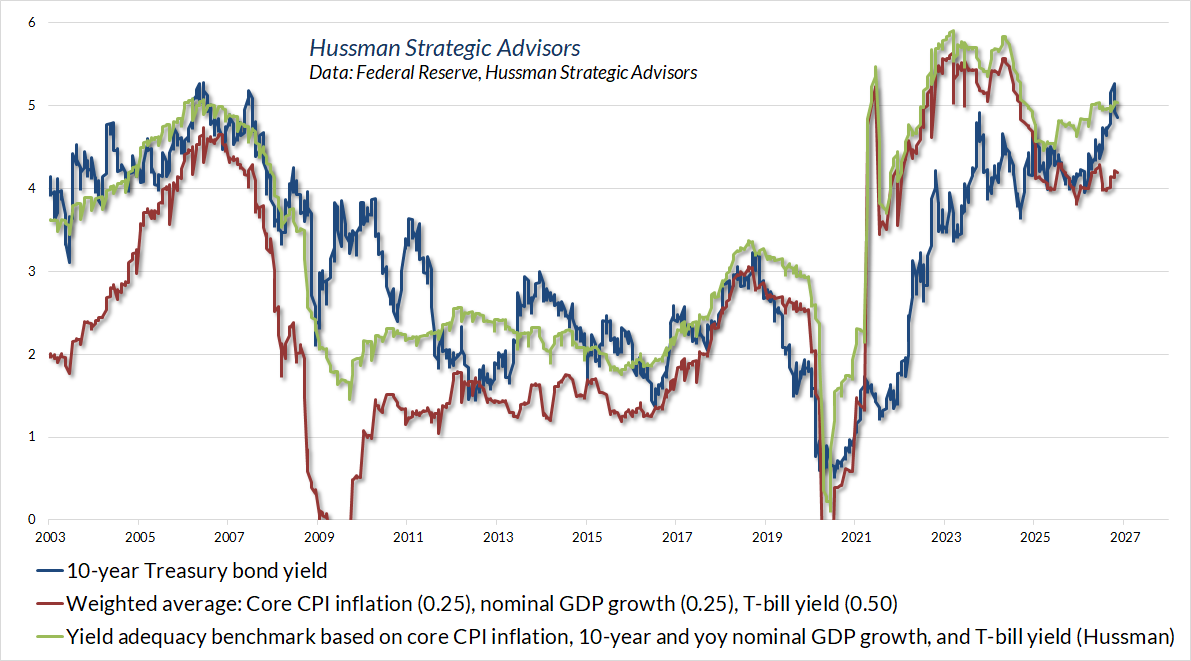
In the bond market, we consider Treasury yields to be finally adequate, though not aggressively compelling. Our preferred behavior here is to use clear weakness as an opportunity to moderately extend the duration of our holdings. The chart below shows the 10-year Treasury yield relative to some simple benchmarks that we’ve constructed to gauge the adequacy of yields. There are numerous other considerations that matter for our exposure to bonds, but the long-term return of bonds can be read directly from the yield (barring default) so yield adequacy is always a good place to start.
In the precious metals sector, we’re seeing quite a bit of volatility in gold and precious metals stocks. But from a historical standpoint, prevailing market conditions haven’t typically been associated with durable advances in this sector. We’d be much more comfortable establishing a material exposure in precious metals stocks if Treasury yields were in a measurable decline (even simply below their level of 6-months earlier) coupled with increasing evidence of economic weakness. As with bonds, there are numerous other considerations that matter for our exposure in the precious metals sector, but yield trends, economic conditions, and valuations are probably the most important ones to monitor at present.
Keep Me Informed
Please enter your email address to be notified of new content, including market commentary and special updates.
Thank you for your interest in the Hussman Funds.
100% Spam-free. No list sharing. No solicitations. Opt-out anytime with one click.
By submitting this form, you consent to receive news and commentary, at no cost, from Hussman Strategic Advisors, News & Commentary, Cincinnati OH, 45246. https://www.hussmanfunds.com. You can revoke your consent to receive emails at any time by clicking the unsubscribe link at the bottom of every email. Emails are serviced by Constant Contact.
The foregoing comments represent the general investment analysis and economic views of the Advisor, and are provided solely for the purpose of information, instruction and discourse.
Prospectuses for the Hussman Strategic Market Cycle Fund, the Hussman Strategic Total Return Fund, and the Hussman Strategic Allocation Fund, as well as Fund reports and other information, are available by clicking Prospectus & Reports under “The Funds” menu button on any page of this website.
The S&P 500 Index is a commonly recognized, capitalization-weighted index of 500 widely-held equity securities, designed to measure broad U.S. equity performance. The Bloomberg U.S. Aggregate Bond Index is made up of the Bloomberg U.S. Government/Corporate Bond Index, Mortgage-Backed Securities Index, and Asset-Backed Securities Index, including securities that are of investment grade quality or better, have at least one year to maturity, and have an outstanding par value of at least $100 million. The Bloomberg US EQ:FI 60:40 Index is designed to measure cross-asset market performance in the U.S. The index rebalances monthly to 60% equities and 40% fixed income. The equity and fixed income allocation is represented by Bloomberg U.S. Large Cap Index and Bloomberg U.S. Aggregate Index. You cannot invest directly in an index.
Estimates of prospective return and risk for equities, bonds, and other financial markets are forward-looking statements based the analysis and reasonable beliefs of Hussman Strategic Advisors. They are not a guarantee of future performance, and are not indicative of the prospective returns of any of the Hussman Funds. Actual returns may differ substantially from the estimates provided. Estimates of prospective long-term returns for the S&P 500 reflect our standard valuation methodology, focusing on the relationship between current market prices and earnings, dividends and other fundamentals, adjusted for variability over the economic cycle. Further details relating to MarketCap/GVA (the ratio of nonfinancial market capitalization to gross-value added, including estimated foreign revenues) and our Margin-Adjusted P/E (MAPE) can be found in the Market Comment Archive under the Knowledge Center tab of this website. MarketCap/GVA: Hussman 05/18/15. MAPE: Hussman 05/05/14, Hussman 09/04/17.