

Speculative Euphoria and the Fear of Missing Out


John P. Hussman, Ph.D.
President, Hussman Investment Trust
Interim Comment: February 25, 2024
Special Interim Update
“The failure of the general market to decline during the past year despite its obvious vulnerability, as well as the emergence of new investment characteristics, has caused investors to believe that the U.S. has entered a new investment era to which the old guidelines no longer apply. Many have now come to believe that market risk is no longer a realistic consideration, while the risk of being underinvested or in cash and missing opportunities exceeds any other.
– Barron’s Magazine, February 3, 1969
The S&P 500, having peaked a few weeks earlier, was down 36% by May 1970. Perhaps more importantly, the cumulative total return of the S&P 500 lagged the cumulative return of Treasury bills from November 1968 until December 1985.
This comment began as a brief “weekend update” to our internal team. Those have become more common in the past few weeks as market conditions have become increasingly extreme. I decided to expand the content and publish it as an interim note instead.
The reason is that even though the S&P 500 and Nasdaq 100 have struggled to match Treasury bill returns for over two years, investors seem to be developing an excruciating and nearly frantic “fear of missing out.” Lots of pressures are driving that fear: the recent push to nominal record highs, enthusiasm about an economic “soft landing,” an expected “pivot” to lower interest rates, and most recently, euphoria about the prospects for artificial intelligence.
While I’ve planned a deep dive into profit margins, interest costs, mega cap effects and other factors for next month’s comment, this brief note is about none of that.
Frankly, I think it’s reasonable that some of our largest investments should be related to AI, and they are, though not necessarily those with the largest market capitalizations. My impression is that the Fed will indeed pivot to lower rates late this year, though the pivot may be more consistent with the Fed’s aggressive easing during the 2000-2002 and 2007-2009 collapses than with quantitative easing and the recent zero-interest rate bubble. I do believe that current market valuations, whatever metric one chooses, are likely to be followed by weak-to-dismal 10-12 year total returns and deep full-cycle losses. Yet emphatically, nothing in our discipline requires those outcomes.
Put simply, the point of this note isn’t to change anyone’s mind, or counter bullish arguments. Though some tend to lash out at views that disagree with their own, bulls aren’t my adversaries. I expect to be one in due time, though for us, the difference between bearish, neutral, constructive, bullish and leveraged will depend on valuations and market internals, among other factors.
Passive, long-only investments are fine for those who have evaluated both their personal risk tolerance and the depth of market losses that have followed extremes similar to present. I do believe the evaluation should consider the potential for steep market losses, but some investors want to track the index, period, and that’s fine.
The intent of this note is to describe what we are doing – calmly and methodically, in our own discipline, to share the data surrounding those actions, and to remind investors how those actions will change as the data changes.
Current market conditions
I typically begin my review of market conditions by examining valuations.
Forget valuations for a moment.
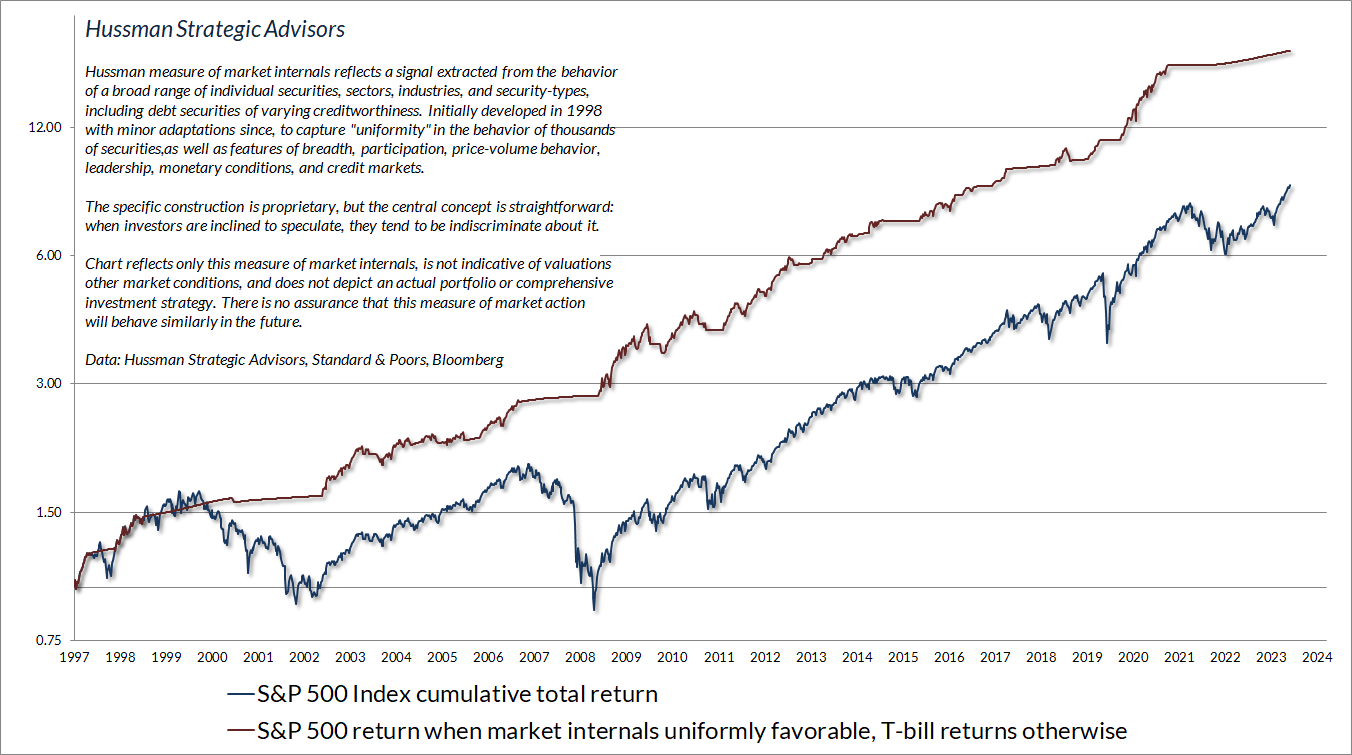
When investors are inclined to speculate, they tend to be indiscriminate about it. In contrast, risk-aversion tends to reveal itself through divergence and dispersion across securities. For that reason, we gauge speculation versus risk aversion based on the market behavior of thousands of individual stocks, industries, sectors, and security-types. I developed our gauge of “market internals” in 1998, and it has been part of our discipline since. The chart below presents the cumulative total return of the S&P 500 in periods when our measures of market internals have been favorable, accruing Treasury bill interest otherwise.
One might reply “Sure, market internals may have been useful in prior market cycles, and even in recent years (though it took you forever to prioritize them to the extent you have), but they haven’t “caught” the rally since late-October, so what’s broken?”
In my view, nothing is broken. As I noted in December, divergences between our gauge of market internals and popular “trend-following” measures tend to be resolved in favor of market internals, though not necessarily right away.
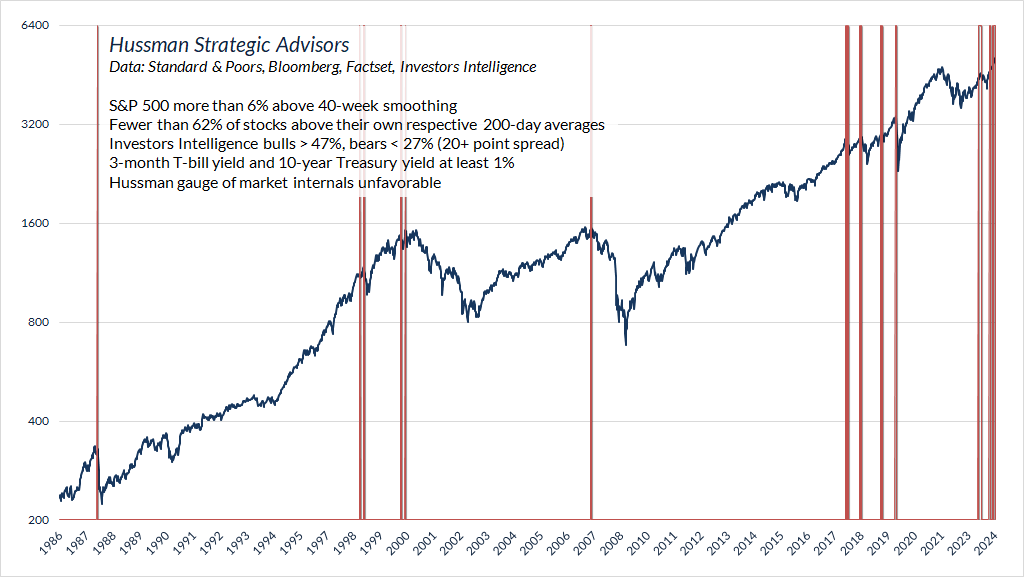
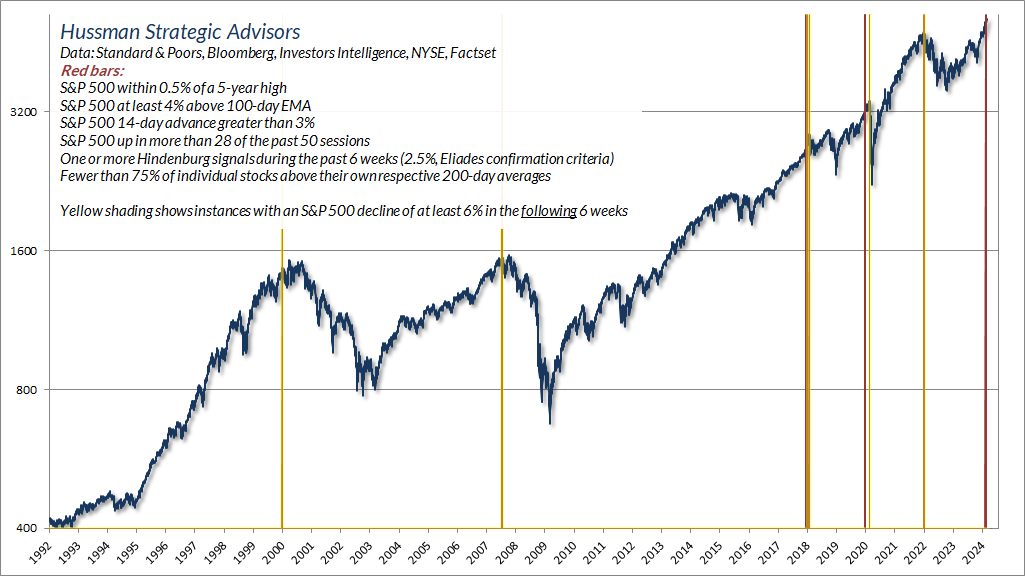
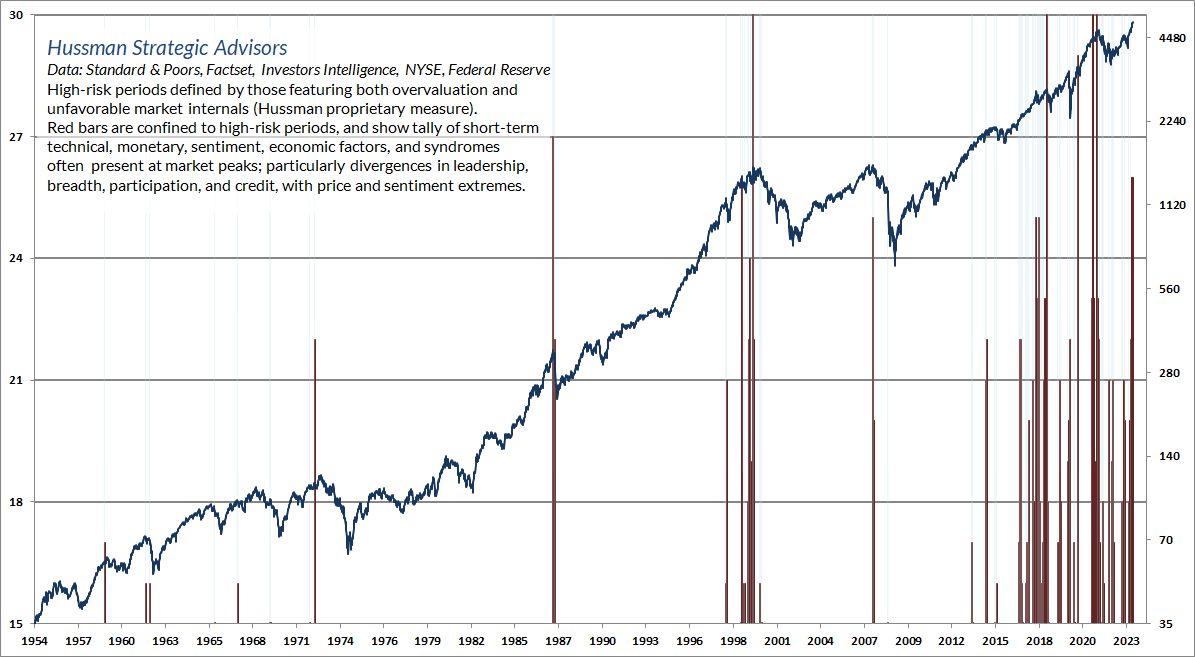
The chart below presents an example of the many “overextension” flags we observe here – in general, these syndromes capture a certain “relentlessness” of price action, coupled with some combination of divergence or extreme sentiment. In this particular example, the red bars show points where the S&P 500 was more than 6% above its 40-day smoothing, yet with fewer than 62% of individual stocks above their own respective 200-day averages, unfavorable internals on our primary gauge, lopsided bullish sentiment, and (as a paean to zero-interest rate speculation), interest rates above 1%.
This chart is not a forecast – just a statement that yes, we’ve had multiple periods in history when market internals were unfavorable yet the prevailing “trend” of the S&P 500 was very strong and bullish sentiment was dominant. None of these instances called for any “fix” to market internals.
Though current conditions are highly consistent with prior market peaks, we can’t and don’t rule out the possibility of a more extended market advance. Even then, we would also expect market internals to improve as we’ve seen in every market cycle, including the recent bubble. That would shift us to a more constructive outlook regardless of the level of valuations. In any event, nothing in our discipline leads us to have any “fear of missing out” here.
Adapting to speculation: 2017 and 2021
While the benefit of combining valuations and market internals was clear in previous complete market cycles, we’ve always included a third element in our discipline – syndromes of overextended market action. In previous market cycles, these syndromes were regularly followed by steep market losses. Amid the Federal Reserve’s unprecedented monetary experiment with quantitative easing and zero interest rates, even historically-reliable “limits” to speculation became useless – at least while market internals were still favorable. Our bearish response to those “limits” became detrimental. Faced with a pile of 16-36% of GDP in zero-interest liquidity that someone had to hold at every point in time, investors decided there was “no alternative” but to speculate, and no price that was too high.
We made two key changes to our discipline in response to persistent speculation in this half-cycle bubble.
In late-2017, we adapted our discipline – abandoning our bearish response to “overextended” syndromes when market internals remain favorable – no matter how extreme those conditions might be. Understand, however, that avoiding a bearish outlook is not the same as adopting a constructive outlook. Our 2017 adaptation stopped us from fighting – provided market internals were favorable – it didn’t push us to join.
In the second half of 2021, we made further adaptations – expanding our willingness and ability to adopt a constructive outlook even amid hypervalued conditions (with position limits and safety nets of course). As value-conscious investors who take the concept of “investment” seriously, this was a difficult decision for us, but it aligns with Benjamin Graham might describe as “intelligent speculation.”
Put simply, we are not defensive here simply because the market is overvalued on our preferred valuation measures. We could substitute those measures with the Shiller cyclically-adjusted P/E (CAPE) or even the S&P 500 forward operating P/E, and we would still be defensive. We’re defensive because market internals remain divergent, in combination with overvaluation and overextended market action. We take this combination seriously. A market collapse is nothing but risk-aversion meeting a market that’s not priced for risk.
Our investment outlook will shift as those conditions shift.
As Ben Graham observed, there is intelligent speculation, but there are many ways in which speculation may be unintelligent. In my view, chomping down on the speculative bit amid record valuations, divergent internals, euphoric sentiment, and overextended market action is among them.
An investment operation is one which, upon thorough analysis promises safety of principal and an adequate return. Operations not meeting these requirements are speculative. The distinction between investment and speculation in common stocks has always been a useful one and its disappearance is a cause for concern. In most periods the investor must recognize the existence of a speculative factor in his common stock holdings. It is his task to keep this component within minor limits, and to be prepared financially and psychologically for adverse results that may be of short or long duration.
There is intelligent speculation as there is intelligent investing. But there are many ways in which speculation may be unintelligent. Of these the foremost are: (1) speculating when you think you are investing; (2) speculating seriously instead of as a pastime, when you lack proper knowledge and skill for it; and (3) risking more money in speculation than you can afford to lose.
– Benjamin Graham, The Intelligent Investor
Valuations: Take your pick
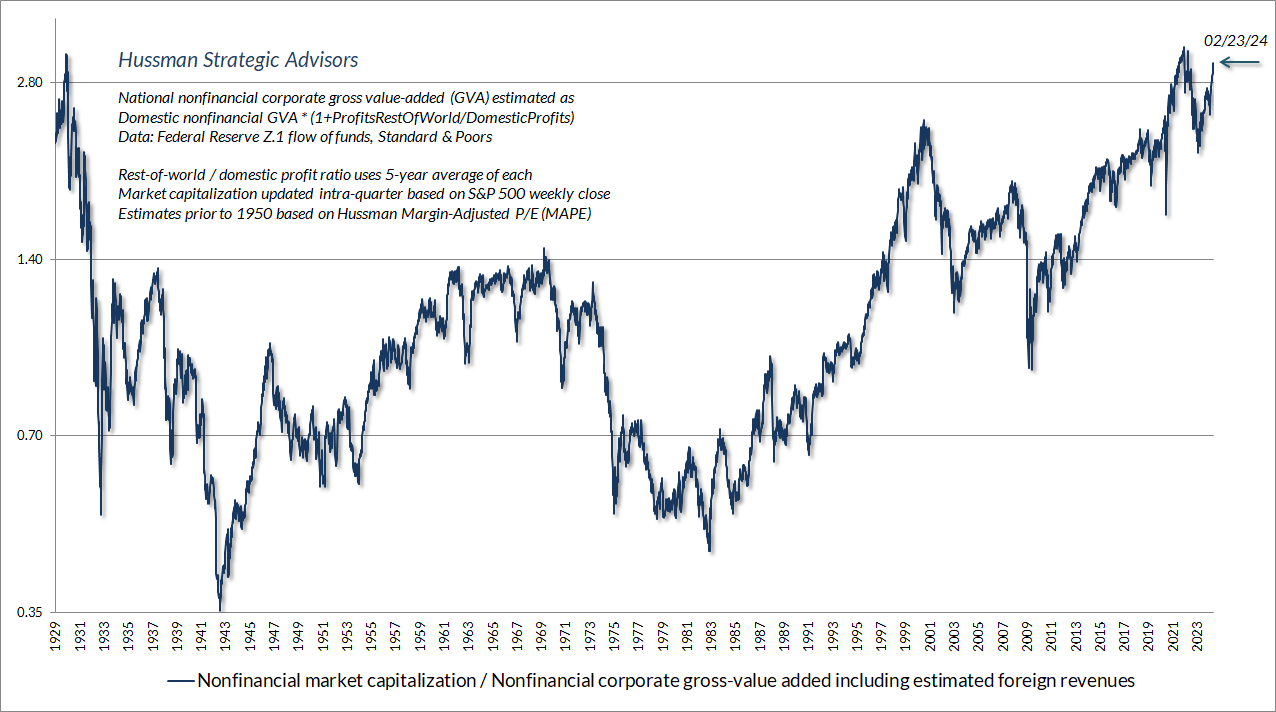
From a valuation standpoint, the chart below shows the valuation measure we find best-correlated with 10-12 year S&P 500 total returns in market cycles across history: the ratio of nonfinancial market capitalization to corporate gross value-added, including estimated foreign revenues (MarketCap/GVA). Presently, this measure is higher than at any point prior to June 2021, with the exception of three weeks surrounding the 1929 peak.
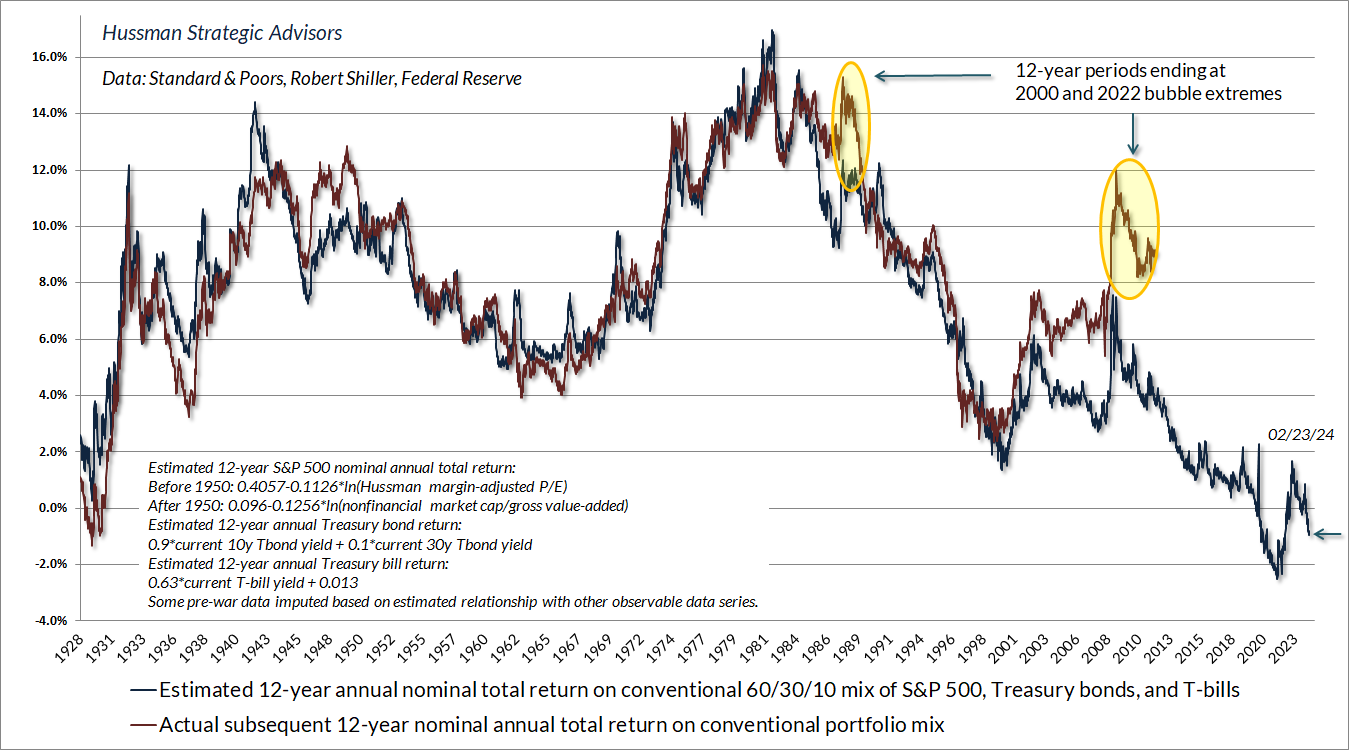
Based on the relationship between valuations and subsequent market returns, the chart below shows our estimate of the expected 12-year total return of a conventional “passive” investment portfolio invested 60% in the S&P 500, 30% in Treasury bonds, and 10% in Treasury bills. The current estimate is negative, though not quite as negative as the January 2022 extreme.
Notice that in 12-year periods that end at bubble extremes (such as 1988-2000 and 2010-2022), actual 12-year returns “peel away” from the returns that would have been projected 12-years earlier. This is a symptom of extreme ending valuations. It’s tempting to misinterpret these “errors” as evidence that valuations no longer “work,” but as I’ve often noted, the only way the market can reach valuations as extreme as 1929, 2000, and today is by blowing through lesser extremes undaunted. In the interim, investors become convinced that valuations simply don’t matter.
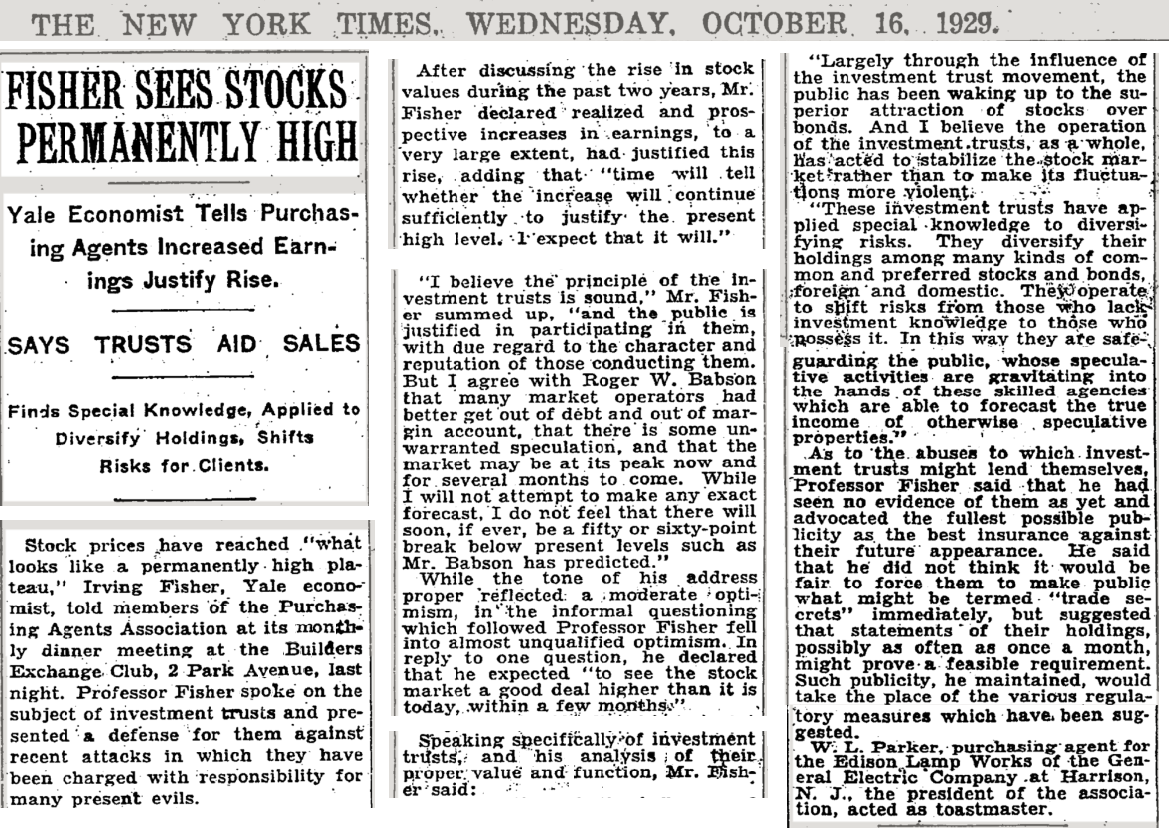
By the peak of a bubble, it’s common for investors to capitulate to the idea that valuations will maintain a “permanently high plateau.” As I noted above, we don’t need to rule anything out. Particularly with the adaptations we made in 2021, we expect that shifts in market internals alone will be enough to navigate future market cycles even if valuations never again approach their historical norms.
That said, this would not be the first time investors were tempted to expect a “permanently high plateau.” The New York Times article below is from October 16, 1929
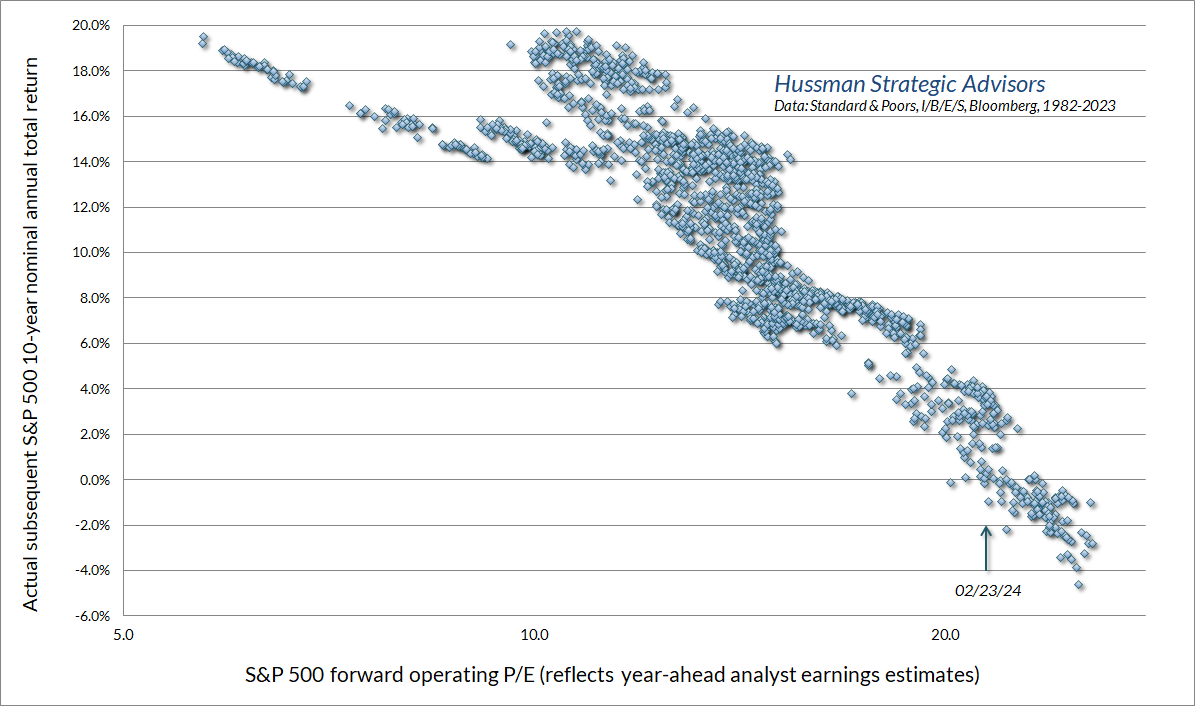
For investors who remain convinced that current record profit margins are the correct basis on which to project future cash flows for decades to come, the chart below shows the current forward operating P/E for the S&P 500, based on analyst estimates of year-ahead operating earnings. Keep in mind that the forward P/E only became popular in the 1990’s, and that even forward operating earnings estimates were a creation of the 1980’s. As a result, data for the forward operating P/E are only available since that time.
Fortunately, the forward P/E is well-correlated with the Shiller CAPE, though they scale differently. The forward P/E reduces variation in earnings by using analyst estimates of year-ahead operating earnings, while the Shiller CAPE reduces variation in earnings by using a 10-year average of past earnings. Based on the close relationship between the two measures in recent decades, we can impute values for the forward P/E on a much longer historical basis.
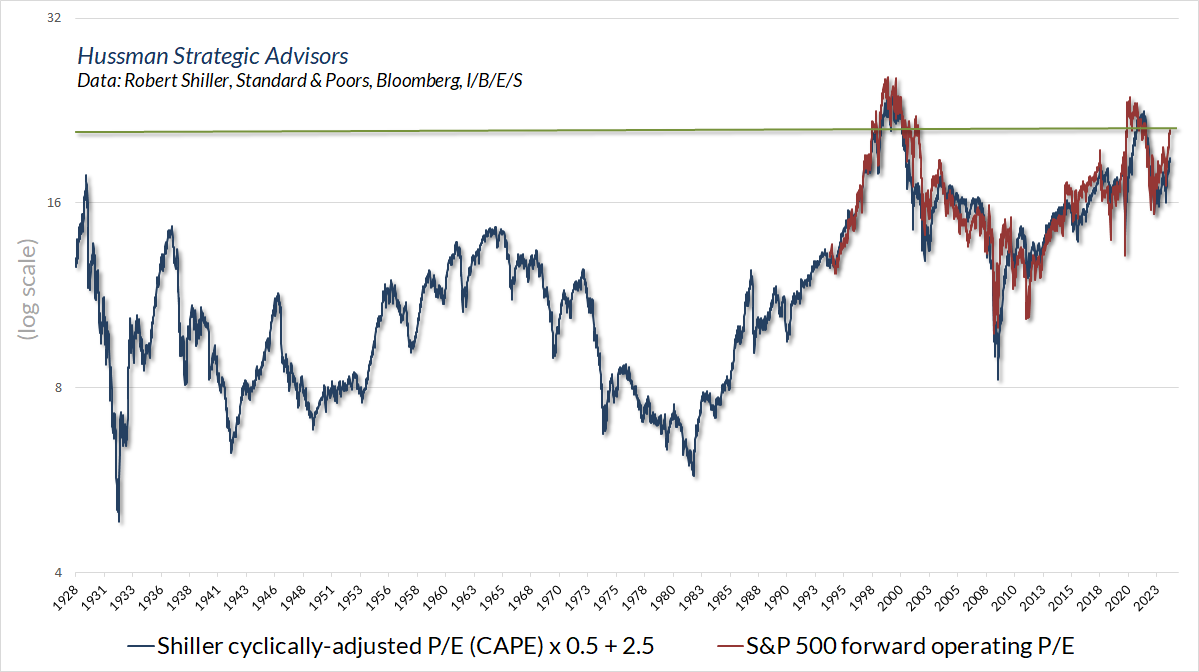
S&P 500 profit margins have set record levels in the past decade. As a result, both the forward P/E and the Shiller CAPE implicitly assume that these profit margins are the correct basis on which to project long-term future cash flows for the S&P 500. Yet even if we take the current forward P/E at face value, and restrict our attention only to the period since 1980, the current level of valuations is consistent with expected S&P 500 annual total returns in the low single-digits over the coming decade.
So take your pick of valuations. Ignore them altogether. Either way, our current defensiveness is not driven by the valuation measure one uses.
We’re defensive because market internals remain divergent, in combination with overvaluation and overextended market action. We take this combination seriously. A market collapse is nothing but risk-aversion meeting a market that’s not priced for risk.
In our investment discipline, the strongest market return/risk profiles emerge when a material retreat in valuations is joined by an improvement in market internals. Yet even if valuations were to maintain a permanently high plateau, improved internals and less overextended market action would be welcome enough.
In contrast, the most hostile market return/risk profiles emerge when unfavorable valuations are joined by unfavorable market internals and overextended market action. That’s the combination we presently observe, but that will also change.
This is what a market peak looks like
We can’t say with any certainty at all that stocks are at a market peak. We can also say with complete certainty that present conditions mirror what a market peak looks like.
The difference between the two statements is that one relates to the future, and one relates to the past.
We can’t know the future, but it’s straightforward to examine history and do math. Presently, market conditions have a stronger positive correlation with historical market peaks, and a stronger negative correlation with historical market lows, than 99.9% of instances across history. As I noted in our February comment, I call this subset of history the Cluster of Woe.
The next few charts are ones I typically only circulate to our internal team. They’re part of an extensive set of flags, correlations, and overextension syndromes that are more useful at extremes than for ongoing discussion. The last time we saw a preponderance of warning signs similar to today was on the approach to the early 2022 peak (see my late-November 2021 comment Motherlode for a discussion of these syndromes).
The example below is among dozens of “overextension syndromes” I’ve developed over time. These syndromes typically feature a combination of steep recent advances or declines, coupled with internal divergences and often extreme sentiment.
The chart text shows the conditions that define this particular syndrome. The yellow shading shows which of these instances were followed by declines in the S&P 500 of at least 6% over the following 6 weeks. I prefer to view these outcomes not as “forecasts” but simply as “regularities.”
We can’t say with any certainty at all that stocks are at a market peak. We can also say with complete certainty that present conditions mirror what a market peak looks like.
The chart below shows the tally of syndromes that are presently active in weekly data.
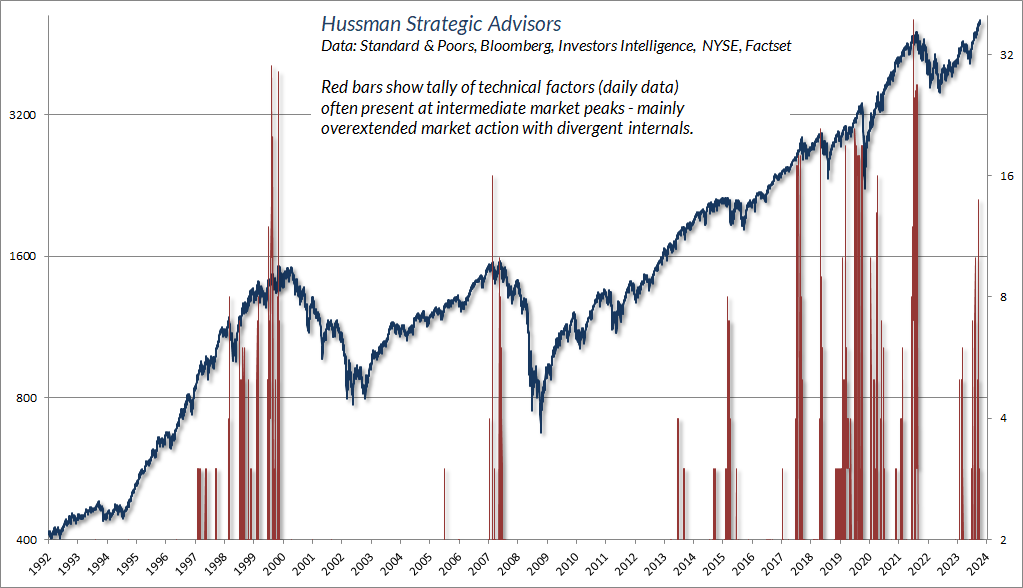
Next, the tally of different overextension syndromes that we monitor in daily data.
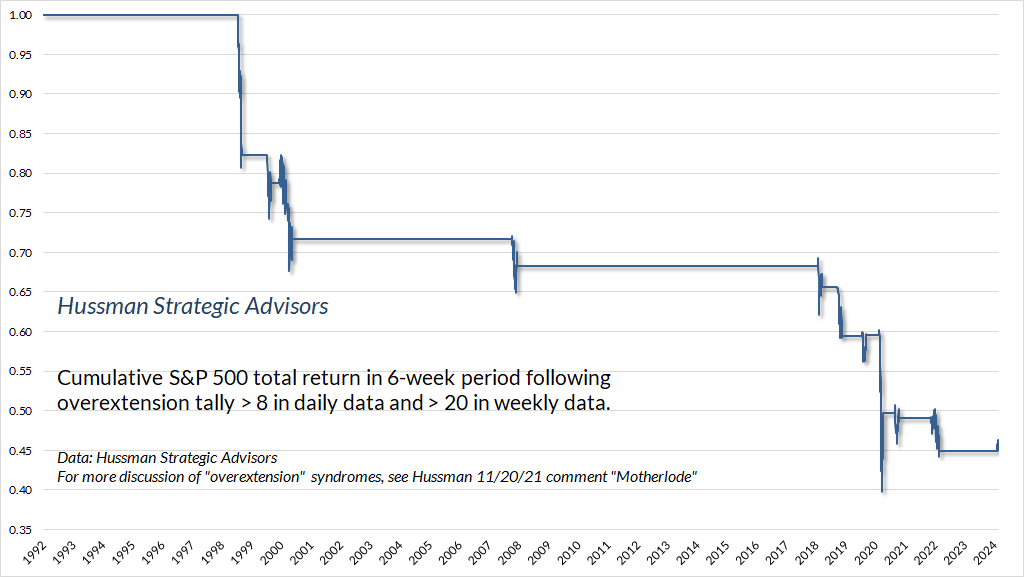
As with every noise-reduction problem, the most reliable information is typically provided by the common signal from multiple sensors. Given the number of daily and weekly overextension syndromes we observe, I created the chart below to share with our team. It shows the cumulative total return of the S&P 500 in the 6-week period following an overextension tally greater than 8 in daily data and greater than 20 in weekly data. The latest instance with that many syndromes was on February 8.
Again, I treat these outcomes as “regularities.” I discourage treating them as forecasts, much less taking the 6-week window literally. Still, it’s never great when market conditions have outcomes that look like a 4-year old going to town on an Etch-A-Sketch.
If there’s anything that would quickly make this worse, it would be a “leadership reversal” where the number of stocks setting new 52-week lows surges above the number of new highs, particularly within a few sessions of a record high. That’s part of a syndrome I’ve often described as a “phase transition.”
So is this a market peak? No idea. Do present conditions mirror a market peak? Absolutely.
Are we defensive because we think the rally in big tech is overdone, or we expect a recession, or we think credit risk is underestimated, or we expect a 50-70% market decline over the completion of this cycle? No. All or none of these may be valid concerns, but that’s not why we’re defensive here.
We’re defensive because we observe a preponderance of risk syndromes that feature internal divergence, particularly in our main gauge of market internals, coupled with rich valuations and overextended market action. Our view will shift as those elements change. That’s our discipline. It doesn’t rely on highly specific assumptions about valuations – even conventional measures are near historical extremes. It doesn’t rely on economic forecasts. It relies on observable, objective measures informed by a century of market cycles – every speculative episode, every market collapse, every burst of U.S. innovation since the horse and buggy. It’s what we did successfully in decades of prior market cycles. Including the adaptations we made to address novel aspects of the recent bubble, it’s also what we’ve promised our followers we will do in the future. That includes what might be considered “intelligent speculation” when internals encourage a constructive outlook. But it doesn’t mean chasing risk amid unfavorable internals, extreme valuations, and a preponderance of overextended syndromes.
If you’re losing your mind and plagued by fear of missing out, it might be that you’re best served with some passive investment exposure in your portfolio. Not because it will do well, at least not in our estimation, but so you don’t lose your mind. Nobody wants you to lose your mind. You have options. Investors who want a concentrated position in big tech can take a concentrated position in big tech. We need not be involved. Our discipline is just our discipline. We’re not going to abandon it because someone else has FOMO, but I promise to follow the discipline we’ve articulated, to question our assumptions, to address issues when there’s something to address – as we did in 2017 and more fully in 2021 – and otherwise, to diligently stick to our knitting. On that, I’ve got your back.
Keep Me Informed
Please enter your email address to be notified of new content, including market commentary and special updates.
Thank you for your interest in the Hussman Funds.
100% Spam-free. No list sharing. No solicitations. Opt-out anytime with one click.
By submitting this form, you consent to receive news and commentary, at no cost, from Hussman Strategic Advisors, News & Commentary, Cincinnati OH, 45246. https://www.hussmanfunds.com. You can revoke your consent to receive emails at any time by clicking the unsubscribe link at the bottom of every email. Emails are serviced by Constant Contact.
The foregoing comments represent the general investment analysis and economic views of the Advisor, and are provided solely for the purpose of information, instruction and discourse.
Prospectuses for the Hussman Strategic Growth Fund, the Hussman Strategic Total Return Fund, and the Hussman Strategic Allocation Fund, as well as Fund reports and other information, are available by clicking “The Funds” menu button from any page of this website.
Estimates of prospective return and risk for equities, bonds, and other financial markets are forward-looking statements based the analysis and reasonable beliefs of Hussman Strategic Advisors. They are not a guarantee of future performance, and are not indicative of the prospective returns of any of the Hussman Funds. Actual returns may differ substantially from the estimates provided. Estimates of prospective long-term returns for the S&P 500 reflect our standard valuation methodology, focusing on the relationship between current market prices and earnings, dividends and other fundamentals, adjusted for variability over the economic cycle. Further details relating to MarketCap/GVA (the ratio of nonfinancial market capitalization to gross-value added, including estimated foreign revenues) and our Margin-Adjusted P/E (MAPE) can be found in the Market Comment Archive under the Knowledge Center tab of this website. MarketCap/GVA: Hussman 05/18/15. MAPE: Hussman 05/05/14, Hussman 09/04/17.