Notable Charts
Nonfinancial Market Capitalization to Gross Value-Added (MarketCap/GVA)
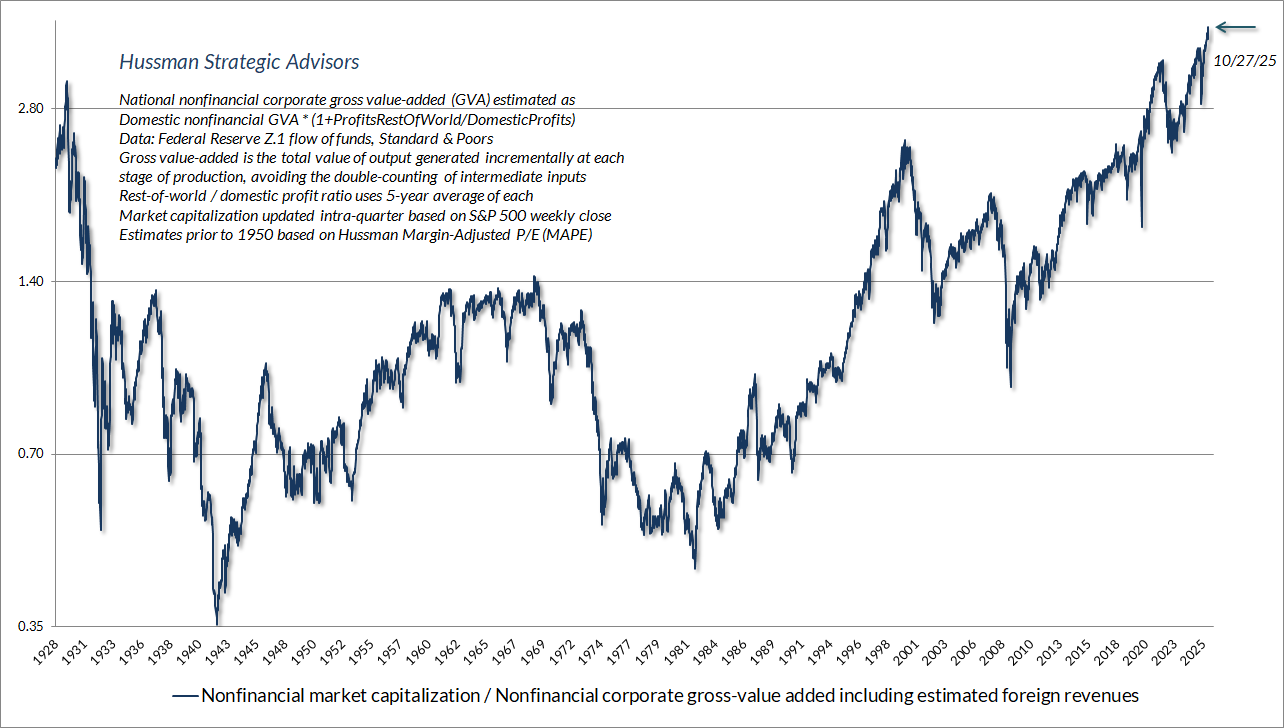
The chart below shows our most reliable valuation measure, based on its correlation with actual subsequent S&P 500 total returns in market cycles across history: the ratio of U.S. nonfinancial market capitalization to gross value-added (MarketCap/GVA). This measure, introduced by Dr. Hussman in 2015, basically operates as an economy-wide, apples-to-apples price-to-revenue ratio. In October 2025, our most reliable equity market valuation measures reached the highest extreme in the history of the U.S. financial markets.
Click the chart to enlarge.
MarketCap/GVA and Subsequent Market Returns
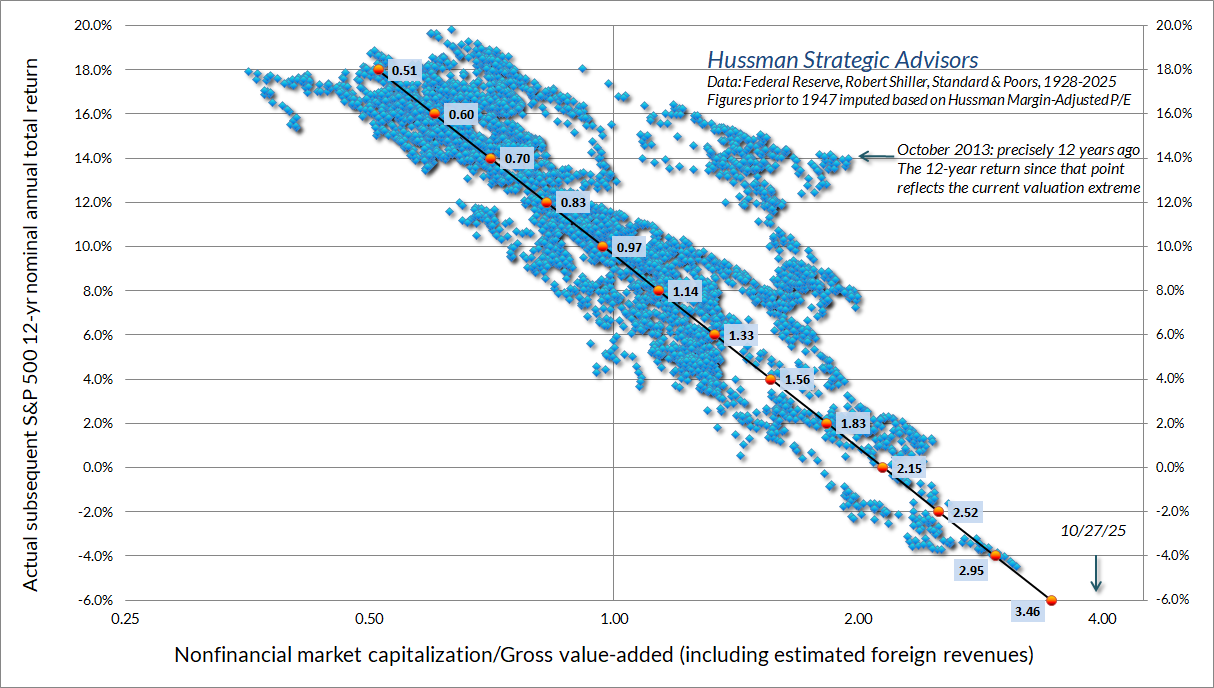
The scatterplot below shows the relationship between our most reliable valuation measure – nonfinancial market capitalization to corporate gross value-added – and actual subsequent S&P 500 total returns, in nearly a century of data. A similar relationship holds for other historically reliable measures. For any given set of future expected cash flows, the higher the valuation investors pay, the lower the average return they should expect over the long-term.
While reliable valuation measures are extremely informative about long-term market returns, particularly over a 10-12 year horizon, one must be careful not to interpret valuations as near-term market forecasts. That is emphatically not how valuations work. The main factor that determines whether an overvalued market continues to advance, or drops like a rock instead, is whether investor psychology is inclined toward speculation or risk-aversion. When investors are inclined to speculate, they tend to be indiscriminate about it. When investors become risk-averse, they tend to be skittish and selective. For that reason, our most reliable gauge of speculation versus risk-aversion is the uniformity or divergence of market internals – across thousands of individual stocks, industries, sectors, and security types, including debt securities of varying creditworthiness. For this reason, the uniformity or divergence of “market internals” is an essential consideration in our investment discipline, particularly over limited segments of the market cycle. Click the chart to enlarge.
Estimated 12-Year Returns for a Conventional Passive Investment Allocation
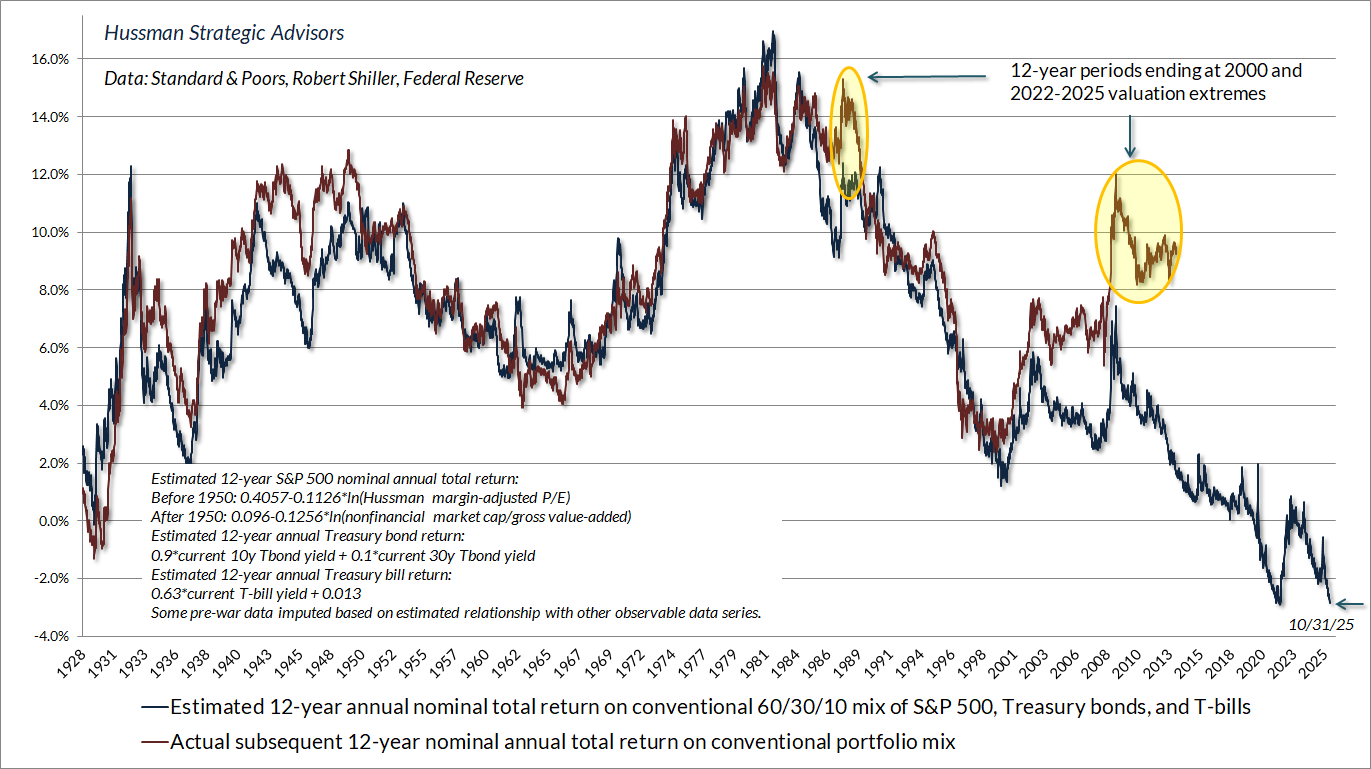
The chart below shows our estimate, as of October 2025, of expected 12-year nominal total returns for a conventional passive portfolio mix invested 60% in the S&P 500, 30% in Treasury bonds, and 10% in Treasury bills (blue) along with the actual total return of that portfolio (red) for periods where the full horizon has been completed. Notice that actual returns tend to “lift away” from their corresponding 12-year projections when the end of the investment horizon occurs at extreme valuations. These deviations reflect the accrual of speculative gains, which tend to be surrendered during subsequent market collapses.
In our view, the combination of rich equity market valuations and low interest rates does not create a “justified” or “fair” situation for the financial markets. It simply combines insult with injury – creating a poor outlook for returns in both the stock and bond markets. There is no question that higher interest rates, coupled with a retreat in stock market valuations, has improved the outlook for the returns of a passive investment portfolio since the first half of 2022. Unfortunately, this improvement was relative to the most extreme valuations in history. As a result, as of October 2025, we continued to estimate negative average annual 12-year total return for a conventional passive investment allocation holding 60% in the S&P 500, 30% in Treasury bonds, and 10% in Treasury bills. Click the chart to enlarge.
Popular Articles
- An Unsustainable Equilibrium
- The Bubble Term
- The Turtle and the Pendulum
- Money, Banking and Markets – Connecting the Dots
- The Structural Drivers of Investment Returns
- Mapping the Molecular Pathway of Autism
- Why Warren Buffett Plays Bridge
- Freight Trains and Steep Curves
- Long-Term Evidence on the Fed Model and Forward Operating P/E Ratios
- The Two Essential Elements of Wealth Accumulation
- Going for the Gold
- Buy-and-Hold for the Duration?
Featured Topics
While corporate earnings are necessary to generate deliverable cash to shareholders, comparing prices to earnings is actually quite a poor way to estimate future investment returns. The reason is simple - most of the variation in earnings, particularly at the index level, is uninformative.
Stocks are not a claim to next year’s earnings, but to a very long-term stream of cash flows that will be delivered into the hands of investors over time. Corporate earnings are more variable, historically, than stock prices themselves. Though “operating” earnings are less volatile, all earnings measures are pro-cyclical; expanding during economic expansions, and retreating during recessions. As a result, to quote the legendary value investor Benjamin Graham, “The purchasers view the good current earnings as equivalent to ‘earning power’ and assume that prosperity is equivalent to safety.”
Not surprisingly, the valuation measures having the strongest correlation with actual subsequent investment returns across history are smoother, and serve as better “sufficient statistics” for the relevant long-term cash flows. The table below compares the historical reliability of a variety of alternative valuation measures across decades of market cycles since 1950. Click the table to enlarge.
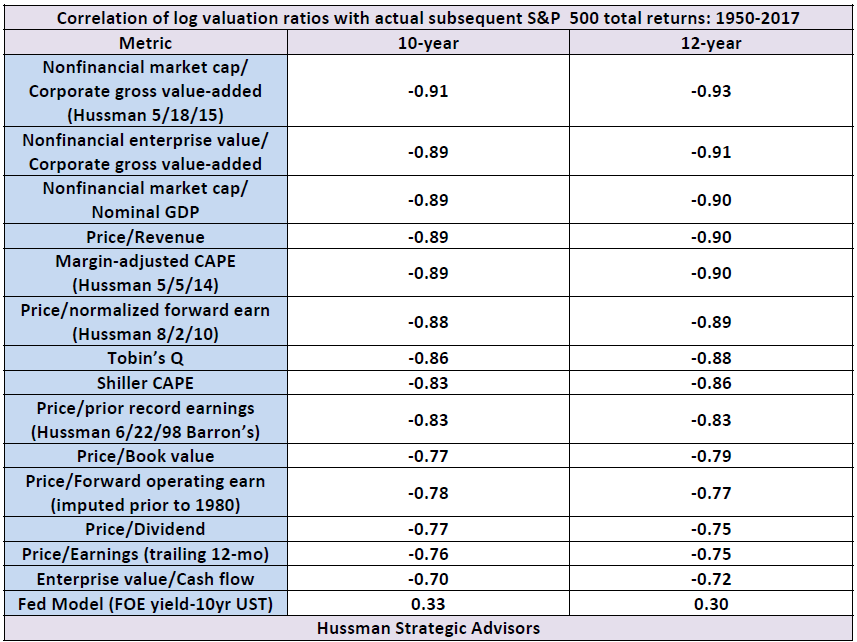
Data: Federal Reserve Economic Database, Robert Shiller, Standard & Poors
There are two central considerations in investing that, when used in combination, have been the source of virtually every major success we have enjoyed in prior market cycles, and when inadvertently missed or underappreciated, have been the source of virtually every significant disappointment.
The first is what we often call the Iron Law of Valuation: every security is a claim on an expected stream of future cash flows, and given that expected stream of future cash flows, the current price of the security moves opposite to the expected future return on that security. The higher the price an investor pays for that expected stream of cash flows today, the lower the return that an investor should expect over the long-term. Particularly at market peaks, investors seem to believe that regardless of the extent of the preceding advance, future returns remain entirely unaffected. The repeated eagerness of investors to extrapolate returns and ignore the Iron Law of Valuation has been the source of the deepest market losses in history.
The second consideration, however, is equally important over any horizon other than the long-term. We call it the Iron Law of Speculation: The near-term outcome of speculative, overvalued markets is dependent on investor preferences toward risk-seeking or risk-aversion, and those preferences can be largely inferred from the uniformity or divergence of market action across a wide range of individual stocks, industries, sectors, and security-types, including debt securities of varying creditworthiness. When investors are inclined to speculate, they tend to be indiscriminate about it. In the long-term, investment outcomes are chiefly defined by valuations, but over the shorter-term, the difference between an overvalued market that becomes more overvalued, and an overvalued market that crashes, has little to do with the level of valuation and everything to do with investor attitudes toward risk.
If you have the long-term available to you, there’s nothing particularly wrong with being a value investor. Over the long-term, disciplined, historically-informed, value-conscious analysis pays off. But over shorter horizons, a singular focus on valuation can be extremely uncomfortable. Over shorter segments of the market cycle, valuations can depart dramatically from historical norms, and even objective extremes in valuations may not result in "mean-reversion" for an extended period of time. Still, these deviations are highly informative about longer-term market returns, particularly on a 10-12 year horizon.
The proper response to periods of extreme valuations is not to discard the Iron Law of Valuation, but to couple your awareness of valuation with an understanding of the Iron Law of Speculation: no matter how overvalued or overextended the market may be; no matter how deeply the market is likely to retrace that overvaluation over the eventual completion of the market cycle; the preferences of investors toward risk – as inferred from market internals, credit spreads and other risk-sensitive factors – can make that overvaluation largely irrelevant over shorter horizons. In steeply overextended conditions, it may be necessary to maintain a neutral position, or to use safety nets such as put options, because these extremes can give way to abrupt, vertical market losses. Still, patience may be necessary while speculators have their day. As Warren Buffett once remarked, “A group of lemmings looks like a pack of individualists compared with Wall Street when it gets a concept in its teeth.”
From our standpoint, the most hostile market environments are those that couple extreme valuations with deterioration in market internals (indicating a shift among investors toward risk-aversion). In that environment, steeply negative market outcomes occur more often than not. They may not happen immediately, but they tend to happen quickly. The late MIT economist Rudiger Dornbusch characterized the process well: “The crisis takes a much longer time coming than you think, and then it happens much faster than you would have thought.”
Conversely, the strongest market return/risk profiles we identify are associated with markets that have experienced a material retreat in valuation, coupled with an early improvement in our measures of market action. This combination emerges in every market cycle, and can provide opportunities to substantially increase exposure to the financial markets after periods of extreme speculation are resolved by market losses and improved valuation.
One more Iron Law will help to put market conditions into perspective. It’s what we call the Iron Law of Equilibrium: once a security is issued, it must be held by someone at every point in time, until that security is retired. For example, every dollar of monetary base created by the Federal Reserve has to be held by someone, in the form of base money, until it is retired by the Fed. Buyers never put those dollars “into” the stock market without sellers immediately taking those dollars right back out. So the pile of base money “on the sidelines” never comes “off the sidelines” because it can’t magically transform into something else; it just changes hands. Likewise, the Iron Law of Equilibrium says that there are never “more buyers than sellers” or “more sellers than buyers.” Every share of stock that is sold by a seller goes into the hands of some buyer. Prices aren’t driven up or down by “money flow” or a surplus of buying over selling. Prices are driven up or down depending only on who is more eager, the buyers or the sellers.
If one recognizes that every share of stock is a claim on a future stream of cash flows that will be delivered into the hands of the investor over a very long period of time, investors in the mid-2020's should be very concerned about the valuations that investors are paying for those claims. In their exuberance about low interest rates “justifying” elevated market valuations, investors have neither quantified the “justified” effect of lower rates, nor appropriately considered the long-term dynamics of the cash flows they are purchasing.
The proposition that lower interest rates justify higher valuations relies on the assumption that the stream of future cash flows is held constant. Provided that one holds the growth rate of future cash flows constant, the impact of a reduction of interest rates (and prospective returns on competing assets like stocks) is straightforward to calculate. If interest rates are expected to be held, say, 2% below average for a period of say, 10 years, a one-for-one response for other assets would be to raise their valuations by about 20% (2% x 10 years) above their respective historical norms. For example, a $100 cash flow, deliverable in 20 years, would be priced at $21.45 in order to achieve an 8% return over that period ($100/(1.08)^20). If one reduces the prospective return to 6% for the first 10 years, and 8% thereafter, the appropriate price is ($100/(1.06^10)(1.08^10) =) $25.86, which is not surprisingly about 20% higher.
So provided that investors actually expect future economic growth to match historical rates of growth, investors expecting interest rates to remain say, 2-3% below historical norms even another decade would still only be “justified” in bidding stock valuations 20-30% above their historical norms.
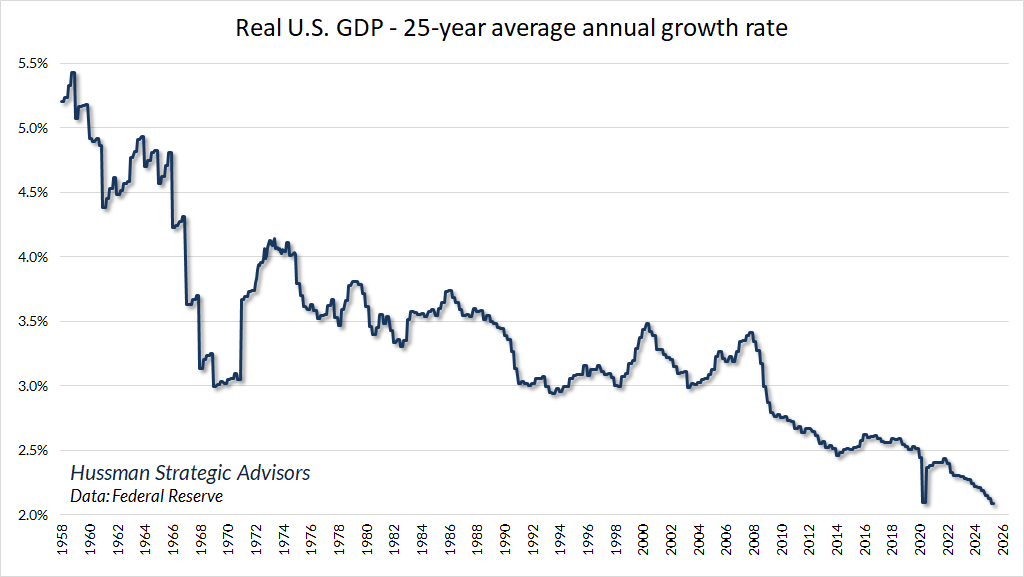
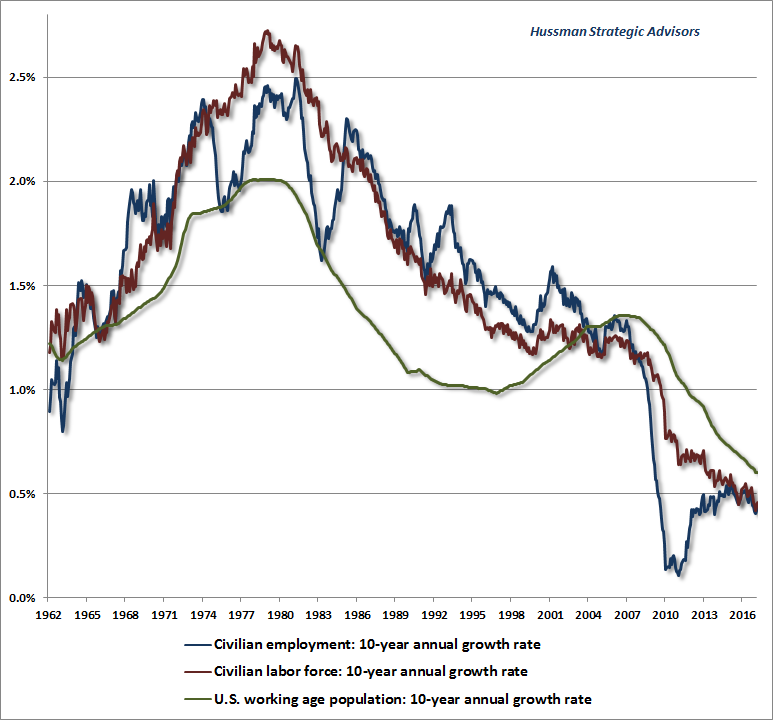
Moreover, based on demographic projections by the U.S. Department of Labor, even if the unemployment rate does not rise above 4%, the contribution of employment growth to GDP will average just 0.3% annually in the years ahead. Since 2010, nearly half of real U.S. GDP growth has been driven by a declining unemployment rate. This has largely prevented investors from recognizing that the two drivers of long-term growth, labor force growth and productivity growth, have slowed to just 0.3% and 1.0% annually, respectively. This puts the baseline for GDP growth in the coming years at just 1.3% annually, and even a substantial improvement in productivity growth would leave average annual U.S. real GDP growth below 2%.
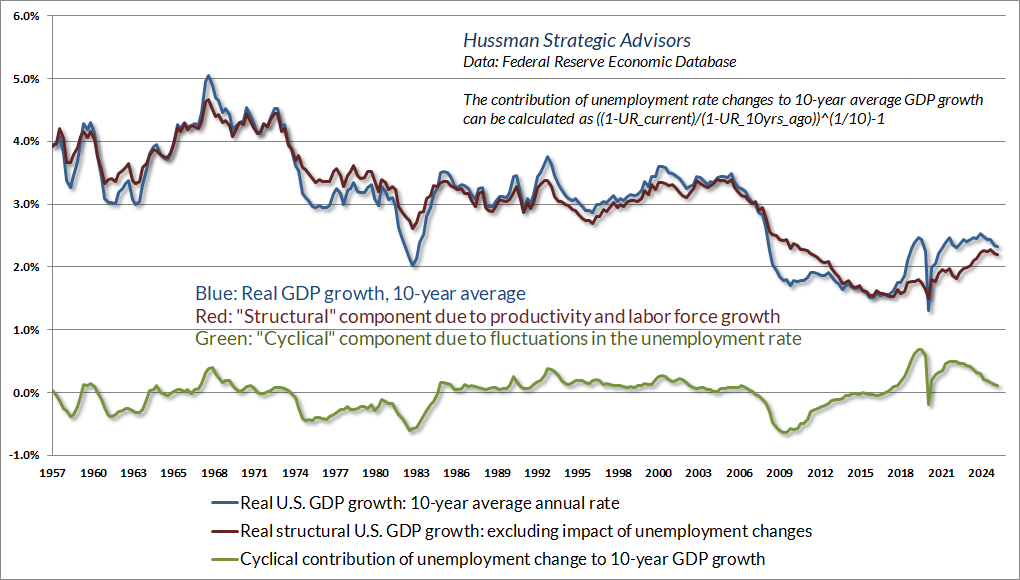
Put simply, the underlying drivers of real GDP have been progressively weakening in recent decades, reflecting a combination of demographic factors and slowing productivity growth. Indeed, excluding the impact of changes in the unemployment rate (which are unlikely to help future growth, given an unemployment rate that has declined to just 4.2%), the structural drivers of U.S. GDP growth have never been weaker.
The chart below shows post-war growth of U.S. real GDP, excluding the impact of cyclical fluctuations in the rate of unemployment. I’ve used a 10-year average to exclude the global financial crisis. Understand that the latest data point reflects the structural drivers of the U.S. economy even during the recent recovery.
It is essential to recognize that if interest rates are lower because likely future growth in deliverable cash flows is also lower, then no valuation premium is justified at all. In 2025, based on the measures we find most tightly correlated with actual subsequent market returns across history, S&P 500 valuations stand nearly four times the valuation norms that have been approached or breached over the completion of every market cycle in history, including the most recent one.
Meanwhile, it is widely assumed that valuations "deserve" to be higher than ever before because corporate profit margins are at record highs. The implication is that these margins reflect a "new era" of economic progress. While the distribution of profits can certainly benefit companies at the leading edge of technology as it changes over time, it is easy to show - using the definition of GDP and rearranging terms - that the overall level of corporate profits is the mirror image of deficts in other sectors of the economy.
So yes, corporate profits and free cash flow are at record highs. But they are at record highs because government, households and foreign trading partners are running a massive net deficit. Interestingly, the domestic imbalance in the United States – government and households only – is even worse. That’s because foreign trading partners are running a surplus on the order of 1-2% of GDP (the flipside of our “current account deficit”). In equilibrium, their “saving” partially finances the massive “dissaving” of the U.S. government and household sectors. Again, it’s not just a theory, it’s an accounting identity.
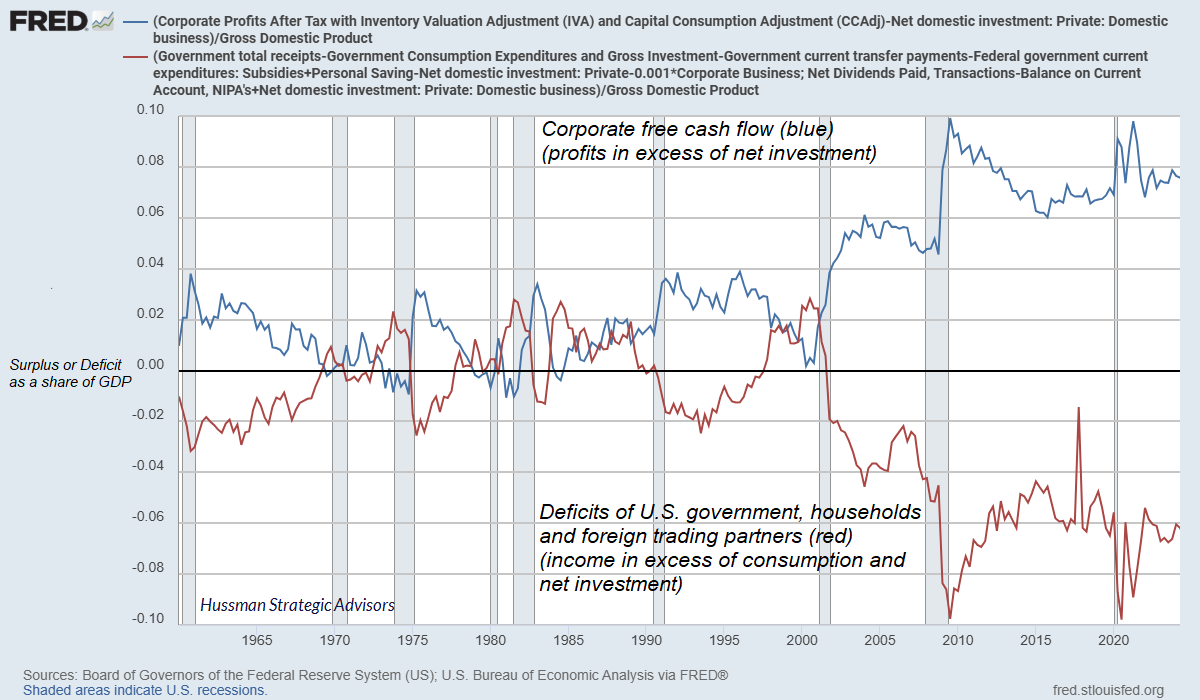
Put simply, the deficit of one sector emerges as the surplus of other sectors, and the liabilities issued by one sector become the assets of the other sectors.
This enormous domestic imbalance between “haves” and “have nots” means that the “haves” accumulate the financial obligations of the “have nots.” That’s how the house of cards keeps standing. Neither the government nor the average American household is taking in enough income to meet their expenditures. The majority of Federal expenditures are an offset to the fact that U.S. households, in aggregate, don’t earn enough to finance basic needs like healthcare and retirement expenditures. To a large extent, the combined deficit reflects a single underlying dynamic. From an accounting standpoint, record corporate profits are the mirror image of that dynamic.
Technical Note: We are not great fans of infinite growth models, but the following result is very general. Consider the Gordon model P = D/(r-g), where P is “fair” price, D is the dividend (or other distribution of cash that the stock is expected to deliver over the coming year), g is the growth rate of future cash flows into the infinite future, and r is the rate at which those cash flows are discounted to present value (which is also the long-term rate of return that investors can expect if they pay price P and future cash flows are delivered as expected). Provided that the long-term trajectory of future cash flows is held constant, reducing r alone will raise the price, and therefore the valuation multiple P/D. Accordingly, the investor's expected future long-term return falls to the lower r that is now embedded in the price. That's the "lower interest rates justify higher valuations" argument. The lower r does still mean that the investment should be expected to have lower future returns as well. In this case, that is accomplished via the higher valuation multiple.
Now, simultaneously reduce both the discount rate r and the growth rate g to the same extent. What happens to the fair value P or the fair valuation multiple P/D? Nothing. Yet even though valuations haven't changed, the lower r does still mean that investors should expect lower future returns as well. In this case, the reduction in future returns is accomplished via the lower growth rate. Paying obscenely higher valuation multiples on the notion that they are "justified" by the lower r actually causes an additional, wholly unjustified collapse in future investment returns, which is exactly what investors appear to have done in in recent years.
U.S. real GDP growth is driven by the sum of two factors: growth in employment (the number of workers) and growth in productivity (output per worker). Based on demographic factors such as population growth and labor participation rates across an aging workforce, combined with an unemployment rate of just 4.3% as of August 2025, projections from the U.S. Bureau of Labor Statistics imply that the employment contribution to GDP growth is likely to average just 0.3% annually over the coming decade; a small fraction of the post-war growth rate. On the productivity side, U.S. productivity has persistently slowed from a post-war average of just over 2% annually, to just 1% over the past decade. That leaves the baseline expectation for real GDP growth, even in the absence of a U.S. recession, at just 1.3% annually.
The following charts illustrate these trends. Note the persistent slowing in the contribution to real GDP from labor force growth in recent decades.
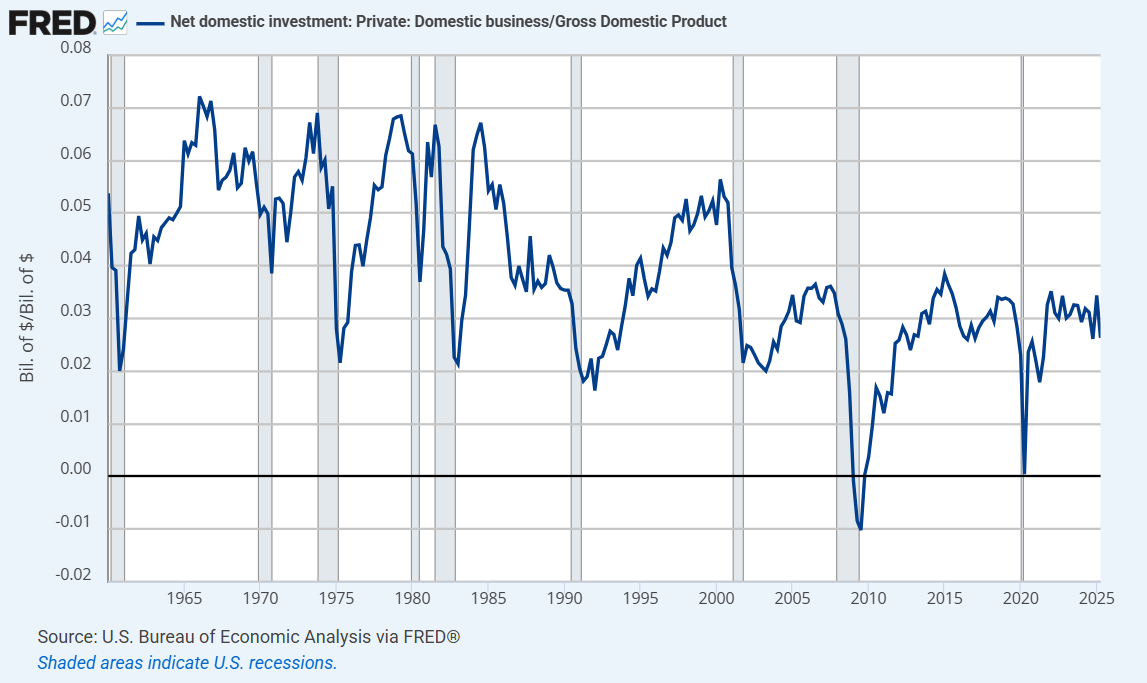
On the productivity front, booms in U.S. productivity are typically paced by growth in capital expenditures and other domestic investment. The chart below shows the progressive deterioration in net business investment as a share of GDP. Despite a moderate surge in investment surrounding artificial intelligence in recent years, net domestic investment continues to run well below the norms that were associated with high real GDP growth in the decades prior to 2000.
The slowing of U.S. labor force growth, coupled with a gradual and persistent slowing in productivity growth, has combined produce a persistent slowing in the rate of potential and actual U.S. real GDP growth. Despite all of the "new era" technological advances since 2000, average annual real U.S. GDP growth has been slower during the past 25 years than in any previous 25-year horizon in in U.S. history