

The Return of Buy-Low Sell-High


John P. Hussman, Ph.D.
President, Hussman Investment Trust
January 2024
The most challenging financial event for investors in the coming decade will be the repricing of securities to valuations that imply adequate long-term returns, following more than a decade of reckless and intentional Fed-induced yield-seeking speculation. Measured from the recent bubble peak, the likely consequence will be a long, interesting, 10-20 year trip to nowhere for the S&P 500. There’s also a strong possibility of an interim loss in the S&P 500 in the range of 50-70% over the completion of this market cycle, or as we observed between 2000-2009, a sequence of cyclical lows punctuated by several extended recoveries. I expect S&P 500 total returns to be negative, on average, for well over a decade – an outcome I also projected at the 2000 market peak.
Meanwhile, be careful not to interpret valuations as near-term market forecasts. That’s not how valuations work. The main thing that determines whether an overvalued market continues to advance, or drops like a rock instead, is whether investor psychology is inclined toward speculation or risk-aversion. The most severe market losses tend to emerge when elevated valuations are joined by deterioration and divergence in market internals, suggesting risk-aversion among investors. Conversely, the strongest opportunities tend to emerge when a material retreat in valuations is joined by broad uniformity in market internals, suggesting speculative psychology among investors.”
– John P. Hussman, Ph.D., Repricing a Market Priced for Zero, April 29, 2022
The S&P 500 is two years into what we expect to be a very long, interesting trip to nowhere. The strongest stock market returns in the coming decade, perhaps longer, are likely to emerge during advances in the S&P 500 that attempt to catch up with the cumulative return of risk-free Treasury bills. Recall that investors experienced the same outcome between 1929-1947, 1968-1985, and 2000-2013, all periods when the total return of the S&P 500 lagged the return of Treasury bills for well over a decade.
The reason we expect the same outcome from the 2022 market peak as we did from the peaks in 1929, 1968, and 2000 is simple: extreme valuations produce dismal long-term outcomes. As I’ve detailed across decades of market cycles (see for example, Making Friends with Bears Through Math), this is not simply a theory. It is arithmetic. Investors are clearly not interested in this arithmetic, for now.
After the 1929-1932 market collapse, Graham & Dodd detailed the arguments that had lulled investors to turn their attention away from valuations in favor of passive investing: “This gospel was based on a certain amount of research, showing that diversified lists of common stocks had regularly increased in value over stated intervals of time for many years past… It was only necessary to buy ‘good’ stocks, regardless of price, and then to let nature take her upward course. The results of such a doctrine could not fail to be tragic.” Today, investors have again abandoned concern about valuations, embracing “passive” strategies in the belief that losses will always be recovered quickly.
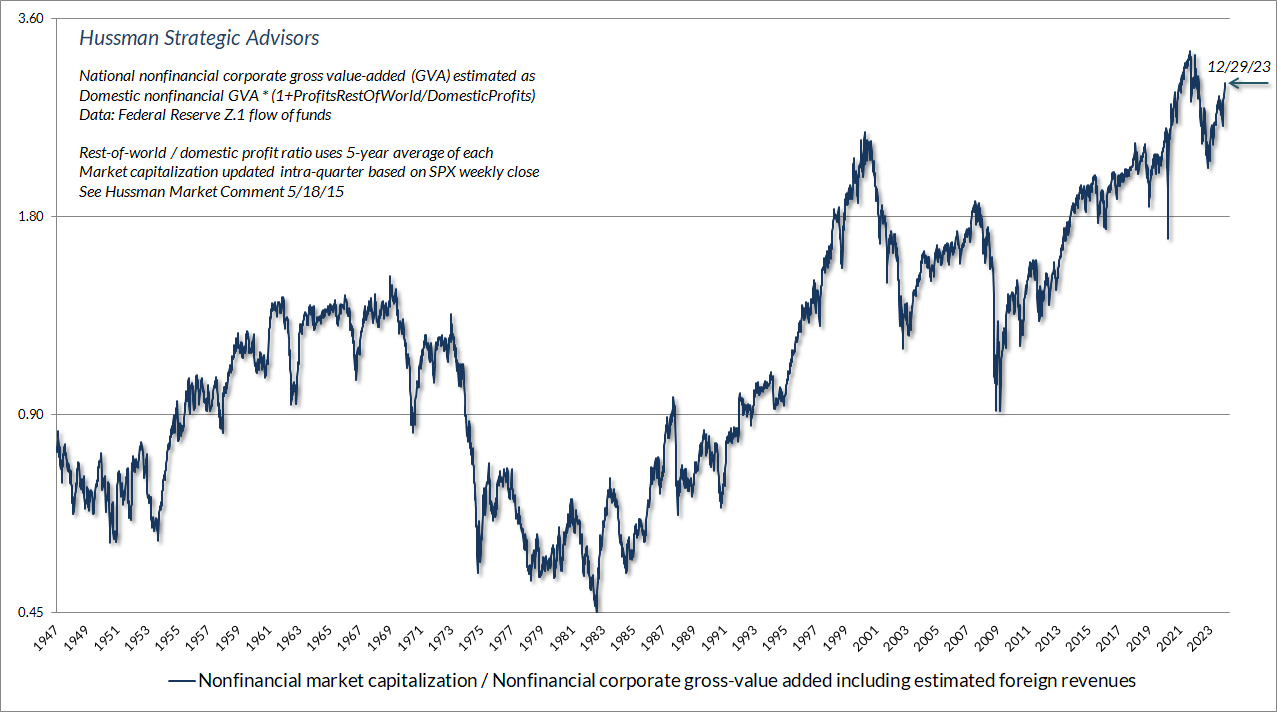
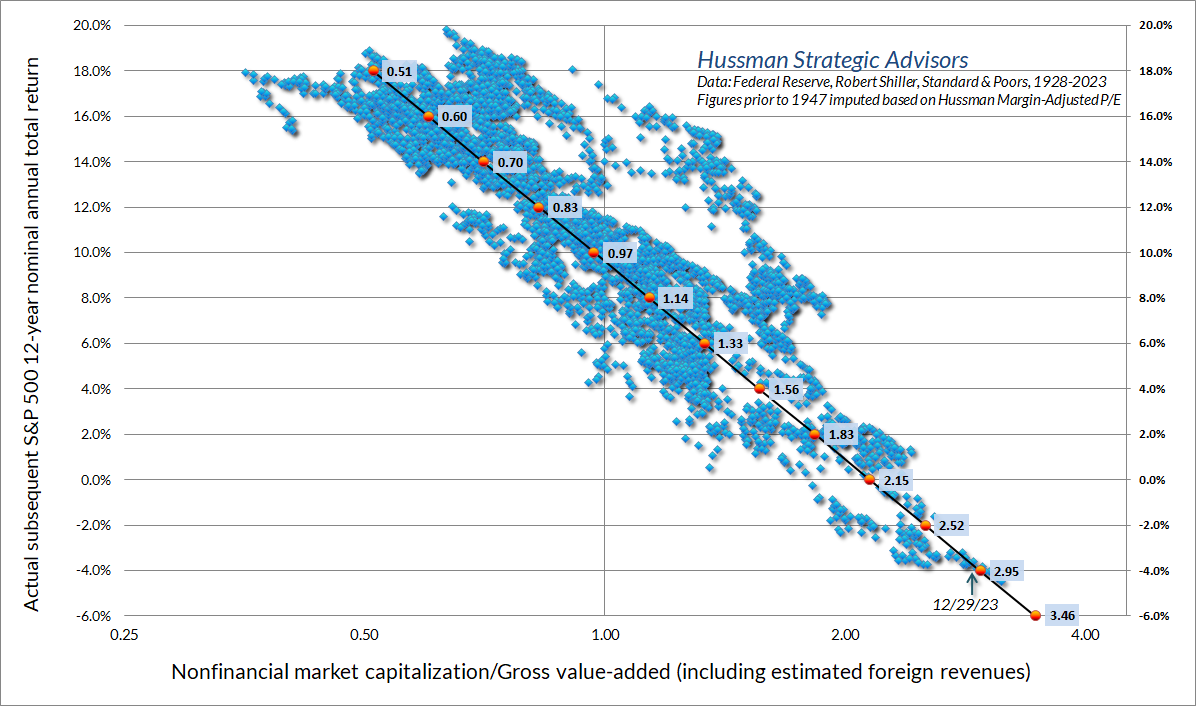
The chart below shows the valuation measure we find best-correlated with actual subsequent returns in market cycles across history: the ratio of nonfinancial market capitalization to gross value-added, including estimated foreign revenues (MarketCap/GVA). The current level is 2.9, slightly below the 2022 record, but higher than any level observed prior to 2021, except for a 12-week period surrounding the 1929 peak. It’s worth noting that historically, a level of about 1.0 has been associated with run-of-the-mill subsequent S&P 500 total returns of about 10% annually. That’s about 65% below current levels. Even restricting the data to the period since the late-1990’s, the level associated with subsequent 10% annual returns is only about 1.2 (see the section titled “You may not like this part” in The Structural Drivers of Investment Returns).
One basic historical feature determines whether a period of time is dominated by the success of “passive,” “buy-and-hold,” “price-insensitive,” “performance stock” investing, or whether it is instead dominated by the success of “buy-low, sell-high,” “full cycle,” “risk-managed,” “flexible,” “margin-of-safety” investment disciplines. That feature is valuation.
An investment security is nothing but a claim to a stream of future cash flows that will be delivered to investors over time. Changes in valuation don’t change the future cash flows. Instead, changes in valuation are a kind of “transformation” between expected future returns and realized past returns. Rising valuations transform expected future returns into realized past returns. Falling valuations transform realized past returns into expected future returns. The cash flows are the same, but the level of valuation at any given time determines whether the returns are in the future or in the past.
Passive investing gains popularity during “secular” advances in valuation – starting from historically depressed valuations that gradually move to historically extreme levels. An extended period of rising valuations means, by definition, that prices must grow faster than fundamentals. Investors mistakenly come to believe that it is enough to buy stocks, regardless of price, “and then to let nature take her upward course.” They gradually imagine that market cycles no longer exist, and that new highs are always restored quickly. The reality is that those increasingly rich valuations have quietly transformed future returns into past returns. The moment that past market returns look the most glorious is the same moment that likely future returns are the most dismal.
In contrast, “buy low, sell high” investing gains popularity during “secular” retreats in valuation – starting from extreme valuations that gradually move toward or below their historical norms, typically over the course of several market cycles. An extended period of even modestly declining valuations means, by definition, that prices must grow slower than fundamentals. That’s what creates those “long, interesting trips to nowhere.” Along the way, investors begin seeing magazine covers like Business Week’s August 1979 issue, “The Death of Equities.” The reality is that while declining valuations can take away past returns, they also quietly transform those losses into likely future returns. The moment that past market returns look the most dismal is the same moment that likely future returns are the most glorious.
Amid a market advance driven by the collective fear of missing out on an expected “Fed pivot,” it’s easy to overlook that the total return of the S&P 500 has already lagged Treasury bills over the past two years. Our own investment discipline has also outperformed the S&P 500 during this period, with substantially less risk, despite last year’s frustrating two-tiered market behavior.
While we expect that the coming years will regularly bring periods of constructive and even aggressive investment opportunities in stocks, these opportunities will most likely involve “segments” of the market cycle. The constructive opportunities will most often emerge in periods when our main gauge of market internals is uniformly favorable, though with safety nets and position limits when valuations are extreme. The aggressive opportunities will typically emerge when material declines in valuation are joined by favorable market internals. Presently, we observe neither. That will change.
Understanding long-term return
The habit of relating what is paid to what is being offered is an invaluable trait in investment. Operations for profit should be based not on optimism but on arithmetic.
– Benjamin Graham
Like Benjamin Graham, I prefer the phrase “buy cheap and sell dear” instead of “buy low, sell high,” because it gauges investment merit based on valuation rather than price alone. It also helps to remind investors that changes in valuation can have profound effects on long-term returns.
If you’re serious about investing, it’s important to understand what drives your returns. The calculations in this very short section may be among the most important ones you do in the next decade. If you’re not on good terms with your calculator, you can pop the calculations into the Google search bar (which is a cool feature).
Average annual total return is a combination of three factors: annual growth in fundamentals, annualized valuation change, and average dividend yield.
Consider the 1982 market low. MarketCap/GVA fell to a level of just 0.44. Because the combination of labor force growth and trend productivity was higher than today, the growth rate of nonfinancial gross value-added and S&P 500 revenues averaged 6.2% annually. The S&P 500 dividend yield shot to 6.7% at the 1982 low and averaged 3.1% between 1982 and 2000. By the March 2000 market peak, the ratio of MarketCap/GVA had not only recovered its historical norm of 1.0 – it reached a bubble extreme of 2.42.
What was the annual total return of the S&P 500 in the 17.7-year period from the 1982 low to the 2000 peak? A combination of revenue growth, the annualized valuation change, and the average dividend yield: (1.062)*(2.42/0.44)^(1/17.7)-1+0.031 = 20% annually.
Consider the current 2.9 level of MarketCap/GVA, along with the 4% annual growth rate of nonfinancial gross value-added and S&P 500 revenues since 2000, and the current index dividend yield of just 1.5%. If valuations remain at current extremes for a decade, prices would – by definition – grow at the same rate as fundamentals. A “permanently high plateau” in valuations, coupled with 4% growth plus 1.5% in dividends, would imply 10-year S&P 500 total returns averaging 5.5% annually.
Now change just one assumption: allow MarketCap/GVA to retreat to 1.7, roughly half-way to its historical norm, and no lower than the 2020 valuation trough. In that case, the estimated 10-year total return of the S&P 500 falls to 1.04*(1.7/2.9)^(1/10)-1+0.015 = zero.
Finally, imagine that MarketCap/GVA touches its historical norm of 1.0 a decade from today, but without moving even lower as it did in 2009 and nearly every other market cycle in U.S. history. Let’s also be optimistic and assume 5% annual growth in revenues and gross-value added, either due to faster real growth or above-target inflation. In that case, the estimated 10-year S&P 500 nominal total return would be negative. The arithmetic is simple but unpleasant: 1.05*(1.0/2.9)^(1/10)-1+.015 = -4.1% annually.
Natixis recently released their 2023 Global Survey of Individual Investors, surveying investor expectations about future returns. Presently, U.S. investors expect stock market returns to outpace inflation over the long-term by 15.6% annually (down from 17.5% in 2022), while investment professionals expect stocks to outpace inflation by “only” 7% annually.
Let’s be clear. Even on a 10-year horizon, the only times in history that S&P 500 total returns outpaced inflation by 15.6% annually were periods that began with MarketCap/GVA below 0.8, less than one-third of current levels. Indeed, even if we examine periods when stocks outpaced inflation by “only” 7% annually over the following decade, the average starting level of MarketCap/GVA was 0.83.
For a derivation and review of total return arithmetic, which holds for any fundamental one chooses (though some are more useful than others), see Making Friends with Bears Through Math. The section titled “Geek’s Note: Methods and arithmetic of valuation and total return estimates” in Headed for the Tail offers additional discussion of nominal versus real return estimates.
Another long, interesting trip to nowhere
Are we the only sane people on the planet? Let’s not be shy: regardless of short-term action, we ultimately expect the S&P 500 to fall by more than half, and the Nasdaq by two-thirds. Shorter term, we have another story. We can say without hesitation that this market looks similar in nearly every respect to the 1929, 1968 and 1972 tops, but the finer interpretation becomes less clear. Is the current market like October 1929, or is it more like, April? If it’s like April, then we’ve got a few months of advances ahead of us. Is the current market like the November 1968 top? If so, the ‘new era’ stocks didn’t start crashing until about June of 1969. Once again, it makes a difference in the short term.
Frankly, we can’t say that this market is characterized only by the exact peaks of 1929, 1968 and 1972. In all three cases, there was a long and pronounced divergence between the broad market and the popular averages for months. The 1929 and 1972 instances were primarily blue-chip frenzies, while the late 1960’s instance was a performance stock frenzy. This time we have both, so we’ll probably see tops on two dates – one in the S&P and one in the Nasdaq. The difficult part of all this is the short term. I have no answer for that, except that in each prior instance, every scrap of short-term gain was wiped out in the eventual downturn.
A final note, I don’t write like this because I want to go ‘on the record’ before a plunge. I write like this because I know the terrible financial difficulty and utter shock that investors felt following declines which originated in similar conditions. Some of my more seasoned subscribers also lived through the 1969-70 and 1973-74 plunges, and have related the pain of buying respectable stocks on a 20-30% dip, only to watch their portfolio cut in half from there. When people watch the Nasdaq, there is a real pressure to chase performance. It can really seem like defensiveness is an enemy, and speculation is a friend. And again, the same was true in the late 1960’s, when McGeorge Bundy of the Ford Foundation directed the managers of university endowments to become more aggressive: ‘We have the preliminary impression that over the long run, caution has cost our colleges and universities much more than imprudence or excessive risk-taking’. In the plunge that followed, that preliminary impression turned out to be horribly incorrect.”
– John P. Hussman, Ph.D., February 9, 2000
The bubble peak a few weeks later was followed by a 50% loss in the S&P 500 Index, a 78% loss in the Nasdaq Composite Index, and an 83% loss in the tech-heavy Nasdaq 100 Index.
The chart below presents the S&P 500 in a long-term context, relative to valuations based on MarketCap/GVA. The blue line on the chart below shows the S&P 500 Index. The heavy green line shows the level of the S&P 500 that has historically been consistent with long-term expected nominal S&P 500 total returns averaging 10% annually. The dashed blue line shows the level of the S&P 500 that we estimate as consistent with S&P 500 annual total returns 5% over-and-above the prevailing yield on 10-year Treasury bonds (the historical average of the “equity risk premium”). The dotted orange line shows the level of the S&P 500 that we estimate as consistent with S&P 500 annual total returns no higher than the prevailing yield-to-maturity on 10-year Treasury bonds. Finally, the yellow bubbles show the rare points in history when estimated S&P 500 total returns were actually below the yield of 10-year Treasury bonds.
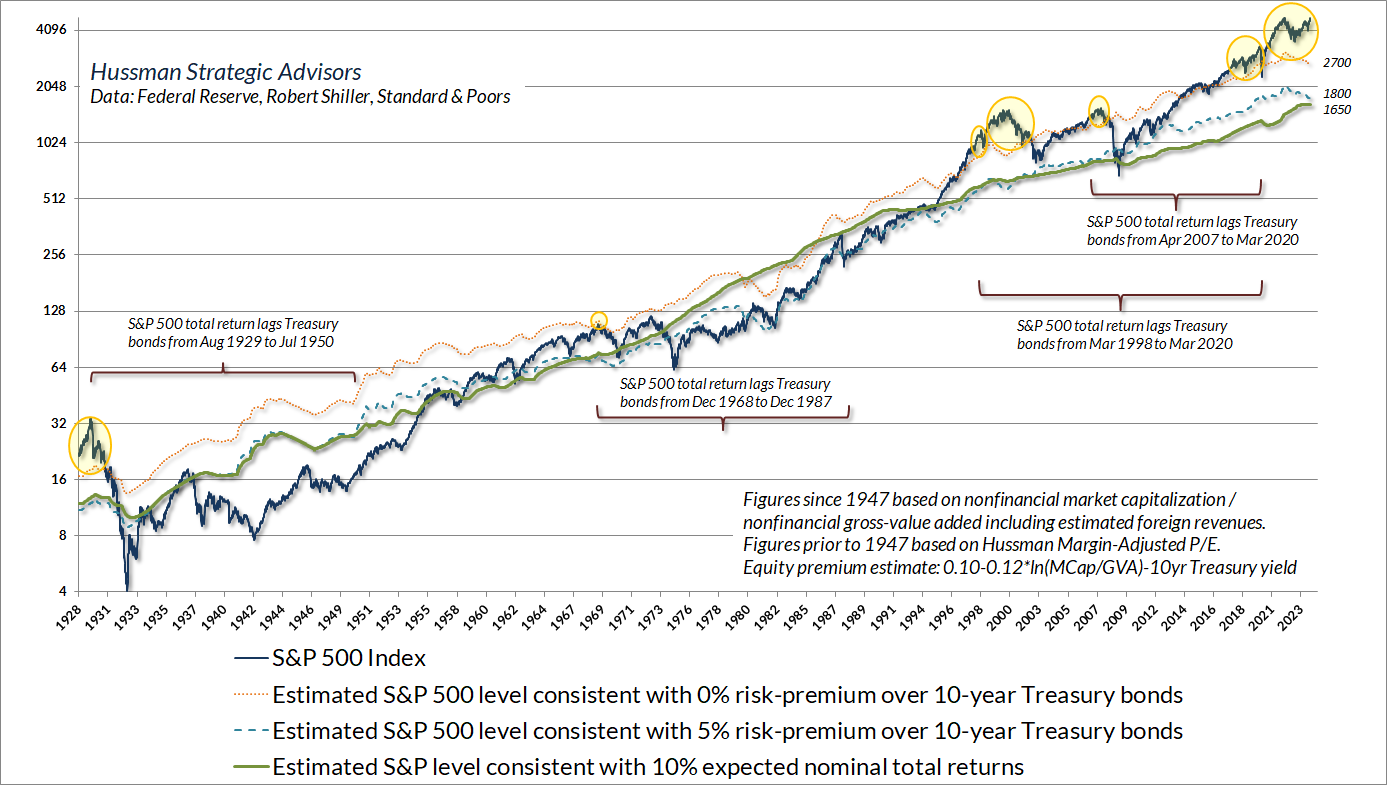
Notice the red brackets in the chart. Each of those brackets show periods when the actual subsequent total return of the S&P 500 lagged the total return of 10-year Treasury bonds. This is the outcome we expect from current levels. Indeed, we believe that this long, interesting trip to nowhere began two years ago, at the January 2022 market peak.
The strongest stock market returns in the coming decade, perhaps longer, are likely to emerge during advances in the S&P 500 that attempt to catch up with the cumulative return of risk-free Treasury bills. While we expect that the coming years will regularly bring periods of constructive and even aggressive investment opportunities in stocks, these opportunities will most likely involve ‘segments’ of the market cycle.”
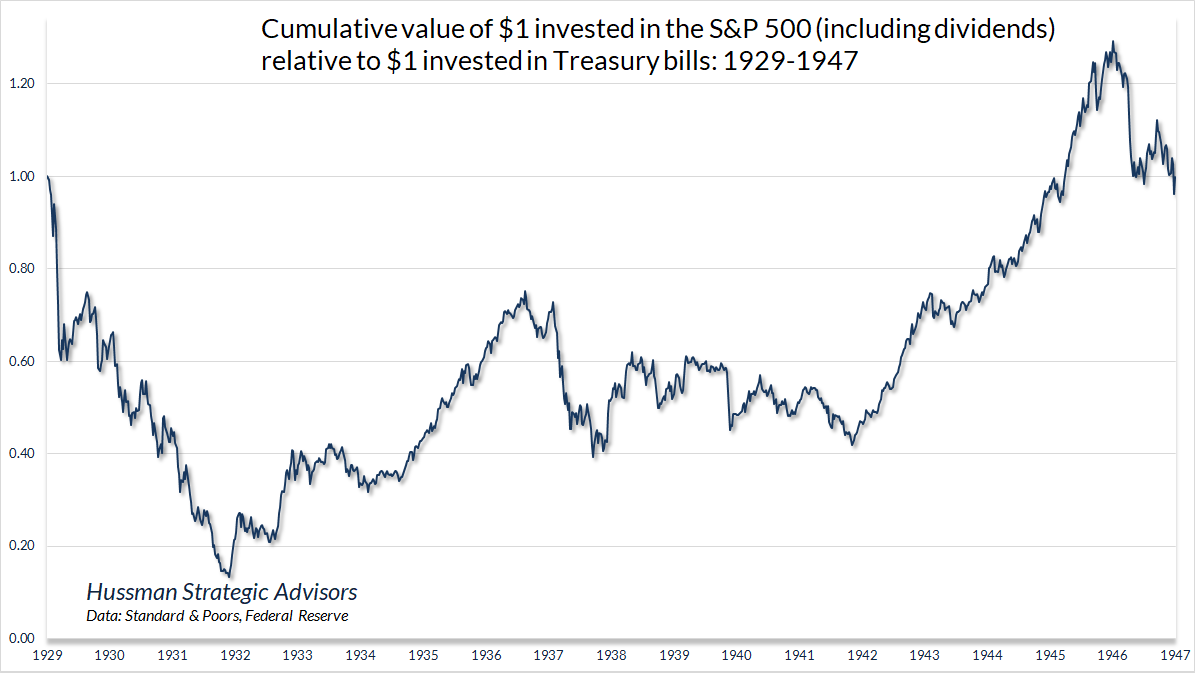
The charts below offer some foreshadowing of what we expect over the coming 10-20 year period. The strongest market returns are likely to emerge following selloffs that place the S&P 500 deeply behind the cumulative total return on Treasury bills, and then attempt to recover part, and eventually all, of that loss over time.
The chart below shows the cumulative total return of $1 invested in the S&P 500 relative to $1 invested in Treasury bills, for the period from August 1929 through May 1947.
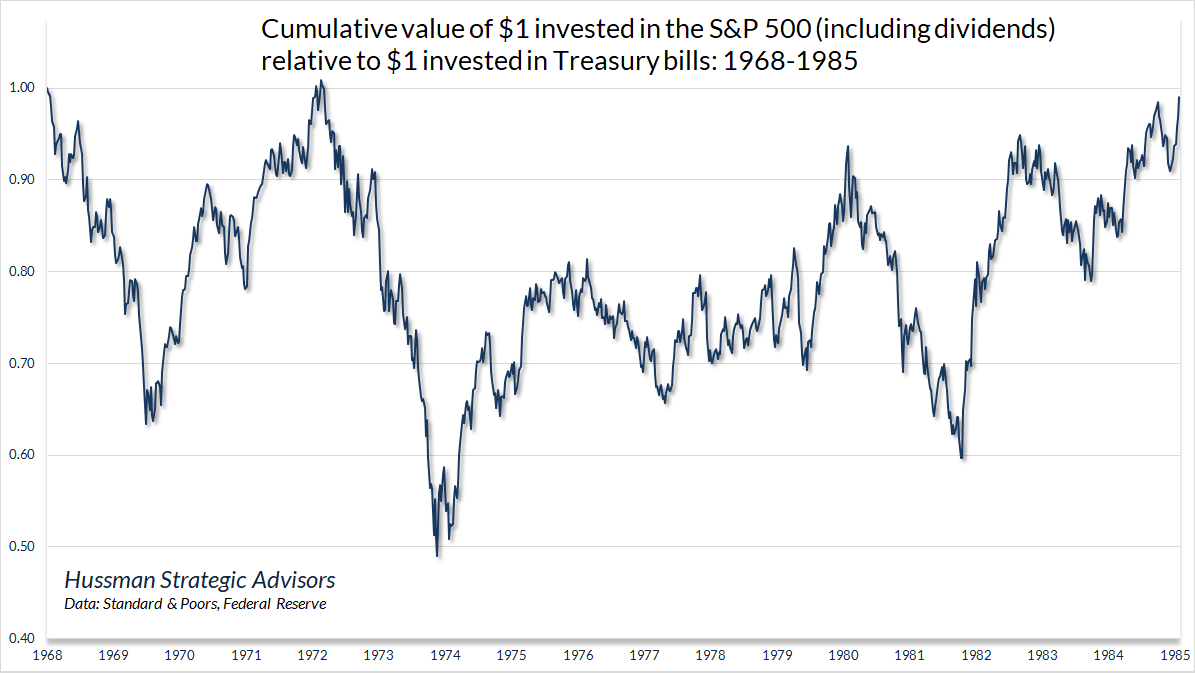
The next chart shows the period from November 1968 through November 1985. It’s worth noting that one can identify a longer period of underperformance measured from February 1966 through March 1985, but I’ve chosen the shorter and starker period measured from the 1968 peak because that’s the point where valuations provided a clearer signal of long-term risk.
You’ll notice that the market advance to the 1972 peak briefly brought the cumulative total return of the S&P 500 back to the cumulative total return of Treasury bills, before collapsing again. That’s why I call these long trips to nowhere “interesting.”
The chart below shows the period from March 2000 through April 2013. This is what happens when those yellow bubbles burst.
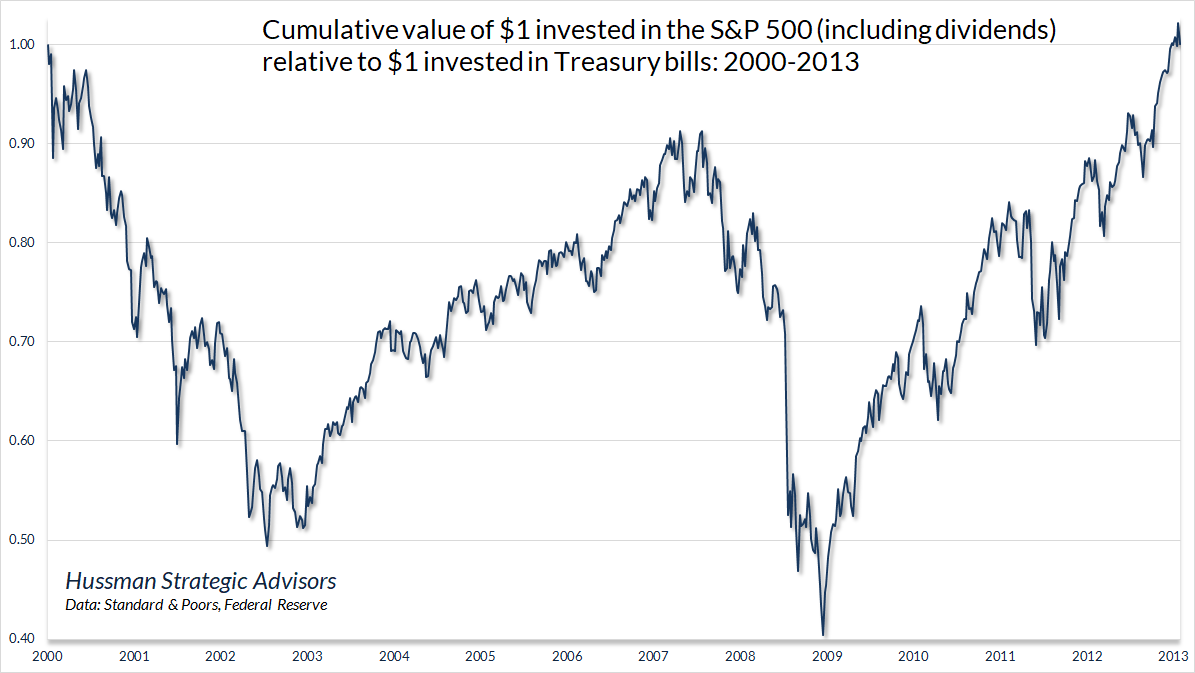
Taken together, the cumulative total return of the S&P 500 lagged the cumulative total return of Treasury bills for close to 50 years of the 84-year period from 1929 to 2013. Those lagging returns had the same source – extreme valuations. These extremes were observable in 1929, 1968 and 2000, as they are today, at the beginning of those long, interesting trips to nowhere.
The fact that we expect another long, interesting 10-20 year trip to nowhere for the S&P 500 – measured from current valuations – does not mean that we believe that the market will be “uninvestable” for 10-20 years. To the contrary, the deepest market losses typically emerge a few years into these periods of revaluation. Once valuations approach or breach their historical norms, typical long-term expected returns are restored. Even in the 2000-2013 period, adequate valuations were restored by late-2002, encouraging us to remove the majority of our hedges in early 2003. Still, the overvaluation of the 2000 bubble was not fully resolved until the market collapse of 2008-2009 drove the S&P 500 below its 2002 trough.
The best way to begin this comment is to reiterate that U.S. stocks are now undervalued. I realize how unusual that might sound, given my persistent assertions during the past decade that stocks were strenuously overvalued (with a brief exception in 2003). Still, it is important to understand that a price decline of over 40% (and even more in some indices) completely changes the game. Last week, we also observed early indications of an improvement in the quality of market action, and an easing of the upward pressure on risk premiums.
In 2000, we could confidently assert that stocks would most probably deliver negative total returns over the following 10-year period. Today, we can comfortably expect 8-10% total returns even without assuming any material increase in price-to-normalized-earnings multiples. Given a modest expansion in multiples, a passive investment in the S&P 500 can be expected to achieve total returns well in excess of 10% annually.”
– John P. Hussman, Ph.D., Why Warren Buffett is Right, and Why Nobody Cares, October 20, 2008
Emphatically, nothing in our investment discipline relies on valuations to approach or breach their run-of-the-mill historical norms. Even if valuations never revisit their historical norms, shifts in the uniformity and divergence of market internals alone should provide sufficient opportunities to change our investment outlook, possibly even in the coming quarters. Still, the strongest market return/risk profiles generally emerge when a material retreat in valuations is joined by an improvement in the uniformity of market action. As I noted last month (see The Secret Life of Fed Pivots), I believe that a loss of about 42% in the S&P 500 would be a fairly minimal expectation over the completion of this cycle, and that a loss of 65% would be required to restore historically run-of-the-mill expected market returns, but again, nothing in our discipline relies on these outcomes.
How I acquired the “permabear” label
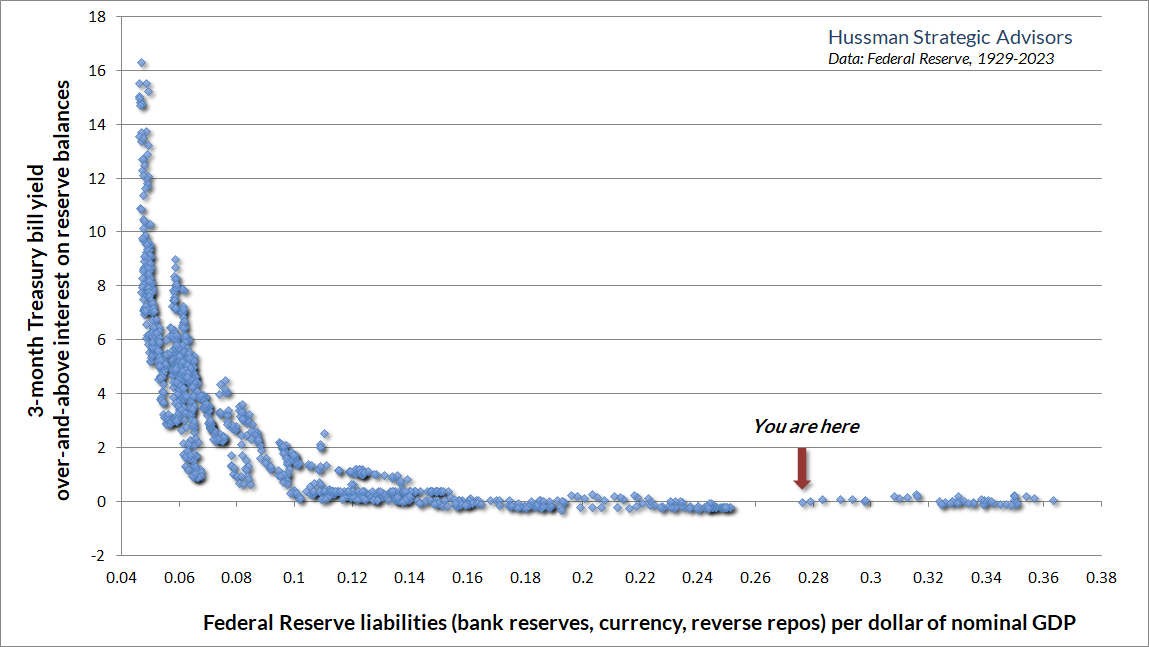
I regularly discuss my error in the face of the Federal Reserve’s unprecedented and experimental monetary interventions – quantitative easing (QE) and zero interest rate policy (ZIRP) – because it’s essential for investors to learn the right lesson from the recent bubble. The only thing truly “different” about this bubble is that zero interest rate policy disabled historically reliable “limits” to speculation. In previous market cycles across history, these limits could be gauged by extreme syndromes of “overvalued, overbought, overbullish” market action. Because of that reliability, these syndromes gained priority in our discipline when we stress-tested our methods against Depression-era data in 2009-2010.
Once interest rates hit zero, and the quantity of zero-interest liquidity exceeded the previous historical extreme of 16% of GDP (on its way to 36% in 2022), investors lost their minds. Someone had to hold the stuff (there are no “sidelines”) and nobody wanted to. Every dollar a buyer puts “into” the market immediately comes “out” in the hands of a seller. The discomfort of holding 16-36% of GDP in zero-interest hot potatoes led investors to embrace the mantra “there is no alternative” (TINA) other than speculation. In previous market cycles, it was correct to respond bearishly to historically-reliable “limits.” Amid QE and ZIRP, our bearish response proved detrimental except when market internals had deteriorated explicitly.
In late-2017, we abandoned our bearish response to these overextended syndromes in periods when market internals were still favorable. Still, refraining from a bearish outlook isn’t the same as adopting a constructive one. In 2021, we expanded our willingness to adopt a constructive outlook even amid hypervalued market conditions (with position limits and safety nets of course) when internals are favorable – something Benjamin Graham might describe as “intelligent speculation.” That would be our outlook today if market internals were favorable.
Though our gauge of market internals doesn’t capture every individual market advance or decline, internals did beautifully in the recent market cycle, as they have in previous complete cycles. Likewise, valuations have remained well-correlated with subsequent market returns even in recent decades. Ignoring valuations and market internals would be the wrong lesson to draw from this bubble. These are exactly the tools that allowed us to admirably navigate decades of complete market cycles – prior to the Federal Reserve’s deranged policy experiment with zero interest rates during the recent, decidedly incomplete half-cycle. Nobody in the financial markets would know my name otherwise.
Valuations largely determine long-term returns and full-cycle risks. Internals gauge the speculative and risk-averse psychology that drives valuations higher or lower. Once you know the starting valuation and the likely pressures on valuation, arithmetic tells you the expected total return. It was our bearish response to historically reliable “limits” that created difficulties. TINA, ZIRP and QE disabled those “limits” – as long as speculative pressures were actually present, which we gauge based on the uniformity of market internals. We’ve adapted accordingly. Even if the future holds endless amounts of TINA, ZIRP, and QE, nothing in our discipline will encourage us to adopt a bearish outlook when market internals are favorable.
“Purely psychological elements”
Investors somehow want to imagine that “liquidity” has more mysterious effects than forcing psychological discomfort on holders who, in aggregate, can’t get rid of the stuff. The word “liquidity” has gained a magical, hand-wavy mystique among investors in recent years; increasingly used as a bullish thesis within itself, with little need for additional support, much less any examination of the mechanisms that link this liquidity to asset prices.
On this subject, it’s important to understand that despite trillions of dollars of liquidity (formerly zero-interest) created by the Fed from 2008 through 2022, total lending by U.S. commercial banks grew at just 3.4% annually – the slowest growth rate in history. The “liquidity” created by the Fed did very little to promote economic activity. It was simply a substitute for interest-bearing Treasury securities that investors would have held otherwise, if the Fed had not sucked them into its own balance sheet.
It was the discomfort of holding massive amounts of zero-interest liquidity, and the futile attempt by each successive holder to pass it off to someone else, that drove this speculative bubble. Much of this liquidity is still held within the U.S. banking system, mainly as reserves that back $7 trillion of uninsured deposits. As I detailed in the Financial Times after the failure of Silicon Valley Bank (see Too much Fed liquidity has led to a whack-a-mole world of problems), the deposits are there because the Fed put them there. That’s still a deranged amount of Fed liabilities, but the zero-interest feature is no longer present. The Fed is currently holding interest rates well above zero by paying banks 5.4% interest on those reserve balances (IORB).
There’s no question that the Fed encouraged a decade of reckless speculation, driven by the frantic, futile attempt of investors to get rid of 16-36% of GDP in zero-interest liquidity. But be careful to understand that the impact of “liquidity” on the financial markets relies entirely on the willingness of investors to speculate (which we infer from the uniformity of market internals). To talk about “liquidity” as if it is some sort of magical pixie dust is not analysis but superstition. What created this bubble is the same thing that created every other bubble in history: the psychological rationalization of speculation as “investment.”
One of the striking features of the past five years has been the domination of the financial scene by purely psychological elements. In previous bull markets the rise in stock prices remained in fairly close relationship with the improvement in business during the greater part of the cycle; it was only in its invariably short-lived culminating phase that quotations were forced to disproportionate heights by the unbridled optimism of the speculative contingent.
But in the 1921-1933 cycle this ‘culminating phase’ lasted for years instead of months, and it drew its support not from a group of speculators but from the entire financial community. The ‘new era’ doctrine – that ‘good’ stocks were sound investments regardless of how high the price paid for them – was at bottom only a means of rationalizing under the title of ‘investment’ the well-nigh universal capitulation to the gambling fever.
Why did the investing public turn its attention from dividends, from asset values, and from average earnings to transfer it almost exclusively to the earnings trend, i.e. to the changes in earnings expected in the future? The answer was, first, that the records of the past were proving an undependable guide to investment; and, second, that the rewards offered by the future had become irresistibly alluring.
Along with this idea as to what constituted the basis for common-stock selection emerged a companion theory that common stocks represented the most profitable and therefore the most desirable media for long-term investment. This gospel was based on a certain amount of research, showing that diversified lists of common stocks had regularly increased in value over stated intervals of time for many years past.
These statements sound innocent and plausible. Yet they concealed two theoretical weaknesses that could and did result in untold mischief. The first of these defects was that they abolished the fundamental distinctions between investment and speculation. The second was that they ignored the price of a stock in determining whether or not it was a desirable purchase.
The notion that the desirability of a common stock was entirely independent of its price seems incredibly absurd. Yet the new-era theory led directly to this thesis… An alluring corollary of this principle was that making money in the stock market was now the easiest thing in the world. It was only necessary to buy ‘good’ stocks, regardless of price, and then to let nature take her upward course. The results of such a doctrine could not fail to be tragic.
That enormous profits should have turned into still more colossal losses, that new theories should have been developed and later discredited, that unlimited optimism should have been succeeded by the deepest despair are all in strict accord with age-old tradition.”
– Benjamin Graham & David L. Dodd, Security Analysis, 1934
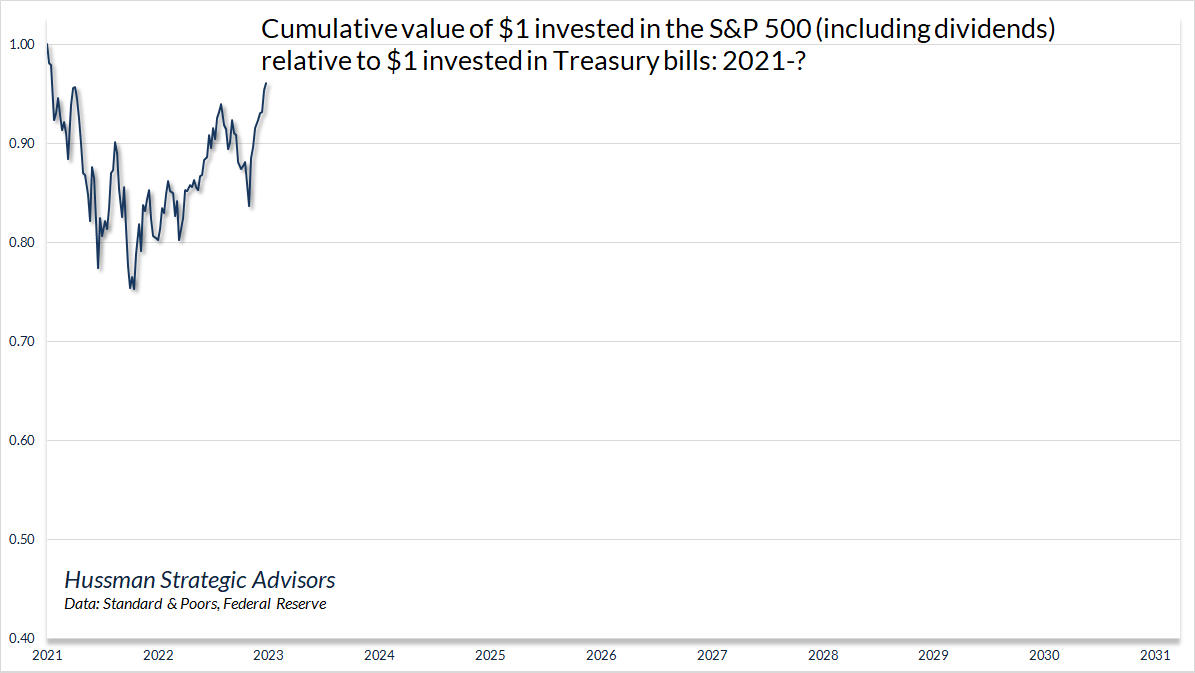
Return-free risk
The chart below shows the period from January 2022 to the present. The chart is slightly rhetorical, but it’s intended to emphasize that I believe that the market is already two years into another long, interesting trip to nowhere. In my view, the advance that the market enjoyed in 2023 was little more than an attempt to grasp at the suds of yesterday’s bubble. There’s nothing in particular that rules out an outcome like 1972, when the cumulative total return of the S&P 500 briefly clawed its way ahead of Treasury bill returns. Still, as I’ve detailed in prior comments (see Making Friends With Bears Through Math and The Structural Drivers of Investment Returns), the arithmetic of prospective returns is daunting at these valuations – essentially requiring a “permanently high plateau” in stock market valuations simply to produce long-term expected S&P 500 total returns in the mid-single digits.
There are only a few points in history when market valuations reached levels that implied 10-year S&P 500 total returns below 10-year Treasury yields. Recall those yellow bubbles: 1929, 1968, 1998-2000, 2007, and most of the period since 2017 apart from the 2020 market lows. Yes, stocks have historically outperformed both Treasury bonds and T-bills. The rare and extreme exceptions, like today, create opportunities for investors to avoid a decade or more of frustration.
The scatter below shows the relationship between MarketCap/GVA and actual subsequent 12-year S&P 500 total returns. At present, we estimate that the S&P 500 is likely to have average losses in the range of -2.7 to -3.6% annually, including dividends, over the coming 10-12 year period.
Our 10-year S&P 500 total return projections have generally been negative since 2020. While our investment discipline was ahead of the S&P 500 from the 2020 pre-pandemic peak through late-October of this year, neither valuations nor continued unfavorable market internals have prevented investors from chasing stocks higher since November, in hopes of getting out in front of an expected “pivot” by the Federal Reserve in favor of lower interest rates. As I wrote about such short-term outcomes in 2000, “I have no answer for that, except that in each prior instance, every scrap of short-term gain was wiped out in the eventual downturn.”
In my view, the main impact of the recent advance has been to make likely long-term outcomes worse. If our measures of internals improve, we’ll at least temporarily lean toward a neutral or constructive near-term outlook, though undoubtedly with safety nets and position limits given current valuation extremes.
Investors are familiar with the idea of a ‘tradeoff’ between return and risk, which is typically stated as a proposition that investors must accept higher risk if they seek higher expected returns. What investors are typically not taught is that this proposition applies only to ‘efficient’ risks. For example, if a portfolio is poorly diversified, one can typically find another portfolio that can target a higher level of expected return for the same amount of risk, or a lower level of risk for the same expected return. Likewise, in a wildly overvalued market, investors should expect not only poor returns but also higher prospective risk. Put simply, investors are not somehow rewarded for accepting higher levels of what Ben Graham described as ‘unintelligent’ risk.
From a valuation standpoint, there is no ‘tradeoff’ between return and risk. Rather, depressed valuations tend to be followed by both strong long-term returns and modest subsequent losses, while extreme valuations tend to be followed by both poor long-term returns and deep subsequent losses. By relentlessly depriving investors of risk-free return, the Federal Reserve has spawned an all-asset speculative bubble that we estimate will provide investors little but return-free risk.”
– John P. Hussman, Ph.D., Return-Free Risk, January 14, 2022
Market internals remain divergent
It’s important to emphasize, as always, that while valuations have an enormous impact on the returns investors can expect over the long-term, and the potential depth of market losses over the completion of any given market cycle, valuations often have very little impact on outcomes over shorter segments of the market cycle. Even extreme valuations do not necessarily imply near-term market losses. When investors are sufficiently inclined to speculate, they can even ignore valuations for years – indeed, that’s the only way that speculation can produce a bubble as extreme as we observe at present.
We gauge investor psychology – speculation versus risk-aversion – based on the uniformity of market action across thousands of individual stocks, industries, sectors, and security-types, including debt securities of varying creditworthiness. When investors are inclined to speculate, they tend to be indiscriminate about it. As usual, in every noise-reduction problem, uniformity matters.
In healthy new bull markets, uniformity of market internals and price-volume behavior typically emerges quickly, often right away. Likewise, internals typically deteriorate before or very early into steep market losses. But this does not mean internals “catch” every move. The 2000-2002 and 2007-2009 market declines featured very long periods when our main gauge of market internals remained defensive, despite several rather strong “bear market rallies.” In both cases, latent risk-aversion and economic strains later resolved into steep market declines. In general, trying to make internals more “sensitive” to short-term advances like we’ve observed in recent weeks typically makes the shifts vulnerable to “whipsaws” – encouraging one to chase an advancing market, followed by an immediate reversal that forces one to sell into a declining market. As a result, the attempt to “catch” more rallies tends to produce lower long-term returns and deeper interim losses.
As I noted in 2021, we did make an effective adaptation to our gauge of market internals in response to zero-interest rate policy, adopting a slightly more “permissive” threshold when rates are near zero and certain measures of risk-aversion are well-behaved. Yet since 1998, when I introduced market internals into our investment discipline, I’ve found it difficult to improve on the original concept: when investors are inclined to speculate, they tend to be indiscriminate about it.
Our main gauge of internals balances all of these considerations. While we would adopt a neutral or constructive outlook, at least temporarily, in response to a favorable shift in uniformity, internals presently remain divergent enough, whipsaw risk remains strong enough, valuations remain extreme enough, and market action remains overextended enough, to hold us to a clearly negative outlook. As I noted last month, more often than not, divergences between market internals and more popular “trend following” measures have tended to be resolved in favor of broad internals. That may or may not be the case in this specific instance, but we’ll respond to shifts in our key measures – mainly valuations and market internals – as they emerge.
The chart below presents the cumulative total return of the S&P 500 in periods where our main gauge of market internals has been favorable, accruing Treasury bill interest otherwise. The chart is historical, does not represent any investment portfolio, does not reflect valuations or other features of our investment approach, and is not an assurance of future outcomes.
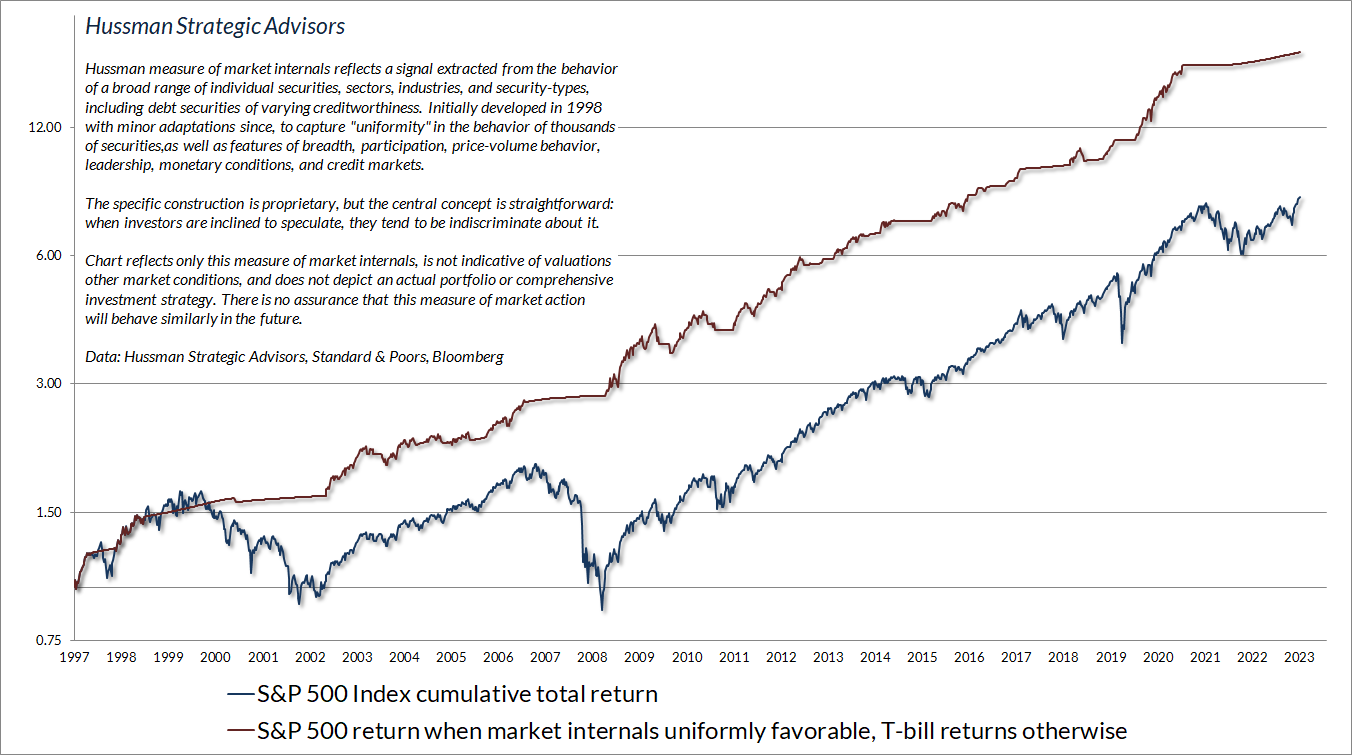
One of the most obvious features of divergent market action during 2023 was the concentration of speculation in a handful of glamour tech stocks (the “Magnificent Seven,” comprised of Apple, Microsoft, Alphabet, Amazon, Meta, Tesla, and NVIDIA). Strikingly, the capitalization-weighted S&P 500 Index outpaced the equal-weighted S&P 500 by more than 12.4% in 2023. Same stocks, just different weighting. This has easily been the primary headwind for hedged equity strategies in the past year.
This sort of divergence is also a regular feature of extreme market peaks. It’s easy to forget that bubbles typically end with frenzies in “blue chips” or “performance stocks.” At moments like the present, it’s important that investors remember. As Forbes observed after the “Nifty Fifty” collapsed in 1973-74, “The delusion was that these companies were so good that it didn’t matter what you paid for them; their inexorable growth would bail you out.”
On Wall Street, urgent stupidity has one terminal symptom, and it is the belief that money is free. Investors have turned the market into a carnival, where everybody ‘knows’ that the new rides are the good rides, and the old rides just don’t work. Where the carnival barkers seem to hand out free money just for showing up. Unfortunately, this business is not that kind – it has always been true that in every pyramid, in every easy-money sure-thing, the first ones to get out are the only ones to get out. We’ve seen two-tiered markets before: most prominently in 1929, 1968-69, and 1972.
Over time, price/revenue ratios come back in line. Currently, that would require an 83% plunge in tech stocks (recall the 1969-70 tech massacre). The plunge may be muted to about 65% given several years of revenue growth. If you understand values and market history, you know we’re not joking.”
– John P. Hussman, Ph.D., March 7, 2000
The tech-heavy Nasdaq 100 Index went on to lose an implausibly precise 83% by 2002
Straight down the rabbit hole
As I’ve noted over the years, there are very few conditions in which we have any specific expectations for near-term market action. The exceptions are when the market is strenuously overextended in a “trap door” situation combining rich valuations with unfavorable internals, or when the market is strenuously compressed following a material improvement in valuations.
I noted one of those exceptions in the July comment – Air Pockets, Free Falls, and More Cowbell – describing “a particular ‘setup’ that we’ve historically found to be associated with abrupt ‘air pockets’ and ‘free falls’ in the S&P 500. It combines hostile conditions in all three features most central to our investment discipline: rich valuations, unfavorable market internals, and extreme overextension. The July instance was followed by a correction of nearly 10% into late-October.
While we don’t view these syndromes as “forecasts,” it’s worth noting that the same combination of extremes emerged again between December 18-28. In most cases, this sort of overextension has been followed by corrections on the order of 10-12% over the following 15 weeks or so, often with significant losses in the first 15-45 sessions.
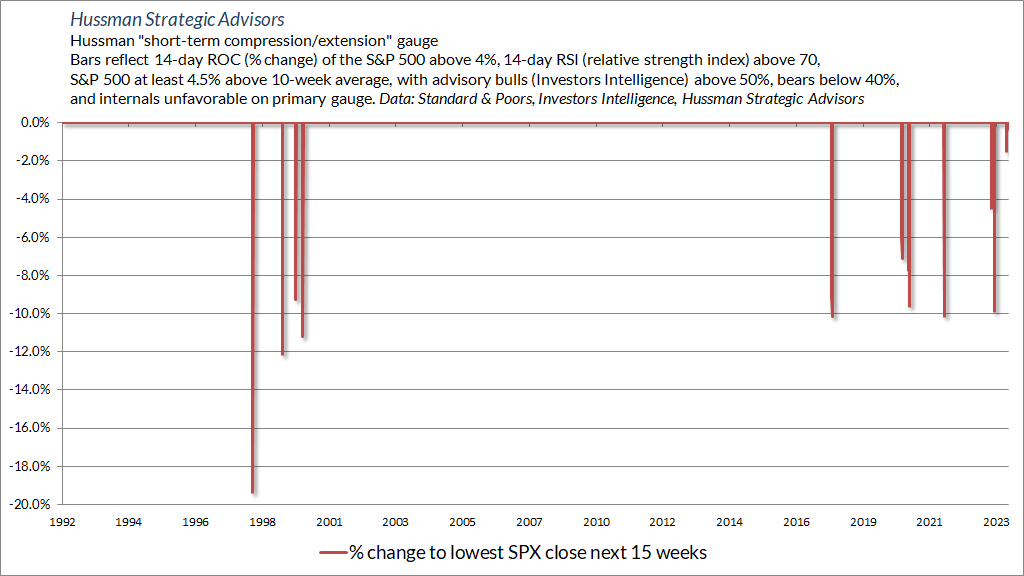
The past two weeks have also generated a preponderance of warning syndromes I discussed in the November 20, 2021 comment Motherlode. Even with the recent “Pivot FOMO” advance, it’s worth noting that total return of the S&P 500 has lagged Treasury bills since that time, with an interim loss of -24.49%. Based on a large set of measures including valuations, internals, sentiment, and economic factors, we presently estimate that current market conditions “cluster” among the worst 0.3% instances in history – more similar to major market peaks and dissimilar to major market lows than 99.7% of all post-war periods.
Again, I generally have no expectations about near-term market outcomes, because random noise usually dominates any predictable signal. Market conditions as extreme as today are among the exceptions. In prior instances belonging to this “cluster,” the S&P 500 has typically gone straight down the rabbit hole, with 10% “air pockets” being most frequent, but also including quick losses of 20% (1998) to 30% (1987, 2020). That doesn’t ensure the current instance will be resolved the same way. It’s just a statement about present, extreme, observable conditions, and regularities that have typically followed.
As I emphasized in Motherlode: “Not a forecast. Not a ‘limit.’ Not a market call. Just sharing what we’re seeing. Still, it’s fair to add that we’ve never seen such a thing.”
Caution signals amid joyful noise
While we believe that our policy rate is likely at or near its peak for this tightening cycle, the economy has surprised forecasters in many ways since the pandemic, and ongoing progress toward our 2 percent inflation objective is not assured. We are prepared to tighten policy further if appropriate. In our SEP (Summary of Economic Projections), FOMC participants wrote down their individual assessments of an appropriate path for the federal funds rate based on what each participant judges to be the most likely scenario going forward. While participants do not view it as likely to be appropriate to raise interest rates further, neither do they want to take the possibility off the table. These projections are not a Committee decision or plan; if the economy does not evolve as projected, the path of policy will adjust as appropriate. Everybody wrote down an SEP forecast. So many people mentioned what their rate forecast was. And there was no back-and-forth, no attempt to sort of reach agreement like, ‘This is what I wrote down; this is what I think,’ that kind of thing. There’s a general expectation that this will be a topic for us, looking ahead. That’s really what happened in today’s meeting.”
– Federal Reserve Chairman Jerome Powell, December 13, 2023 Press Conference
On the basis of these comments, the financial markets now expect seven 0.25% cuts in the Federal Funds rate in the coming year. Investors ignored what Powell actually said, heard what they wanted to hear, and focused almost entirely on those SEP projections (the “dot plot”). The problem is that the SEP forecasts of FOMC members are projections, and in many cases seem to be nothing but noise – extrapolation of recent trends, or slight departures from recent interest rates. Indeed, over the past decade, the Fed’s median year-ahead SEP projection for the Fed Funds rate has had a correlation of 0.6 with the subsequent rate. That may sound promising, until one realizes that the prevailing Fed Funds rate itself has had a correlation of 0.6 with the Fed Funds rate one year later.
In every noise-reduction problem, uniformity matters. There is vastly more information in the common signal drawn from multiple sensors than there is in any single measure by itself.
In our view, it’s best to approach the Fed Funds rate based on the systematic use of data, rather than simply extrapolating recent trends. The blue estimate below has had a correlation near 0.9 with the subsequent year Fed Funds rate, with half the mean squared error of the Fed’s median SEP projections. We don’t consider the estimate below to be a “forecast,” but it’s at least consistent with decades of actual data. Frankly, I believe the Fed will be hard-pressed to raise the Fed funds rate again, even in the likely event that core inflation proves to be stubborn. Yet even without relying on this estimate, investors might want to allow the possibility that the Fed funds rate may persist near current levels in 2024.
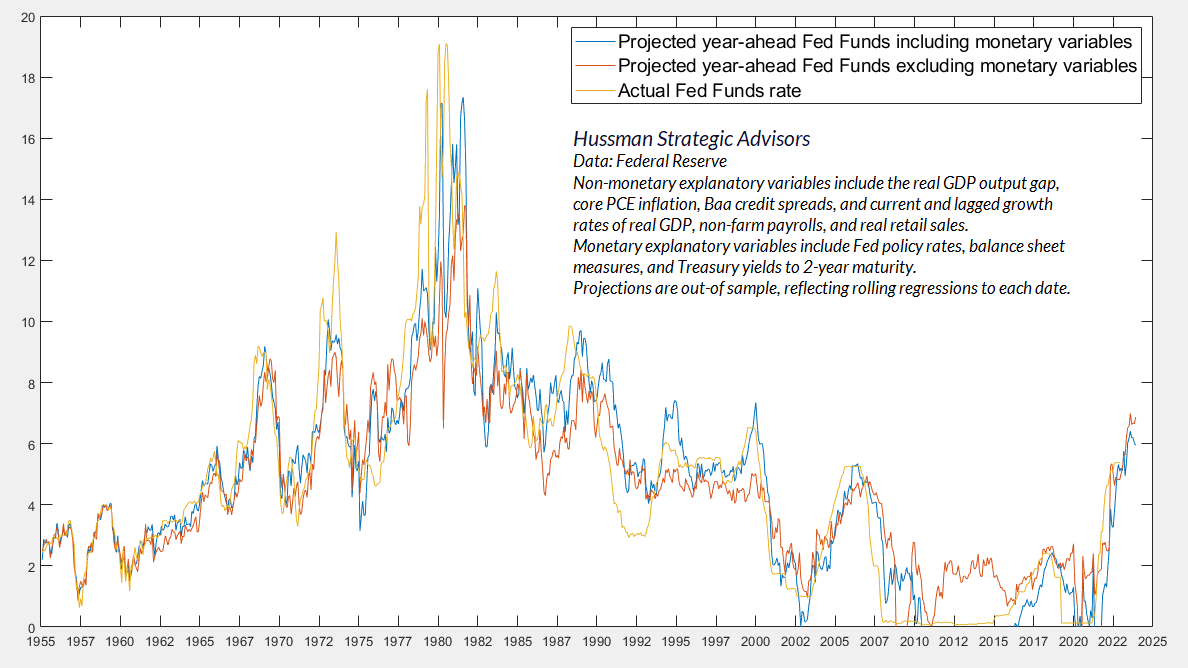
A few additional estimates are worth sharing. In each case, I’ll emphasize that these are not our “forecasts.” It’s better to think of them as implications of prevailing, observable data that are more reliable than extrapolations and “feel facts,” and should not be ruled out.
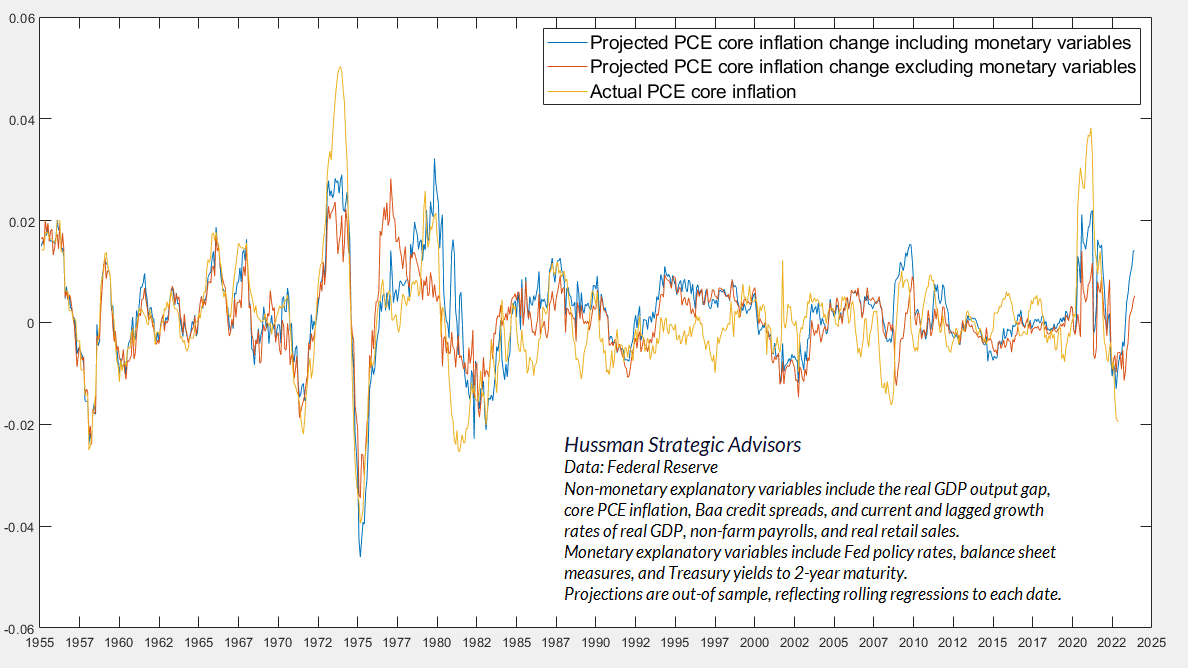
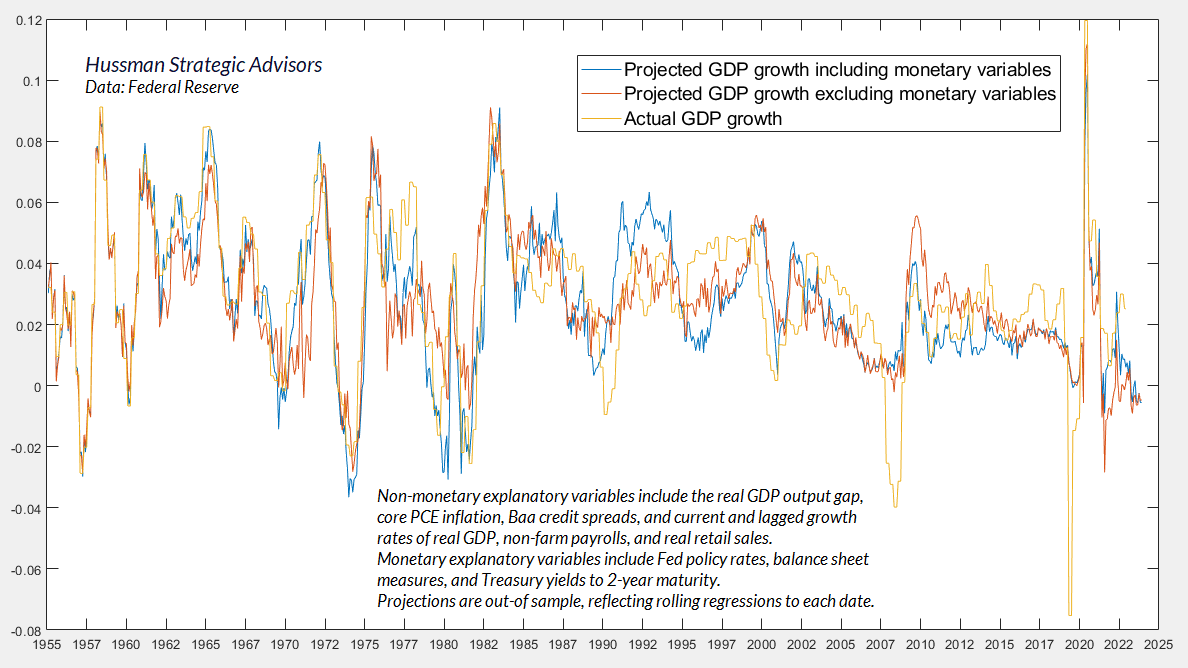
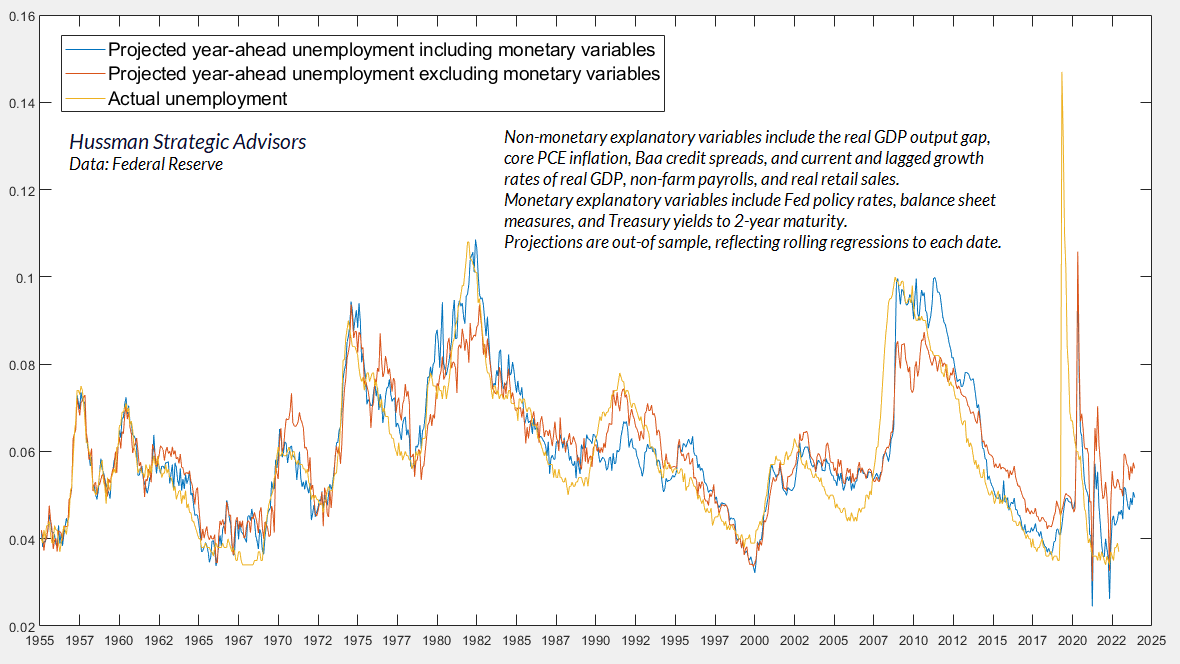
The following estimates are based on current and lagged values of a broad range of relevant variables, including the real GDP output gap, core PCE inflation, Baa credit spreads, current and lagged growth rates of real GDP, non-farm payrolls and real retail sales, as well as Fed policy rates, balance sheet measures, and Treasury yields to 2-year maturity. Each projection in the chart is out-of-sample, meaning that each point is based only on data that was actually observable up to that point.
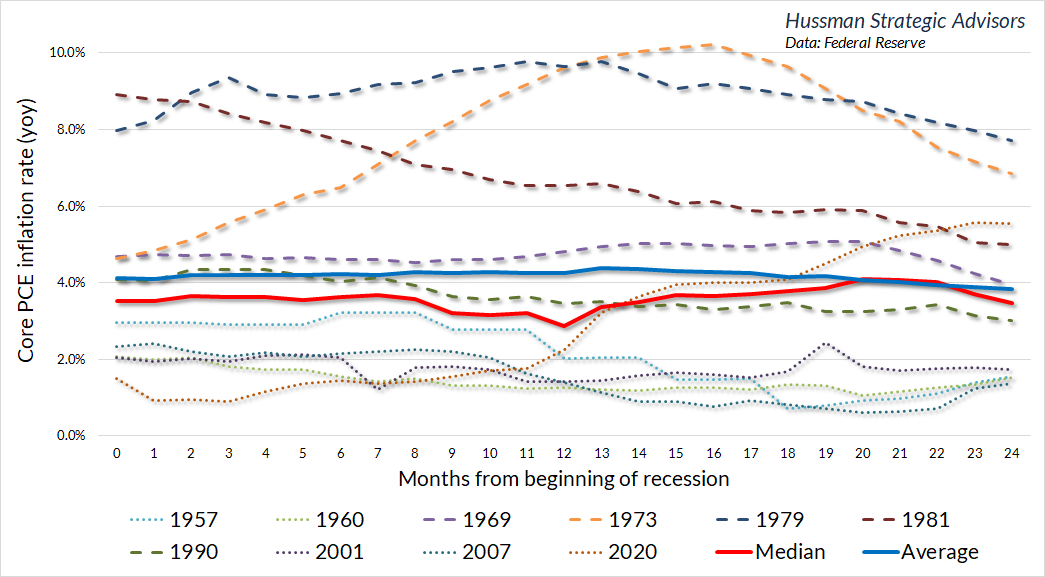
The chart below shows year-ahead projections for core PCE (personal consumption expenditures) price inflation versus the actual subsequent outcome. Clearly, the yellow “actual” line ends 12 months ago, because we haven’t yet observed the coming year’s inflation rate. That said, it’s clear that the recent spike lower has overshot the projections suggested by broad economic data. Currently, these 2024 projections for core PCE inflation are closer to 4% than the Fed’s target of 2%.
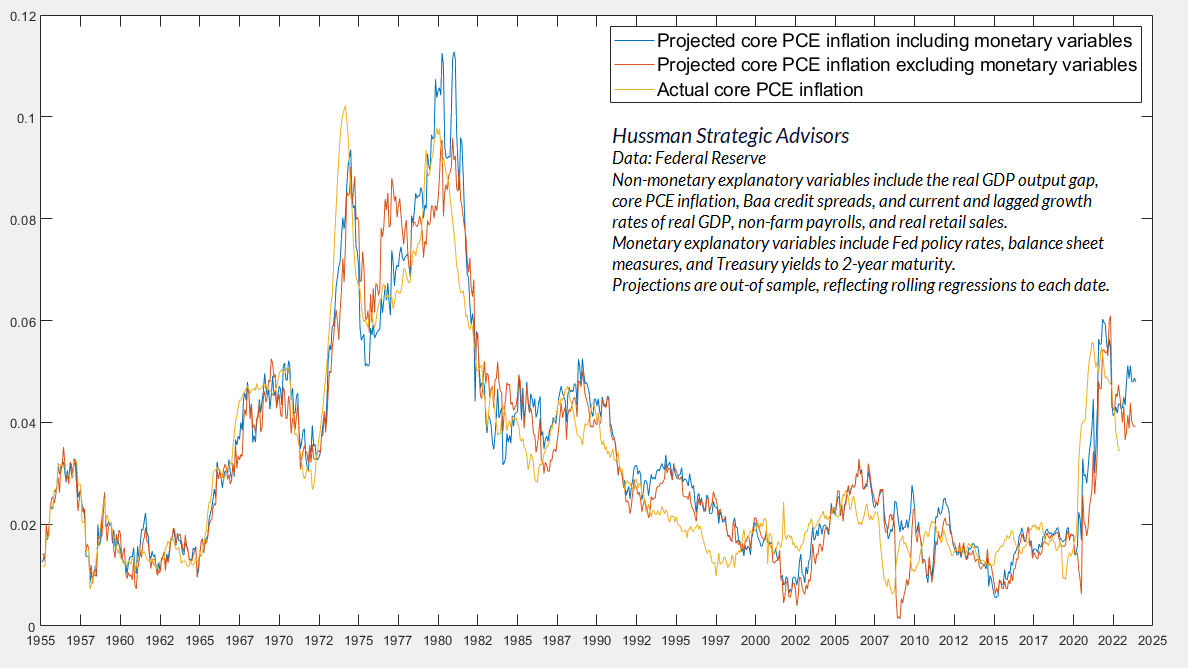
The following chart shows the projected 12-month change in core PCE inflation. Note how the recent easing in core inflation has “overshot” the level consistent with broad economic data. Partly for that reason, these projections imply a modest increase in core PCE inflation over the coming year. There is enough noise in the data that we shouldn’t be tempted to take these projections as “forecasts.” Still, investors should at least consider the possibility that market expectations for a clean and progressive disinflation to the Fed’s 2% target may not be entirely consistent with broad economic evidence.
In recent weeks, the consensus views of economists, journalists, Wall Street analysts, and even some members of the Federal Reserve have shifted toward a “soft landing” narrative, largely ruling out the possibility of a recession in 2024. My own view remains that same one I detailed in November (see Soft-Selling a Hard Landing). Specifically, the data remain consistent with the U.S. economy at the borderline of recession, but we would require additional data to expect that outcome with high confidence. On several key measures, the outlook has even deteriorated slightly in recent months.
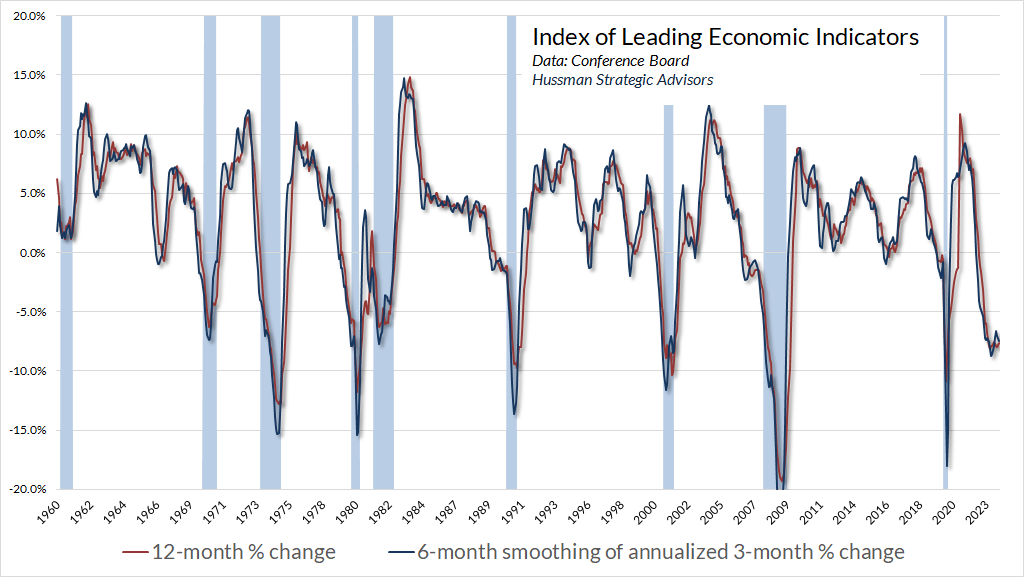
The chart below shows the Conference Board U.S. Leading Index (“leading indicators”). Clearly, this index has never declined to this extent year-over-year except in association with U.S. recessions.
We observe the same implication from broad economic data, which suggest negative real GDP growth in 2024.
Similarly, the projections from broad economic data suggest an increase in the rate of unemployment over the coming year, toward the 5% level. Again, there’s a lot of noise here, so these projections should not be interpreted as “forecasts.” Still, investors invite risk and potential disappointment when they all pile onto one side of the boat when the historical evidence suggests the opposite outcome.
At this point, one might be slightly perplexed: how could the broad economic data suggest flat or even higher core PCE inflation while at the same time suggesting the possibility of a U.S. recession? The answer is that this outcome is actually the norm. Unless you get a banking crisis, inflation typically doesn’t fall by much during a recession, particularly in the first year. The belief to the contrary is an example of “availability bias.” The one instance everyone remembers is the Volcker recession.
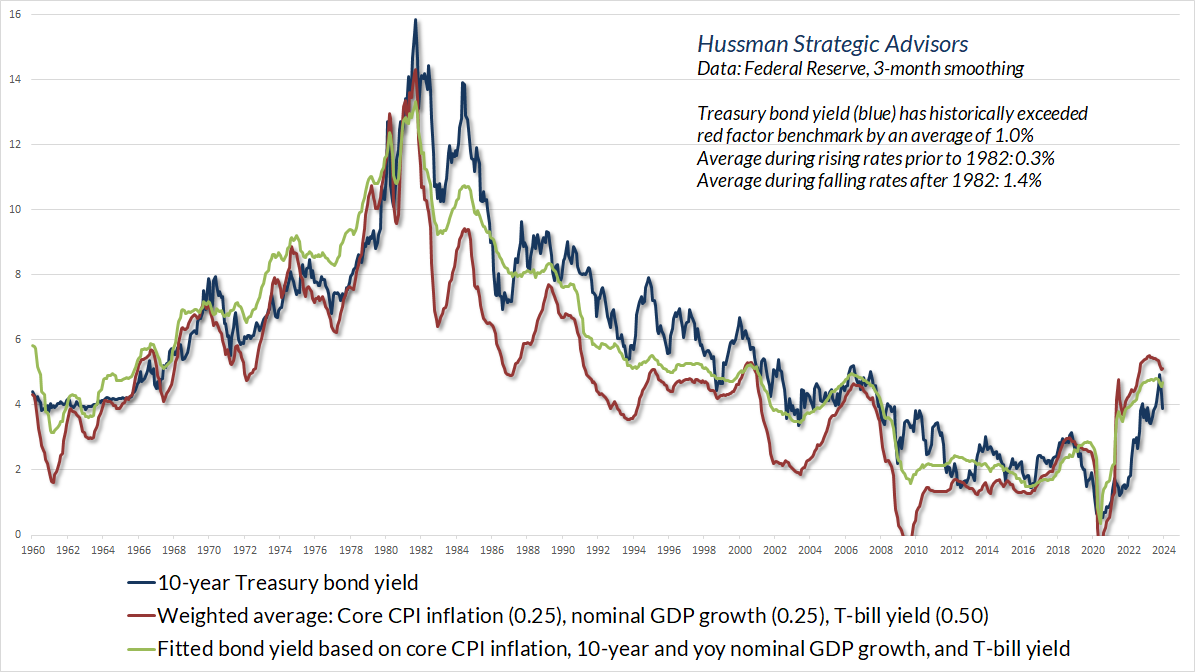
Meanwhile, the bond market has moved to a full-throttle embrace of “pivot” expectations, to the extent that every one of those 7 quarter-point reductions in Fed Funds, core inflation, and nominal GDP growth would be required simply to justify the prevailing yield on 10-year Treasury bonds. Recall that the entire historical total return of Treasury bonds over-and-above T-bills has emerged when the 10-year Treasury yield has been above the weighted-average of T-bill yields (0.5), nominal GDP growth (0.25) and core CPI inflation (0.25). Indeed, bonds have lagged T-bills, on average, except in periods when 10-year yields were higher than both the benchmarks below. As a result, any disappointment in core inflation or rate-cut hopes would likely produce bond market losses as well. With Treasury bill yields still near 5.4%, safe liquidity has significant option value here.
If you have a cyclical slowing, you’re more vulnerable to any negative shocks. And quite separately from growth, on the inflation front, everyone has been enjoying the pace of inflation coming down and extending that into 2024, but inflation doesn’t really work that way. It’s cyclical. It has ebbs and flows, and it doesn’t really fit the script. All of those rate cuts come into question if you assume too far into 2024. People like to extrapolate recent trends. The trend of inflation has been to the downside. There are a number of components of inflation that have been sticky and are likely to continue to be sticky. If you look at wages, they’ve come down off their highs, but they’re very elevated. In particular in the service sector. They’re running at about 5%, and they’re kind of plateauing. That kind of thing is going to give the Fed pause unless they have something else going on. I think we remain vulnerable here. The big risk is not understanding the cyclicality of inflation.”
– Lakshman Achuthan, Economic Cycle Research Institute, CNBC 12/28/23
My own impression is that while core inflation pressures have eased, much of the recent progress is “noise” that has overshot underlying conditions, making it inappropriate to extrapolate the pace of recent improvement. Likewise, I believe that the confidence of investors in a “soft landing” exceeds the confidence offered by the observable data. We can’t rule out a soft landing, but at present, our base case for 2024 features more persistent core inflation than investors seem to expect, a relatively flat Fed Funds rate, increasing risk of a U.S. recession, a higher rate of unemployment, and losses in both the equity and bond markets.
A final note. It’s important to remain optimistic and vigilant about future opportunities, but it’s equally important to avoid expectations that have no basis in the data. Market and economic conditions will change. Valuations will change. Market internals will change. Observable and reliable data will change. With that change will come opportunity – again, and again. As disciplined, historically-informed, full-cycle investors, that’s exactly what will make the coming years “interesting.”
Keep Me Informed
Please enter your email address to be notified of new content, including market commentary and special updates.
Thank you for your interest in the Hussman Funds.
100% Spam-free. No list sharing. No solicitations. Opt-out anytime with one click.
By submitting this form, you consent to receive news and commentary, at no cost, from Hussman Strategic Advisors, News & Commentary, Cincinnati OH, 45246. https://www.hussmanfunds.com. You can revoke your consent to receive emails at any time by clicking the unsubscribe link at the bottom of every email. Emails are serviced by Constant Contact.
The foregoing comments represent the general investment analysis and economic views of the Advisor, and are provided solely for the purpose of information, instruction and discourse.
Prospectuses for the Hussman Strategic Growth Fund, the Hussman Strategic Total Return Fund, and the Hussman Strategic Allocation Fund, as well as Fund reports and other information, are available by clicking “The Funds” menu button from any page of this website.
Estimates of prospective return and risk for equities, bonds, and other financial markets are forward-looking statements based the analysis and reasonable beliefs of Hussman Strategic Advisors. They are not a guarantee of future performance, and are not indicative of the prospective returns of any of the Hussman Funds. Actual returns may differ substantially from the estimates provided. Estimates of prospective long-term returns for the S&P 500 reflect our standard valuation methodology, focusing on the relationship between current market prices and earnings, dividends and other fundamentals, adjusted for variability over the economic cycle. Further details relating to MarketCap/GVA (the ratio of nonfinancial market capitalization to gross-value added, including estimated foreign revenues) and our Margin-Adjusted P/E (MAPE) can be found in the Market Comment Archive under the Knowledge Center tab of this website. MarketCap/GVA: Hussman 05/18/15. MAPE: Hussman 05/05/14, Hussman 09/04/17.